Southampton Strategic Assessment - Homelessness Prevention Review Last Updated June 2018 - Public Health Southampton
←
→
Page content transcription
If your browser does not render page correctly, please read the page content below

Intelligence
& Strategic
  Analysis

                     Southampton
                 Strategic Assessment

               Homelessness Prevention Review

                      Last Updated June 2018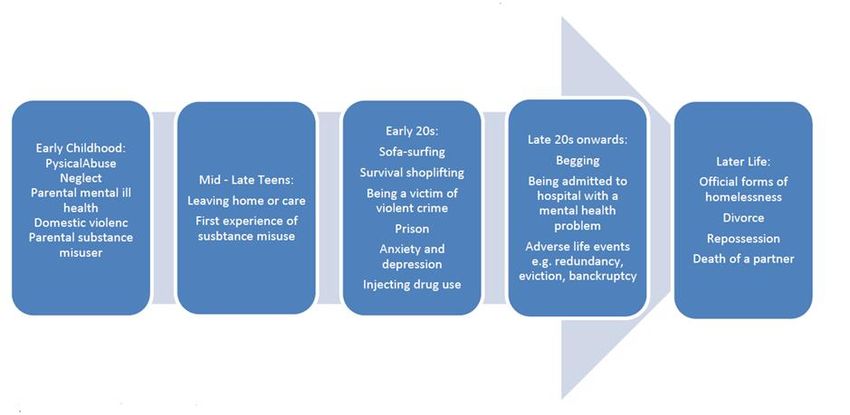
Intelligence                         Southampton Strategic Assessment:
& Strategic                           Homelessness Prevention Review
  Analysis                                      2017/18

             Contents

             Contents .................................................................................................................................................. 2
             1.       Introduction .................................................................................................................................. 4
             1.1      Scope of review ............................................................................................................................ 4
             2.       Context ......................................................................................................................................... 5
             2.1      Impact of Welfare Reform ............................................................................................................ 6
             2.2      Homelessness Reduction Act 2017 ............................................................................................... 8
             3.       Assessment of Need ..................................................................................................................... 9
             3.1      Overview ....................................................................................................................................... 9
                    3.1.1          Statutory homeless applications and acceptances ......................................................... 9
                    3.1.2          People who are sleeping rough .................................................................................... 11
                    3.1.3          Key findings ................................................................................................................... 13
             3.2      Who is accessing services ........................................................................................................... 13
                    3.2.1          Age profile for those who are statutory homeless ....................................................... 13
                    3.2.2          People who are sleeping rough .................................................................................... 15

                                                                                                                                                                             Southampton Strategic Assessment: Homelessness Prevention Review: 2017/18
                    3.2.3          Key findings ................................................................................................................... 16
             3.3      Causes of Homelessness ............................................................................................................. 16
                    3.3.1          Reasons for statutory homelessness ............................................................................ 17
                    3.3.2          Child poverty ................................................................................................................. 18
                    3.3.3          Income .......................................................................................................................... 20
                    3.3.4          Household income ........................................................................................................ 21
                    3.3.5          Unemployment ............................................................................................................. 22
                    3.3.6          Availability and affordability of housing ....................................................................... 23
                    3.3.7          Personal causes of homelessness ................................................................................. 28
                    3.3.8          Key findings ................................................................................................................... 35
             3.4      Homelessness Prevention and Support ...................................................................................... 36
                    3.4.1          Homelessness preventions ........................................................................................... 36
                    3.4.2          Homelessness support .................................................................................................. 39
                    3.4.3          The Homeless Vulnerable Adult Support Team Service ............................................... 39
                    3.4.4          Severe Weather Emergency Provision .......................................................................... 40
                    3.4.5          The Beds, Begging and Business Conference ................................................................ 40
                    3.4.6          Key findings ................................................................................................................... 41

   Intelligence & Strategic Analysis Team
    Southampton City Council, 1st Floor, Municipal Block – West,
                                                                                     Tel: 02380 832493                                                                       2
                                                                                     E-mail: strategy.unit@southampton.gov.uk
   Civic Centre, Southampton, SO14 7LT
                                                                                     Website: www.publichealth.southampton.gov.uk/Health Intelligence/
Intelligence                       Southampton Strategic Assessment:
& Strategic                         Homelessness Prevention Review
  Analysis                                    2017/18

             4.      Reviewing the last strategy......................................................................................................... 42
             4.1     Homelessness Prevention Survey ............................................................................................... 42
             4.2     Update on priority indicators ..................................................................................................... 43
             5.      Future projections ...................................................................................................................... 46
             6.      Conclusions ................................................................................................................................. 47
             7.      Appendices ................................................................................................................................. 50
             7.1     Appendix A: Current Provision ................................................................................................... 50
                   7.1.1         Young People ................................................................................................................ 50
                   7.1.2         Single Adults .................................................................................................................. 52
                   7.1.3         Families ......................................................................................................................... 54
             7.2     Appendix B: Stakeholder Survey................................................................................................. 56
             7.3     Appendix C: Definitions .............................................................................................................. 66

                                                                                                                                                                         Southampton Strategic Assessment: Homelessness Prevention Review: 2017/18

   Intelligence & Strategic Analysis Team
    Southampton City Council, 1st Floor, Municipal Block – West,
                                                                                  Tel: 02380 832493                                                                      3
                                                                                  E-mail: strategy.unit@southampton.gov.uk
   Civic Centre, Southampton, SO14 7LT
                                                                                  Website: www.publichealth.southampton.gov.uk/Health Intelligence/
Intelligence Southampton Strategic Assessment:
& Strategic Homelessness Prevention Review
Analysis 2017/18
1. Introduction
Homelessness prevention is key to developing an effective response to the problem of homelessness
within Southampton. Local authorities have a long-standing responsibility to help homeless
households, but the Homelessness Act 2002 imposed a further duty on them to develop strategies to
prevent homelessness arising1. Local authorities must develop a review which sets out the levels, and
likely future levels of homelessness in their district. This should include any activities which the local
authority are contributing to preventing homelessness, securing accommodation or supporting the
needs of the people in their district.
Moreover, the new Homelessness Reduction Act 2017 requires local authorities to provide or secure
the provision of free services to give people in their area information and advice on preventing
homelessness. It also requires local authorities to help people to secure accommodation if homeless
or likely to become homeless in the future2.
1.1 Scope of review
The purpose of this review is to better understand homelessness in Southampton and determine the
extent to which the population in the district is homeless or at risk of becoming homeless. This review
will inform the Southampton Homeless Prevention Strategy.
Southampton Strategic Assessment: Homelessness Prevention Review: 2017/18
The review will consider current and future levels of homelessness in Southampton based on:
Existing casework records and other local sources of data;
Trends in homelessness approaches and in underlying causes;
Which cohorts may be more likely to become homeless or be threatened with homelessness;
The profile of households who have experienced homelessness in their district;
Equality monitoring data, including that relating to homelessness applications and outcomes;
The range of factors that may affect future levels of homelessness;
The personal and structural factors that may contribute to people becoming homeless;
Any planned legislation or local policy changes that are likely to impact on levels of
homelessness for particular groups in the district.
1
Shelter England (2007). Homelessness Prevention [Online]. Available from:
http://england.shelter.org.uk/professional_resources/policy_and_research/policy_library/policy_library_folde
r/homelessness_prevention [Accessed 11 May 2018].
2
The charter Institute of Housing (2017). What you need to know about the
Homelessness Reduction Act 2017 [Online]. Available from:
http://www.cih.org/resources/PDF/Policy%20free%20download%20pdfs/What%20you%20need%20to%20kno
w%20Homelessness%20Reduction%20Act%202017.pdf [Accessed 11 May 2018].
Intelligence & Strategic Analysis Team
Southampton City Council, 1st Floor, Municipal Block – West,
Tel: 02380 832493 4
E-mail: strategy.unit@southampton.gov.uk
Civic Centre, Southampton, SO14 7LT
Website: www.publichealth.southampton.gov.uk/Health Intelligence/Intelligence Southampton Strategic Assessment:
& Strategic Homelessness Prevention Review
Analysis 2017/18
2. Context
This review comes at a time when the extent of homelessness across England is increasingly
challenging. The term “homeless” includes those who are statutory homeless, people who are rough
sleeping and sofa surfers, all of whom are referred to separately within this report. For full definitions
see Appendix C. At any one time there are as many as 4,750 people sleeping rough on the streets of
England, and more than 78,000 households, including over 120,000 children, are housed by Local
Authorities in temporary homelessness accommodation. In addition, there are believed to be high
numbers of ‘hidden homeless’ people who are housed by family and friends in shifting circumstances,
but not always captured as part of the official figures3.
Homelessness has increased nationally and since 2010 the number of households in temporary
accommodation has increased by more than 60%; since March 2011 the number of people who sleep
rough has risen by 134%. Underpinning these upward trends are the various causes of homelessness,
of which, the most important remains the supply and affordability of decent housing in the South East
and South of England. Over the last few years there has been a noticeable rise in London boroughs
now having to place families outside of London4.
Southampton has not been immune to these national developments. Southampton’s recorded street
count of people who are sleeping rough, which was independently verified, whilst remaining lower
Southampton Strategic Assessment: Homelessness Prevention Review: 2017/18
than many South Coast cities has risen between 2010 and 2017 (see Figures 3.1.4 and 3.1.5 for further
information). In addition, although Southampton has good systems and pathways in place for
homeless families, such as the Street Homeless Prevention Team, Day Centre support services and
pathways for housing through Patrick House, Southampton City Council (SCC) has seen a reduction in
homeless preventions in part due to shortages of private landlords. Some families in the city have seen
significant income shocks, associated with welfare reforms such as the Benefit Cap, frozen Local
Housing Allowances and delays associated with initial payments under Universal Credit. This is
resulting in debt and people are relying more and more on friends and families for help.
Against this backdrop of increasing levels of homelessness across the country, the Government has
introduced new legislation. The Homelessness Reduction Act 20175 will bring with it new ways of
working and new methods of recording homelessness, enabling the provision of more homelessness
advice and assistance. The new Act will involve staff working with clients on joint housing and relief
plans, in addition to helping some households find work or increasing hours. Regrettably, however,
3
The Guardian (2018). Rough sleeper numbers in England rise for seventh year running [Online]. Available
from: https://www.theguardian.com/society/2018/jan/25/rough-sleeper-numbers-in-england-rise-for-
seventh-year-running [Accessed 11 May 2018].
4
BBC News (2017). Homeless families rehoused out of London ‘up five-fold’ [Online]. Available from:
http://www.bbc.co.uk/news/uk-england-london-39386587 [Accessed 11 May 2018].
5
Homelessness Reduction Act 2017, [Online]. Available from:
http://www.legislation.gov.uk/ukpga/2017/13/contents/enacted [Accessed 11 May 2018].
Intelligence & Strategic Analysis Team
Southampton City Council, 1st Floor, Municipal Block – West,
Tel: 02380 832493 5
E-mail: strategy.unit@southampton.gov.uk
Civic Centre, Southampton, SO14 7LT
Website: www.publichealth.southampton.gov.uk/Health Intelligence/Intelligence Southampton Strategic Assessment:
& Strategic Homelessness Prevention Review
Analysis 2017/18
supplies of affordable housing within the South are limited6, and reducing the number of households
in priority need and people who are sleeping rough will be an increasingly difficult challenge.
2.1 Impact of Welfare Reform
The largest and most ambitious welfare reform over the past few decades has been the gradual
implementation of Universal Credit. Universal Credit is a single monthly payment for people of
working age that replaced six existing benefits – housing benefit, child tax credit, income support,
working tax credit, income-based job seeker’s allowance and income related employment and support
allowance (ESA). It is paid monthly in arrears to people aged 16 and over who are in employment, or
who are out of work and looking for a job.
Universal Credit may have had some potential impacts on homelessness, such as:
1. Claimants must wait six weeks or longer before they receive their first monthly payment. This
includes a seven-day period, so called ‘waiting days’, when many claimants do not qualify for
any money.
2. Benefit Offices have struggled with the roll-out of Universal Credit in regards to paying
claimants on time each month. Department for Work and Pension figures show that 96% of
Universal Credit claimants receive some money on time and 92% receive everything they are
Southampton Strategic Assessment: Homelessness Prevention Review: 2017/18
owed on time. However, among new claimants, just 85% of households receive some money
on time and only 76% receive full payment on time.
3. Social landlords claim that rent arrears among tenants are increasing due to universal credit.
One Housing Trust based in North West England has reported that its rent arrears have risen
by £400,000 in the past 12 months due to Universal Credit.
4. The switch from fortnightly payments to monthly payments which may be impacting families
who have difficulty managing a monthly budget.
5. The use of advancement payments whilst waiting for Universal Credit to start, which has been
described as too small and are generally paid back over the course of six months through
deductions from Universal Credit causing further debt7.
National research by four leading homelessness and housing charities (Centre Point, Homeless Link,
Shelter, St Mungo’s) revealed certain case studies where vulnerable people who were switched to
6
Independent (2016). England's 50 worst homelessness hotspots revealed as study finds 255,000 people have
no permanent home [Online]. Available from: https://www.independent.co.uk/news/uk/home-
news/homelessness-england-numbers-shelter-study-worst-city-hotspots-london-manchester-rate-rough-
sleeping-a7448521.html [Accessed 11 May 2018].
7
Shelter et al (2017). Homelessness and Universal Credit [Online]. Available from:
https://www.homeless.org.uk/sites/default/files/site-
attachments/Briefing%20on%20Universal%20Credit%20and%20homelessness%20Sept%202017.pdf [Accessed
11 May 2018].
Intelligence & Strategic Analysis Team
Southampton City Council, 1st Floor, Municipal Block – West,
Tel: 02380 832493 6
E-mail: strategy.unit@southampton.gov.uk
Civic Centre, Southampton, SO14 7LT
Website: www.publichealth.southampton.gov.uk/Health Intelligence/Intelligence Southampton Strategic Assessment:
& Strategic Homelessness Prevention Review
Analysis 2017/18
Universal Credit were left for over ten weeks with no payment made, due to the 6 week wait and
errors from the Department of Work and Pensions8. This caused significant hardship, and one claimant
had to borrow money from friends and at times went without meals. Having no income meant that
rent arrears quickly built up and the claimant’s landlord was in the process of eviction. The claimant
also received an advancement payment five weeks after the original Universal Credit application was
made, which then had to be paid back at £52.40 per month once Universal Credit was in payment,
which caused further hardship and added to the risk of eviction.
Further research highlighted that many people who are homeless, or have been homeless, have a
difficulty with managing a monthly budget, particularly when a change in circumstances has led to a
new Universal Credit claim, as well as the setbacks this has on recovering from homelessness. This is
a particular problem as Universal Credit is paid monthly. Homelessness charities have presented many
examples of individuals who struggle with monthly budget planning as being one key risk in
jeopardising a person’s recovery from homelessness, especially those with mental health conditions
and substance misuse problems.
The implementation of the benefit cap could also affect homelessness as it imposes a limit on the total
amount of benefits that most people aged 16–64 can get. This commenced between 15 April 2013
and May 2017 when the benefit cap was introduced effecting 150,000 households; the number of
capped households increased after 7 November 2016 after further reductions in benefit cap9. For most
households, the benefit cap was applied by reducing the amount of housing benefit they receive, so
Southampton Strategic Assessment: Homelessness Prevention Review: 2017/18
that their total benefits no longer add up to more than the cap level. This is now applied through
Universal Credit, which is still being rolled out across the country at the time this report was written.
Current benefit cap amounts across the country are as follows:
If you live outside Greater London, the cap is:
£384.62 per week (£20,000 a year) if you’re in a couple, whether your children live with you
or not;
£384.62 per week (£20,000 a year) if you’re single and your children live with you;
£257.69 per week (£13,400 a year) if you’re single and you do not have children, or your
children do not live with you.
If you live in Greater London, the cap is:
£442.31 per week (£23,000 a year) if you’re in a couple, whether your children live with you
or not;
£442.31 per week (£23,000 a year) if you’re single and your children live with you;
8
Ibid
9
Department for Work and Pensions (2017). Benefit Cap [Online]. Available from:
https://assets.publishing.service.gov.uk/government/uploads/system/uploads/attachment_data/file/634937/
benefit-cap-statistics-to-may-2017.pdf [Accessed 11 May 2018].
Intelligence & Strategic Analysis Team
Southampton City Council, 1st Floor, Municipal Block – West,
Tel: 02380 832493 7
E-mail: strategy.unit@southampton.gov.uk
Civic Centre, Southampton, SO14 7LT
Website: www.publichealth.southampton.gov.uk/Health Intelligence/Intelligence Southampton Strategic Assessment:
& Strategic Homelessness Prevention Review
Analysis 2017/18
£296.35 per week (£15,410 a year) if you’re single and you do not have children, or your
children do not live with you.
Furthermore, the government have issued a freeze on benefit payments for families with more than
two children, unless your children were born before 6 April 2017. People who have three or more
children will not be paid an additional amount towards Universal Credit and this could see families
with larger families, and who are receiving benefits, struggle more financially10.
2.2 Homelessness Reduction Act 2017
The Homelessness Reduction Act commenced in April 2018, and places a new duty on local authorities
to help prevent the homelessness of all families and single people, regardless of priority need, who
are eligible for assistance and threatened with homelessness. The key measures in the Act include:
Local Authorities should treat someone as threatened with homelessness from 56 days after
they were given notice to leave, up from 28 days previously. This forces local authorities to
act quickly and proactively, and gives local authorities the duty to assist an applicant 56 days
before they are made homeless.
A new duty to help all those threatened with homelessness, even if they fall outside of priority
need. Local Authorities must help people stay in their current accommodation or find
Southampton Strategic Assessment: Homelessness Prevention Review: 2017/18
somewhere for them to live.
A new duty to relieve homelessness for all eligible applicants, regardless of priority need. This
could be, for example, the provision of a rent deposit or debt advice.
A new duty for public services to notify a local authority if they come into contact with
someone they think may be homeless or at risk of becoming homeless.
The government has committed to provide £72.7 million to local authorities to meet the new cost
associated with the additional duties contained within the Act over the course of the Spending Review.
Charities and the Local Government Association are generally positive about the Act, although do not
think that it will reduce homelessness on its own without real changes to affordable housing numbers.
Local Authorities have also expressed concerns over whether the funding to cover the extra burdens
from the Act is sufficient, and the Government underestimating the increased workload expected due
to the Act11.
10
Gov.uk (2017). 2 Child limit: claiming benefits for more than 2 children [Online]. Available from:
https://www.gov.uk/guidance/claiming-benefits-for-2-or-more-children [Accessed 11 Mat 2018].
11
Local Government Information Unit (2018). Briefing: Homelessness Reduction Act 2017 [Online]. Available
from: https://www.lgiu.org.uk/pdfdownload/?b=homelessness-reduction-act-
2017&key=796e2f57fd87b9b44251e692e269f0bf [Accessed 11 May 2018].
Intelligence & Strategic Analysis Team
Southampton City Council, 1st Floor, Municipal Block – West,
Tel: 02380 832493 8
E-mail: strategy.unit@southampton.gov.uk
Civic Centre, Southampton, SO14 7LT
Website: www.publichealth.southampton.gov.uk/Health Intelligence/Intelligence Southampton Strategic Assessment:
& Strategic Homelessness Prevention Review
Analysis 2017/18
3. Assessment of Need
This section provides a quantitative overview of homelessness in Southampton, using nationally
recorded data to benchmark against the national average and statistically similar ONS comparator
areas, to examine how homelessness rates have changed in recent years. This section will also review
data collected internally by Southampton City Council (SCC) in order to provide a review of who is
accessing services in the city. The overview looks briefly at the three areas of statutory homelessness
and people who are sleeping rough, each of these is explained in more detail later on in the report.
3.1 Overview
3.1.1 Statutory homeless applications and acceptances
Figure 3.1.1 looks at cases where the local authority is satisfied that the applicant is eligible for
assistance, unintentionally homeless and falls within a specified priority need group. Such statutorily
homeless households are referred to as ‘acceptances’12. In 2017/18, Southampton had 264
households accepted, a rate of 2.53 per 1,000 households; higher than the England average (2.41), yet
significantly lower than south coast neighbours Bournemouth (3.78) and Portsmouth (5.29).
Figure 3.1.1
Southampton Strategic Assessment: Homelessness Prevention Review: 2017/18
12
GOV.UK (2013) Homelessness data: notes and definitions, [Online] Available from:
https://www.gov.uk/guidance/homelessness-data-notes-and-definitions [Accessed 27the February 2018].
Intelligence & Strategic Analysis Team
Southampton City Council, 1st Floor, Municipal Block – West,
Tel: 02380 832493 9
E-mail: strategy.unit@southampton.gov.uk
Civic Centre, Southampton, SO14 7LT
Website: www.publichealth.southampton.gov.uk/Health Intelligence/Intelligence Southampton Strategic Assessment:
& Strategic Homelessness Prevention Review
Analysis 2017/18
The data in Figure 3.1.2 shows the acceptance rate trend for SCC and England since 2009/10, alongside
SCC applications for statutory homelessness. There has been a significant increase of acceptances in
Southampton between 2015/16 and 2016/17; a 74.5% increase compared to a 2.4% increase
nationally over the same time period. Between 2016/17 and 2017/18 in Southampton there was a
smaller 1.5% increase. As this is the second year at this high rate, it is likely that this higher rate is
reflective of new level of need, rather than an isolated peak.
The total number of applications to the council follows a similar trend to the acceptance rate, with
there being a 72.1% increase over the 2015/16 to 2016/17 time period followed by a 5.1% reduction
in 2017/18. Over time the trend of applications has largely followed the trends for acceptances
showing that the demand has increased in the city rather than SCC accepting a higher proportion of
the same number of applications.
Figure 3.1.2
Southampton Strategic Assessment: Homelessness Prevention Review: 2017/18
The reasons for this increase are discussed in more detail throughout this document. These include
both personal and structural factors as to why people become homeless. For example there has been
an increase in numbers being accepted as priority need due to poor physical and mental health, whilst
the welfare reforms discussed previously (e.g. introducing Benefit Cap and Universal Credit) are also
likely to have contributed to this increase.
Universal Credit is paid directly to the claimant who is then responsible for paying their landlord; this
may have led to landlords being less likely to accept tenants on Universal Credit. The ultimate impact
of this is fewer rental properties being available and a greater demand on homelessness services. This
may also explain the decrease which is seen in preventions13 (see Figure 3.4.1), if preventions go down
13
Preventions: providing people with the ways and means to address their housing and other needs to avoid
homelessness.
Intelligence & Strategic Analysis Team
Southampton City Council, 1st Floor, Municipal Block – West,
Tel: 02380 832493 10
E-mail: strategy.unit@southampton.gov.uk
Civic Centre, Southampton, SO14 7LT
Website: www.publichealth.southampton.gov.uk/Health Intelligence/Intelligence Southampton Strategic Assessment:
& Strategic Homelessness Prevention Review
Analysis 2017/18
because people have no accommodation to move into then rates of statutory homeless will go up.
Added to this, Local Housing Allowance rates (paid to low-income families in the private rented sector
to help them cope with high housing costs), has been frozen by central government as rental prices
continue to rise (see Figure 3.3.10 and accompanying text for further information).
These structural changes will have impacted people across the country but the rate of homelessness
and in priority need in England has not seen the increase in the last year that Southampton has. This
suggests that the population of Southampton may be more vulnerable to these changes than other
parts of the country which could see rates of homelessness in Southampton rise above the England
rate in the next few years.
3.1.2 People who are sleeping rough
The Department for Communities and Local Government publishes an annual count and estimates of
people that are sleeping rough in England every autumn. The counts and estimates are single night
snapshots of the number of people who are sleeping rough in local authority areas. These numbers
are provided by Local Authorities who either conduct a street count or provide an estimate. The counts
are based on one night of counting and can be affected by adverse weather. In addition, if a person
who had been sleeping rough had found a squat to use at the time of the count, they would not be on
the street and therefore would not be counted.
Southampton Strategic Assessment: Homelessness Prevention Review: 2017/18
For the 2017 autumn count there were 29 people were counted sleeping rough in Southampton.
Figure 3.1.3 shows the count rate for Southampton against its ONS comparator areas. Southampton
has a rate which is higher than the England average, and about midway compared to comparator
areas. However, the small numbers mean that the differences are not statistically significant.
Figure 3.1.3
Intelligence & Strategic Analysis Team
Southampton City Council, 1st Floor, Municipal Block – West,
Tel: 02380 832493 11
E-mail: strategy.unit@southampton.gov.uk
Civic Centre, Southampton, SO14 7LT
Website: www.publichealth.southampton.gov.uk/Health Intelligence/Intelligence Southampton Strategic Assessment:
& Strategic Homelessness Prevention Review
Analysis 2017/18
The trend data for the annual rough sleeping count is prone to fluctuations for the reasons discussed
above. However, as figure 3.1.4 demonstrates, there does appear to be an overall rising trend in
Southampton, with the biggest increase recorded between 2010 and 2011. The rate in Southampton
has generally higher than the England average over the period studied; although only statistically
significantly higher in 2011 and 2015. The overall rate for England has also steadily increased over
time (since 2010), suggesting an increased level of need nationally as well as locally. However, it should
be noted that the annual homelessness monitoring report by Crisis14 questions the validity of this data,
as in 2016, 85% of returns were estimates. The report also states that any increase in people who are
sleeping rough is most likely to be due to tenancy breakdowns very often associated with benefit
restrictions, cuts to services and growing mental health problems.
Figure 3.1.4
Southampton Strategic Assessment: Homelessness Prevention Review: 2017/18
Figure 3.1.5
14
Fitzpatrick. S, Pawson. H, Bramley. G, Wilcox. S, and Watts. B, (2017) The homelessness monitor: England
2017, Crisis, [Online] Available from:
https://crisis.org.uk/media/236823/homelessness_monitor_england_2017.pdf [Accessed 27 February 2018].
Intelligence & Strategic Analysis Team
Southampton City Council, 1st Floor, Municipal Block – West,
Tel: 02380 832493 12
E-mail: strategy.unit@southampton.gov.uk
Civic Centre, Southampton, SO14 7LT
Website: www.publichealth.southampton.gov.uk/Health Intelligence/Intelligence Southampton Strategic Assessment:
& Strategic Homelessness Prevention Review
Analysis 2017/18
In addition to the annual count, Southampton City Council undertakes a separate count each month
of people who are sleeping rough; a count is conducted on one night each month. Figure 3.1.5 shows
the trend in these counts between 2011/12 and 2017/18 and, despite expected fluctuations,
illustrates an overall increasing trend in rough sleepers in the city over time. The characteristics of
people who are sleeping rough in Southampton are explored later on in this document.
3.1.3 Key findings
Overall Southampton is seeing an increasing trend in the number (and rate) of people who
are homeless and in priority need, applications for homelessness and people who are sleeping
rough.
Trends are also increasing in England, although the increase is not to the same extent.
Amongst other reasons this could be due to Southampton residents being more vulnerable to
structural changes in benefit policy as well as being more at risk of the personal risks of
homelessness.
3.2 Who is accessing services
This section considers the characteristics of those who have been accepted as being homeless and in
priority need, applied for homelessness prevention and those who are rough sleeping in order to
Southampton Strategic Assessment: Homelessness Prevention Review: 2017/18
better understand who are most vulnerable in the city.
3.2.1 Age profile for those who are statutory homeless
The highest proportion of acceptances are among the 25-44 age group which accounted for 55% of all
acceptances during 2016/17. Looking at the numbers in each age group, homeless acceptances among
the 25-44 age group doubled between 2015/16 and 2016/17 from 72 to 144. During the same time
period homelessness acceptances for those aged 45 and over has remained the lowest among all age
groups although between 2015/16 and 2016/17 the overall number has doubled.
Figure 3.2.1 Percentage and number of those who are homeless and in priority need by age groups-
Southampton: 2008/09 to 2016/17
Age
2008/09 2009/10 2010/11 2011/12 2012/13 2013/14 2014/15 2015/16 2016/17
Group
34.3% 32.3% 36.0% 38.9% 54.5% 46.6% 35.1% 41.6% 32.3%
16-24 (57) (72) (62) (72) (30) (83) (65) (62) (84)
48.8% 43.9% 50.0% 46.5% 34.5% 39.9% 57.8% 48.3% 55.4%
25-44 (81) (98) (86) (86) (19) (71) (107) (72) (144)
16.9% 23.8% 14.0% 14.6% 10.9% 13.5% 7.0% 10.1% 12.3%
45 + (28) (53) (24) (27) (6) (24) (13) (15) (32)
Note: Percentages may not sum due to rounding.
Among those aged 16-24, numbers of statutory homelessness increased by 35% between 2015/16
and 2016/17; in Southampton these are predominantly young families with children or with a child
Intelligence & Strategic Analysis Team
Southampton City Council, 1st Floor, Municipal Block – West,
Tel: 02380 832493 13
E-mail: strategy.unit@southampton.gov.uk
Civic Centre, Southampton, SO14 7LT
Website: www.publichealth.southampton.gov.uk/Health Intelligence/Intelligence Southampton Strategic Assessment:
& Strategic Homelessness Prevention Review
Analysis 2017/18
expected. Public Health England highlight homelessness among this age group as being of particular
concern as homeless young people are less likely to be in education, employment or training (NEET)
or experiencing a disrupted education. Poverty and desperation means some homeless young people
can turn to crime, which further decreases the chances of them finding work and escaping their
situation. Homeless young people are also more likely to be victims of crime, as their situation puts
them at risk of exploitation, particularly if they become homeless at a very young age15. Nationally,
24% of homeless young people are LGBTQ+ (Lesbian, Gay, Bisexual, Transgender, Queer or
Questioning) and 77% of them identify coming out as the main cause of their homelessness16.
Figure 3.2.2
Figure 3.2.2 shows national rates of those accepted homeless households headed by an applicant aged Southampton Strategic Assessment: Homelessness Prevention Review: 2017/18
16-2417, the reason that these households are priority need might be the age of the applicant or
because they are expecting or have a child. Southampton ranks 4th highest amongst comparator areas
and has a rate significantly higher than England. As mentioned above, in the last year there was a 35%
increase in this age group following a trend which has been decreasing since 2013/14. In England there
was a 2.5% decrease in this age group between 2015/16 and 2016/17 and rates have been decreasing
15
Public Health England (2017) Public Health Profiles: Indicator Definitions and Supporting Information.
[Online] Available from:
https://fingertips.phe.org.uk/search/homelessness#page/6/gid/1/pat/6/par/E12000008/ati/102/are/E060000
45/iid/92695/age/264/sex/4 [Accessed 6 March 2018].
16
The Albert Kennedy Trust (2017) inter-AKT [Online] Available from: https://www.akt.org.uk/ [Accessed 23rd
May 2018]
17
The definition is: households found to be eligible for assistance, unintentionally homeless and falling within a
priority need group, and consequently owed a main homelessness duty by a local housing authority. Figures
reflect decisions under the 1996 Housing Act, and any residual 1985 Housing Act cases.
Intelligence & Strategic Analysis Team
Southampton City Council, 1st Floor, Municipal Block – West,
Tel: 02380 832493 14
E-mail: strategy.unit@southampton.gov.uk
Civic Centre, Southampton, SO14 7LT
Website: www.publichealth.southampton.gov.uk/Health Intelligence/Intelligence Southampton Strategic Assessment:
& Strategic Homelessness Prevention Review
Analysis 2017/18
nationally since 2011/12 (see Figure 3.2.3). It should be noted that in Southampton this age group
contains a large number of young families which may not be the case in other areas.
Figure 3.2.3
When considering all young people referrals to homelessness services, there has been a reduction in
the number who returned home, which is currently at a three year low. Anecdotal observations from
the Homelessness Mediation Outreach Team suggest that this could in part be due to the benefit cap
Southampton Strategic Assessment: Homelessness Prevention Review: 2017/18
meaning parents can no longer afford to have their children at home. There were a total of 97 referrals
of young people in 2016/17 with the majority (22) housed long term, 20 were housed in emergency
accommodation and 19 were returned home. The rise in acceptances in this age group may also reflect
a lack of affordable accommodation available to people in this age group (see section 3.3.5 on
availability and affordability of housing).
3.2.2 People who are sleeping rough
In November 2017 a small team of workers from local providers (Society of St James Hostels, Homeless
Vulnerable Adult Support Team and Southampton City Council’s Street Homeless Prevention Team)
carried out a survey of people who were begging and/or not in stable accommodation in the city. The
survey team approached people who were sleeping rough, people who were begging and some people
were approached in hostels. The responses from 40 people were recorded (80% male and 20%
female). Of these, 45% were aged 35-44 and 90% identified as White. A total of 26 respondents said
that they beg, of these 16 people beg every day and 6 beg several times a week, 69% of people who
beg are sleeping rough and 19% are in hostels with the remainder in social rented or supported
housing. The numbers accessing specific services was not widely recorded, however 31 people (78%)
reported a use of or dependence on drugs or alcohol and of those, 68% stated they were ‘known to
substance misuse services’. In addition, 26 respondents reported concerns around mental ill health,
yet of this group, only 31% reported that they were known to mental health services.
Intelligence & Strategic Analysis Team
Southampton City Council, 1st Floor, Municipal Block – West,
Tel: 02380 832493 15
E-mail: strategy.unit@southampton.gov.uk
Civic Centre, Southampton, SO14 7LT
Website: www.publichealth.southampton.gov.uk/Health Intelligence/Intelligence Southampton Strategic Assessment:
& Strategic Homelessness Prevention Review
Analysis 2017/18
Of the people surveyed, 27 (68%) reported not being in stable accommodation as they were either
sleeping rough (25 people) or sofa surfing (2 people). Other accommodation included living in a hostel
(23%) council provided or other social housing (5%) and supported housing (5%). Substance misuse
was reported as the main barrier for individuals not accessing accommodation, with 7 people citing
this as a factor. Financial concerns (rent arrears/ money for rent deposits) were also a key factor, with
6 people citing this barrier. The vast majority of respondents had a local connection; lack of a local
connection was only cited by 5 people as a factor impeding their access to stable accommodation and
3 people reported that they did not want to go to or were barred from hostels.
The survey did not ask how long people have been begging or rough sleeping. However, an evidence
review by Public Health England (PHE) looking at adults with complex needs (with a particular focus
on street begging and street sleeping)18, cites a consultation conducted with street homeless
conducted by the charity Reaching Out. Reaching Out found that amongst the 257 people they
interviewed in England:
10% had had a permanent place to stay within the last 6 months
44% had occupied permanent accommodation in the last year
32% had not had a permanent place to stay for more than 3 years
11% had not had a permanent place to stay for more than 10 years
The information shows that 43% of people have not had a permanent place to stay for over 3 years so
Southampton Strategic Assessment: Homelessness Prevention Review: 2017/18
for many people this is not a short-term problem.
3.2.3 Key findings
The highest proportion of acceptances are among the 25-44 age group which accounted for
55% of all acceptances during 2016/17.
Within Southampton there has been a reduction in the number of homeless young people
who returned home, which is currently at a three year low.
In a survey of people who were begging and/or sleeping rough in Southampton, substance
misuse was reported as the main barrier for individuals not accessing accommodation.
Financial concerns (rent arrears/ money for rent deposits) were also a key factor.
National data shows that 43% of people have not had a permanent place to stay for over 3
years so for many people this is not a short-term problem.
3.3 Causes of Homelessness
The causes of homelessness are often complex, the reasons for statutory homelessness recorded by
SCC are reported below, although they do not consider the wider reasons behind homelessness. In
addition the charity Crisis along with Heriot Watt University published a report in 2017 which used
18
Public Health England (2017) Evidence review: Adults with complex needs (with a particular focus on street
begging and street sleeping).
Intelligence & Strategic Analysis Team
Southampton City Council, 1st Floor, Municipal Block – West,
Tel: 02380 832493 16
E-mail: strategy.unit@southampton.gov.uk
Civic Centre, Southampton, SO14 7LT
Website: www.publichealth.southampton.gov.uk/Health Intelligence/Intelligence Southampton Strategic Assessment:
& Strategic Homelessness Prevention Review
Analysis 2017/18
secondary data sources including panel surveys, statutory statistics and academic studies to examine
homelessness between 2011 and 2016, the key findings of this report are discussed below19.
Homelessness is caused by a complex interplay between a person's individual circumstances and
adverse 'structural' factors outside their direct control20. Structural causes of homelessness are social
and economic in nature, and are often outside the control of the individual or family concerned. The
structural causes of homelessness include poverty, lack of affordable housing and policy changes, all
of which are discussed in this section of the report.
3.3.1 Reasons for statutory homelessness
There are often multiple and complex reasons for the loss of a home, but common causes of
homelessness acceptances amongst applications to the council are: end of Assured Shorthold Tenancy
(AST), relationship breakdown or friends or family no longer able to accommodate.
In Southampton in 2016/17 half of acceptances were rooted in the end of an AST and half due to
interpersonal issues and risks. The rise in the end of AST could be due to the impacts felt from 2nd
phase of benefit cap. Another factor could be landlords withdrawing from the market or moving to
the professional market to reduce business risks. Universal Credit was not in place for 2015/16 but it
could be the anticipation of it persuaded landlords to withdraw from the market.
Figure 3.3.1
Southampton Strategic Assessment: Homelessness Prevention Review: 2017/18
19
Bramley, G (2017) Homelessness projections: Core homelessness in Great Britain, Crisis and Heriot Watt
University, [Online] Available from:
https://www.crisis.org.uk/media/237582/crisis_homelessness_projections_2017.pdf [Accessed 12 March
2018]
20
Shelter What causes homelessness?, [Online] Available from:
http://england.shelter.org.uk/campaigns_/why_we_campaign/tackling_homelessness/What_causes_homeles
sness [Accessed 24 January 2018].
Intelligence & Strategic Analysis Team
Southampton City Council, 1st Floor, Municipal Block – West,
Tel: 02380 832493 17
E-mail: strategy.unit@southampton.gov.uk
Civic Centre, Southampton, SO14 7LT
Website: www.publichealth.southampton.gov.uk/Health Intelligence/Intelligence Southampton Strategic Assessment:
& Strategic Homelessness Prevention Review
Analysis 2017/18
Figure 3.3.1 shows that the proportion of acceptances due to the end of an AST was at its highest
during 2016/17; the numbers in Figure 3.3.2 shows end of AST increasing to 106 acceptances in
2016/17 from 43 in 2015/16 (almost a 150% increase) over the period, and accounting for half of the
acceptances in 2016/17. Figure 3.3.2 also shows that the number of parents/friends not willing is at
the highest during the time period 2008/09 to 2016/17, emphasising earlier information about
younger people who are homeless. The units of private accommodation SCC have access to through
private landlords has been decreasing since 2012/13, with 129 units available that year and only 21
available in 2017/18. This decrease may be due to landlords not willing to let to people on Universal
Credit, and the changes in tax which means the amount of income tax relief landlords can get on
residential property finance costs will be restricted to the basic rate of tax21. Both of these may have
resulted in a decrease in the number of properties available, making preventions harder and
increasing the levels of statutory homeless.
Figure 3.3.2: Reasons for homelessness, those who are homeless and in priority need - Southampton:
2008/09 to 2016/17
2008/09
2009/10
2010/11
2011/12
2012/13
2013/14
2014/15
2015/16
2016/17
Reasons for homelessness
Non-violent end relationship 8 * * 5 7 7 10 10 15
Violent End Relationship 31 * * 21 20 29 24 17 24
Parents/friends no longer willing 60 54 52 59 52 56 53 50 66
Southampton Strategic Assessment: Homelessness Prevention Review: 2017/18
End of Assured Shorthold Tenancy 19 43 51 53 72 58 68 43 106
*Numbers have been suppressed to protect confidentiality.
3.3.2 Child poverty
The report by Crisis suggests that the most important driver of homelessness in all its forms is poverty.
The Centre for Research in Social Policy (CRSP) creates annual child poverty estimates. These modelled
estimates define poverty using the HMRC data of children on out-of-work benefits and children in
families on tax credits who’s reported family incomes are below 60 per cent of the median; it is a
measure of relative poverty compared to others. Figure 3.3.3 shows that in 2017 Southampton had a
higher percentage of children living in poverty (30.3%) than the England average (27.3%). Figure 3.3.4
shows these figures at ward level for Southampton, with the highest rates being recorded in Bevois
(47.6%) and Bargate (43.7%) wards.
21
GOV.UK (2016) Changes to tax relief for residential landlords [Online] Available from:
https://www.gov.uk/government/news/changes-to-tax-relief-for-residential-landlords [Accessed 14 March
2018].
Intelligence & Strategic Analysis Team
Southampton City Council, 1st Floor, Municipal Block – West,
Tel: 02380 832493 18
E-mail: strategy.unit@southampton.gov.uk
Civic Centre, Southampton, SO14 7LT
Website: www.publichealth.southampton.gov.uk/Health Intelligence/Intelligence Southampton Strategic Assessment:
& Strategic Homelessness Prevention Review
Analysis 2017/18
Figure 3.3.3
Figure 3.3.4
Southampton Strategic Assessment: Homelessness Prevention Review: 2017/18
Intelligence & Strategic Analysis Team
Southampton City Council, 1st Floor, Municipal Block – West,
Tel: 02380 832493 19
E-mail: strategy.unit@southampton.gov.uk
Civic Centre, Southampton, SO14 7LT
Website: www.publichealth.southampton.gov.uk/Health Intelligence/Intelligence Southampton Strategic Assessment:
& Strategic Homelessness Prevention Review
Analysis 2017/18
3.3.3 Income
The main indicators of poverty are based around income22. Figure 3.3.5 looks at income deprivation
for Southampton based on the Index of Multiple Deprivation, an indicator which is based on people
on low incomes who are in receipts of benefits and tax credits23. The map shows that within
Southampton there are some neighbourhoods which are amongst the most income deprived areas in
the country. The area with the highest percentage of children affected by income deprivation is in the
ward of Millbrook, although the area in question is surrounded by less deprived areas, which may
explain why the ward appears lower than the Southampton average in Figure 3.3.4. Bitterne ward
contains 3 of the 5 areas with the highest percentages of income deprivation affecting children;
Bitterne also has the third highest rate of children living in poverty. People in these areas therefore,
may be at increased risk of homelessness.
Figure 3.3.5
Southampton Strategic Assessment: Homelessness Prevention Review: 2017/18
22
Feargal McGuinness (2018) Poverty in the UK: statistics, House of Commons Library, Briefing Paper Number
7069. [Online] Available from: http://researchbriefings.files.parliament.uk/documents/SN07096/SN07096.pdf
[Accessed 12 March 2018].
23
Department for Communities and Local Government, The English Index of Multiple Deprivation (IMD) 2015 –
Guidance [Online] Available from:
https://www.gov.uk/government/uploads/system/uploads/attachment_data/file/464430/English_Index_of_
Multiple_Deprivation_2015_-_Guidance.pdf [Accessed 12 March 2018].
Intelligence & Strategic Analysis Team
Southampton City Council, 1st Floor, Municipal Block – West,
Tel: 02380 832493 20
E-mail: strategy.unit@southampton.gov.uk
Civic Centre, Southampton, SO14 7LT
Website: www.publichealth.southampton.gov.uk/Health Intelligence/Intelligence Southampton Strategic Assessment:
& Strategic Homelessness Prevention Review
Analysis 2017/18
Figure 3.3.6
Southampton Strategic Assessment: Homelessness Prevention Review: 2017/18
Figure 3.3.6 shows how Southampton compares to statistical neighbours for resident weekly earnings.
The gross weekly pay for residents of Southampton is £521, which is lower than the England average
(£556) and significantly lower than the Hampshire average (£604). Southampton ranks roughly
midway amongst comparator areas. Resident earnings have increased in line with England, although
there have been smaller increases for the 10% lowest earners in the city, potentially widening the
inequality gap in the city. Since 2013, weekly pay in ‘real’ terms increased for residents in
Southampton. However, adjusted for inflation, earnings are not yet back to their peak in 2008. For
further information see SCC’s Economic Assessment24.
3.3.4 Household income
Gross disposable household income (GDHI) is the amount of money that all of the individuals in the
household sector have available for spending or saving after they have paid direct and indirect taxes
and received any direct benefits. GDHI is a concept that is seen to reflect the “material welfare” of the
household sector.
24
Southampton City Council (2017) Southampton Economic Assessment [Online] Available from:
http://www.publichealth.southampton.gov.uk/healthintelligence/jsna/economy.aspx [Accessed 11 June
2018].
Intelligence & Strategic Analysis Team
Southampton City Council, 1st Floor, Municipal Block – West,
Tel: 02380 832493 21
E-mail: strategy.unit@southampton.gov.uk
Civic Centre, Southampton, SO14 7LT
Website: www.publichealth.southampton.gov.uk/Health Intelligence/Intelligence Southampton Strategic Assessment:
& Strategic Homelessness Prevention Review
Analysis 2017/18
Figure 3.3.7
Gross disposable household income, per head are current base
prices: Southampton and ONS Comparators 2016 (provisional)
ONS comparators Local neighbours
Isle of Wight £16,781
Hampshire £22,574
Coventry £14,175
Liverpool £14,538
Southampton £14,797
Sheffield £15,057
Portsmouth £15,066
Plymouth £15,147
Newcastle upon Tyne £16,180
Leeds £16,814
Bristol £17,633
York £18,070
Bournemouth £19,448
England £19,878
Bath and North East Somerset £21,955
£0 £5,000 £10,000 £15,000 £20,000 £25,000
Income
Source: Office for National Statistics
Southampton Strategic Assessment: Homelessness Prevention Review: 2017/18
Figure 3.3.7 illustrates how the GDHI per head for 2016 for Southampton is £14,797, which is
approximately £5,000 lower than the England average (£19,878) and over £7,000 less than Hampshire.
Southampton has the 3th lowest GDHI amongst comparators, and less than Portsmouth which has a
GDHI of £15,066. Trend analysis shows an increase of £5,170 for Southampton between 1997 and
2016 although there was a £225 decrease from 2015 to 20116. This is compared to and an increase of
£8,802 for England between 1997 and 2016 and a £119 increase from 2015 to 2016. This difference in
the growth of GDHI has meant the gap between Southampton and the national average has widened
over time. The small growth for Southampton when compared to England may be due to factors
including the cost of housing, smaller rises in wages than other comparators and the type of
employment available and/or local skills. One feature of the Southampton economy is that the higher
paid jobs in the city are often filled by people commuting into the city; whilst worker wages are
amongst the highest compared to statistical neighbours, resident earnings are amongst the lowest.
3.3.5 Unemployment
Unemployment is another potential structural cause of unemployment closely linked to income.
Figure 3.3.8 illustrates how the unemployment rate in Southampton has fallen in recent years from
7.9% in 2014 to 5.0% in 2017, a fall of 2.9% points over three years. Over the same period the England
rate fell by 2.4% points and the South East by 1.6% points. This follows a period of fairly high
unemployment (between 2010 and 2014) following the recession, which mirrors the national trend.
Throughout the majority of the period, Southampton has had an unemployment rate similar to
Intelligence & Strategic Analysis Team
Southampton City Council, 1st Floor, Municipal Block – West,
Tel: 02380 832493 22
E-mail: strategy.unit@southampton.gov.uk
Civic Centre, Southampton, SO14 7LT
Website: www.publichealth.southampton.gov.uk/Health Intelligence/Intelligence Southampton Strategic Assessment:
& Strategic Homelessness Prevention Review
Analysis 2017/18
England, although the South East rate has been consistently lower. Although unemployment has
fallen, the jobs people are in are not necessarily full time stable employment as after the recession
there was a clear shift towards part-time work.
Figure 3.3.8
Southampton Strategic Assessment: Homelessness Prevention Review: 2017/18
3.3.6 Availability and affordability of housing
The availability and affordability of different forms of potentially accessible housing, whether social
rented lettings or suitable forms of temporary accommodation were also identified by Crisis as being
important in driving trends in future levels of core homelessness.
The housing affordability ratio shows how affordable properties are, it is a ratio of the lower quartile
house price to lower quartile earnings; the higher the ratio the less affordable properties are. The ratio
takes no account of interest rates and mortgage repayments and so has only limited applicability as a
measure of affordability. Figure 3.3.9 shows that Southampton is less affordable than England as a
whole and is in the top 5 least affordable areas among its ONS comparators. Figure 3.3.10 illustrates
how the housing affordability ratio has been consistently higher (less affordable) than England over
time, with the gap widening since 2014.
Intelligence & Strategic Analysis Team
Southampton City Council, 1st Floor, Municipal Block – West,
Tel: 02380 832493 23
E-mail: strategy.unit@southampton.gov.uk
Civic Centre, Southampton, SO14 7LT
Website: www.publichealth.southampton.gov.uk/Health Intelligence/You can also read