Regional Haze Four-Factor Analysis - Colstrip Energy Limited Partnership Rosebud Power Plant - Montana DEQ
←
→
Page content transcription
If your browser does not render page correctly, please read the page content below
Regional Haze
 Four-Factor Analysis

Colstrip Energy Limited Partnership
 Rosebud Power Plant
 Colstrip, Montana

 September 2019

 Prepared by:
 Bison Engineering, Inc.
 1400 11th Avenue
 Helena, MT 59601
EXECUTIVE SUMMARY

Bison Engineering, Inc. (Bison) was retained by Colstrip Energy Limited Partnership
(CELP) to prepare a four-factor analysis for the Circulating Fluidized Bed Combustion
(CFBC) Boiler located at the Rosebud Power Plant in Colstrip, Montana. The CELP facility
is operated by Rosebud Energy Corporation (REC). The facility may be referenced by
either name throughout this report. The four-factor analysis was requested by the
Montana Department of Environmental Quality (MDEQ) in an email (and follow-up
discussions) among CELP owners and staff and Craig Henrikson (MDEQ) that began on
March 14, 2019.

The analysis itself relates to the second planning period (Round 2) of development of a
State Implementation Plan (SIP) to address regional haze. Regional haze requirements
and goals are found in Section 169A of the Federal Clean Air Act and codified in 40 CFR
51.308. The purpose of the four-factor analysis is to determine if there are emission
control options at CELP that, if implemented, could be used to attain reasonable progress
toward the state’s visibility goals.

The four-factor analysis was conducted primarily for sulfur dioxide (SO2) and oxides of
nitrogen (NOx) on the CFBC Boiler at CELP. The results of the analysis have indicated
that additional controls on the CFBC Boiler are not necessary to make reasonable
progress due to costs and CELP’s lack of a measurable impact on any nearby Class I
area. It is also concluded that this facility does not qualify for additional emission controls
or limitations based on the four-factor analysis. In addition, significant emission reductions
that dwarf the CELP facility’s emissions will take place during this planning period from
the closure of Talen Energy Colstrip Units 1 and 2 later in 2019. Those emission
reductions would be in very close proximity to CELP and would appear to exceed
reasonable progress visibility goals for this second planning period.

Colstrip Energy Limited Partnership
Four-Factor Analysis
Project #: ROS219002 Page i

TABLE OF CONTENTS

EXECUTIVE SUMMARY ................................................................................................. i

1.0 ACRONYMS......................................................................................................... 1

2.0 INTRODUCTION .................................................................................................. 2

3.0 PROGRAM SUMMARY AND STATUS ............................................................... 6
 3.1 Montana Initiatives ........................................................................................................ 6
 3.2 Federal Initiatives .......................................................................................................... 7
 3.3 Overall Applicability ....................................................................................................... 8

4.0 REASONABLE PROGRESS PERSPECTIVE ................................................... 10
 4.1 National Emissions ...................................................................................................... 10
 4.2 Montana Emissions ..................................................................................................... 11
 4.4 CELP Emissions and Perspectives ............................................................................. 12
 4.5 Emissions vs. Visibility Impairment Analysis ............................................................... 14
 4.5.1 UL Bend National Wildlife Refuge Visibility vs Emissions ................................................ 15
 4.5.2 Theodore Roosevelt National Park Visibility vs. Emissions .............................................. 16
 4.5.3 North Absaroka Visibility vs. Emissions ............................................................................ 17
 4.5.4 Yellowstone National Park Visibility vs. Emissions ........................................................... 18
 4.5.5 Gates of the Mountains Wilderness Area Visibility vs. Emissions .................................... 19

5.0 FOUR-FACTOR ANALYSIS .............................................................................. 21
 5.1 SO2 Control Measures ................................................................................................ 21
 5.1.1 SO2 Control Technologies Considered ................................................................................. 22
 5.1.2 Eliminating Technically Infeasible Options ............................................................................ 24
 5.1.3 Identify Technically Feasible Options .................................................................................... 25
 5.2 NOx Control Measures ................................................................................................ 26
 5.2.1 NOx Control Technologies Considered ................................................................................. 26
 5.2.2 Eliminating Technically Infeasible Options ............................................................................ 28
 5.2.3 Identify Technically Feasible Options .................................................................................... 29
 5.2.3.1 SCR ................................................................................................................................... 29
 5.2.3.2 SNCR ................................................................................................................................ 30
 5.3 Factor 1 – Cost of Compliance .................................................................................... 31
 5.3.1 SO2 Cost Effectiveness ......................................................................................................... 32
 5.3.2 NO2 Cost-Effectiveness ......................................................................................................... 33
 5.4 Factor 2 – Time Necessary for Compliance ............................................................... 34
 5.4.1 Installation of SO2 Controls ................................................................................................... 35
 5.4.2 Installation of NOx Controls................................................................................................... 35
 5.5 Factor 3 – Energy and Non-air Environmental Impacts .............................................. 35
 5.5.1 Energy Impacts: SO2 Controls ............................................................................................. 35
 5.5.2 Energy Impacts: NOx Controls ............................................................................................. 35
Colstrip Energy Limited Partnership
Four-Factor Analysis
Project #: ROS219002 Page ii
5.5.3 Non-Air Quality Impacts: SO2 controls .................................................................................. 35
 5.5.4 Non-Air Quality Impacts: NOx Controls ................................................................................ 36
 5.6 Factor 4 – Remaining Useful Life of Source............................................................... 36

6.0 CONCLUSIONS ................................................................................................. 37

7.0 REFERENCES ................................................................................................... 40

LIST OF TABLES AND FIGURES
Figure 1: Topographic Map of CELP in Relation to Nearest Class I Area
Figure 2: Google Earth Representation of CELP Facility
Figure 3: National Emission Trends of SO2 and NOx
Figure 4: Historical SO2 and NOx Emissions
Figure 5: Montana Industrial SO2 and NOx Emissions
Figure 6: CELP SO2 and NOx Emissions from 2000 to 2064
Figure 7: CELP SO2 and NOx Emissions from 2000 to 2018 Compared with the UL Bend
National Wildlife Refuge Visibility Glidepath Through 2028
Figure 8: CELP SO2 and NOx Emissions from 2000 to 2018 Compared with Theodore
Roosevelt National Park Visibility Glidepath Through 2028
Figure 9: CELP SO2 and NOx Emissions from 2000 to 2018 Compared with the North
Absaroka Wilderness Area Visibility Glidepath Through 2028
Figure 10: CELP SO2 and NOx Emissions from 2000 to 2018 Compared with the
Yellowstone National Park Visibility Glidepath Through 2028
Figure 11: CELP SO2 and NOx Emissions from 2000 to 2018 Compared with Gates of the
Mountains Wilderness Area Visibility Glidepath Through 2028

Table 1: Nearby Class I Areas and Proximity
Table 2: Estimated Costs of SO2 Control Options for CELP
Table 3: Estimated Costs of NO2 Control Options for CELP

LIST OF APPENDICES
APPENDIX A: CORRELATION ANALYSIS
APPENDIX B: COST ANALYSIS

Colstrip Energy Limited Partnership
Four-Factor Analysis
Project #: ROS219002 Page iii
1.0 ACRONYMS
BACT Best Available Control Technology
BART Best Available Retrofit Technology
Bison Bison Engineering, Inc.
CELP Colstrip Energy Limited Partnership
CFBC Circulating Fluidized Bed Combustion
CO Carbon Monoxide
Control Cost Manual EPA Air Pollution Control Cost Manual
EGU Electric Generating Unit
EPA Environmental Protection Agency
ESP Electrostatic Precipitator
FGD Flue gas Desulfurization
FGR Flue Gas Recirculation
FIP Federal Implementation Plan
ID Fan Induced Draught Fan
Lb/MMBtu Pounds per Million British Thermal Units
MDEQ Montana Department of Environmental Quality
NAAQS National Ambient Air Quality Standards
NACAA National Association of Clean Air Agencies
NH3 Ammonia
NOx Oxides of Nitrogen
O2 Oxygen
O&M Operations and Maintenance
ppmv parts per million by volume
r Pearson Correlation Coefficient
r2 the square of the correlation coefficient r
RFG Refinery Fuel Gas
RHR Regional Haze Rule
Round 1 First planning period of the Regional Haze Program
Round 2 Second (current) planning period of the Regional Haze Program
SCR Selective Catalytic Reduction
SIP State Implementation Plan
SNCR Selective Non-Catalytic Reduction
SO2 Sulfur Dioxide
TSD 2008 EGU NOx Mitigation Strategies Proposed Rule Technical
 Support Document
ULNB Ultra-Low NOx Burners

Colstrip Energy Limited Partnership
Four-Factor Analysis
Project #: ROS219002 Page 1
2.0 INTRODUCTION

As part of the 1977 amendments to the Federal Clean Air Act (42 USC 7401 et seq.)
Congress declared as a national goal “… the prevention of any future, and the remedying
of any existing, impairment of visibility in mandatory class I Federal areas which
impairment results from manmade air pollution.” [42 USC 7491(a)(1)]. With that goal, plans
and requirements were eventually codified in the Code of Federal Regulations primarily in
40 CFR 51.308. (The entire visibility program is found in 40 CFR 51.300 to 309.) These
requirements state individual states are required to establish “reasonable progress goals”
in order to “attain natural visibility conditions” by the year 2064 [40 CFR 51.308(d)(1)].

The Environmental Protection Agency (EPA), via a Federal Implementation Plan (FIP)
promulgated the first round of those obligations with the establishment of Best Available
Retrofit Technologies (BART) and a four-factor analysis for various sources in Montana. 1
Additional controls for CELP were considered by EPA during that first round, but no
additional controls were determined to be appropriate given the size of the facility, the cost
of compliance, and minimal visibility impacts, based on overall emissions and distance to
Class I areas. Therefore, the FIP did not propose nor promulgate any additional controls
for this facility.

A second round of obligations is now under development, with MDEQ moving into the role
as the lead agency. This second round, or planning period as it is sometimes called,
requires an additional step toward reasonable progress in meeting the national goal of
attaining natural visibility conditions in mandatory Class I areas by 2064. The Regional
Haze Rule (RHR) as outlined in 40 CFR 51.308 et seq. identifies four factors which should
be considered in evaluating potential emission control measures to make reasonable
progress toward the visibility goal. These four factors are collectively known as the four-
factor analysis and are as follows:

 Factor 1. Cost of compliance
 Factor 2. Time necessary for compliance
 Factor 3. Energy and non-air quality environmental impacts of compliance
 Factor 4. Remaining useful life of any existing source subject to such requirements

To implement the four-factor requirement, Craig Henrikson of MDEQ contacted CELP in
March of 2019. MDEQ noted this same analysis is required for other sources in the Colstrip
area, namely Talen Montana, LLC’s Colstrip Steam Electric Station. MDEQ followed up
with an April 19, 2019, letter to further clarify various aspects of the requested analysis
along with providing EPA guidelines on the matter. In a May 23, 2019, email, MDEQ
requested a “representative baseline” emissions period on which to base regional
modeling as a part of the Round 2 efforts. CELP chose the 2014-2016 annual emission
year period as that representative baseline due to extended downtime during 2017. Those
2014-2016 annual emissions years are also used as a basis for this four-factor analysis.

1
 The FIP was promulgated on Sept. 18, 2012, at 77 FR 57864.
Colstrip Energy Limited Partnership
Four-Factor Analysis
Project #: ROS219002 Page 2
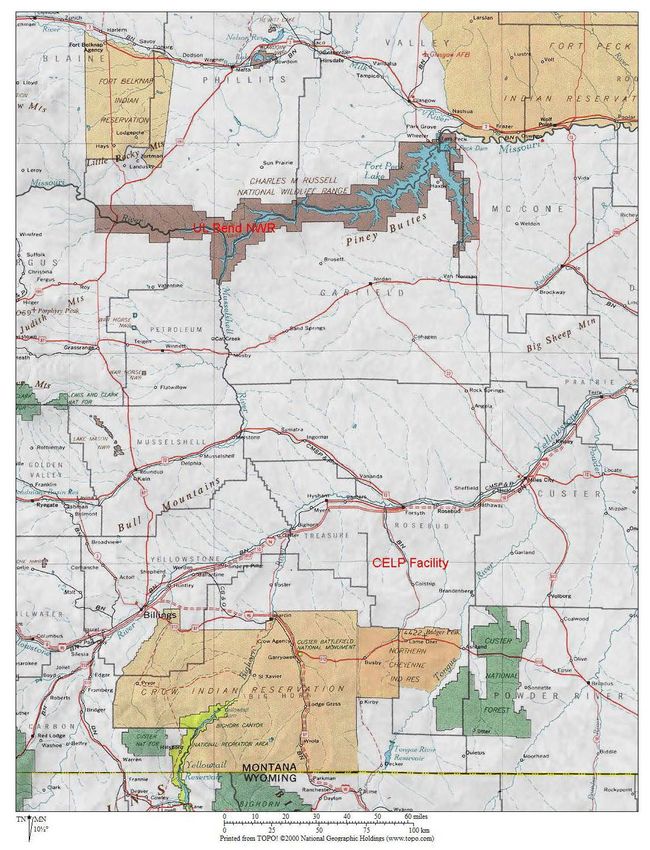
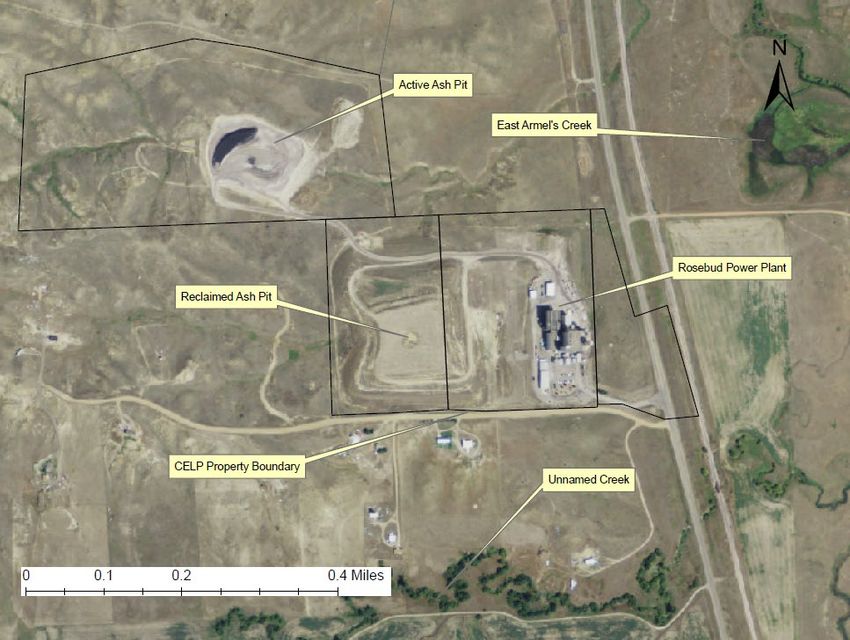
The Rosebud Power Plant is an electric generating facility designed to burn low-British
thermal unit (Btu) waste coal from mining operations east of Billings, Montana. The facility
uses a CFBC boiler that is designed to efficiently utilize low-Btu coal while also allowing a
high recovery of fuel sulfur through the injection of limestone into the fluidized bed. The
total design capacity of the facility is approximately 38-Megawatts of electrical generation
(net).

CELP encompasses approximately 125 acres and is located approximately 6 miles north
of Colstrip, Montana. The legal description of the site location is the N½ of Section 32,
Township 3 North, Range 41 East, in Rosebud County, Montana. The site elevation is
3,110 feet above mean sea level.

A USGS topographic map is included as Figure 1 showing the site location. Figure 1 also
shows the boundary of UL Bend National Wildlife Refuge, which is the nearest Class I
area to CELP. Figure 2 is a printout of a Google Earth satellite photo of the area
surrounding the facility, with the site location indicated.

Colstrip Energy Limited Partnership
Four-Factor Analysis
Project #: ROS219002 Page 3
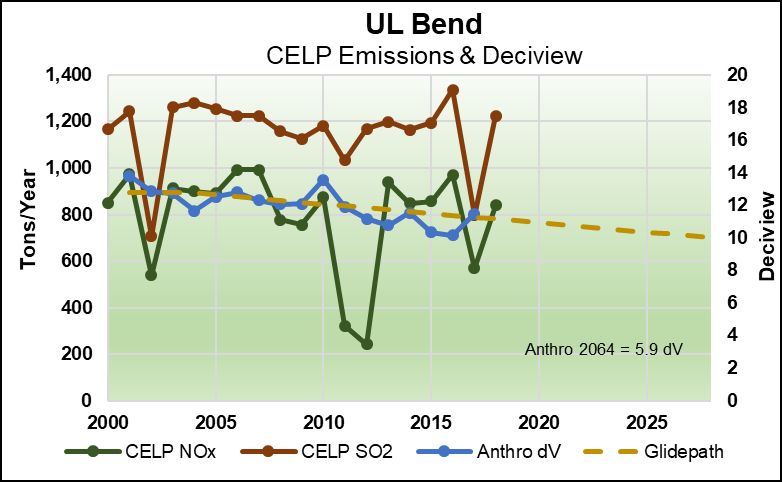
Figure 1: Topographic Map of CELP in Relation to Nearest Class I Area

Colstrip Energy Limited Partnership
Four-Factor Analysis
Project #: ROS219002 Page 4
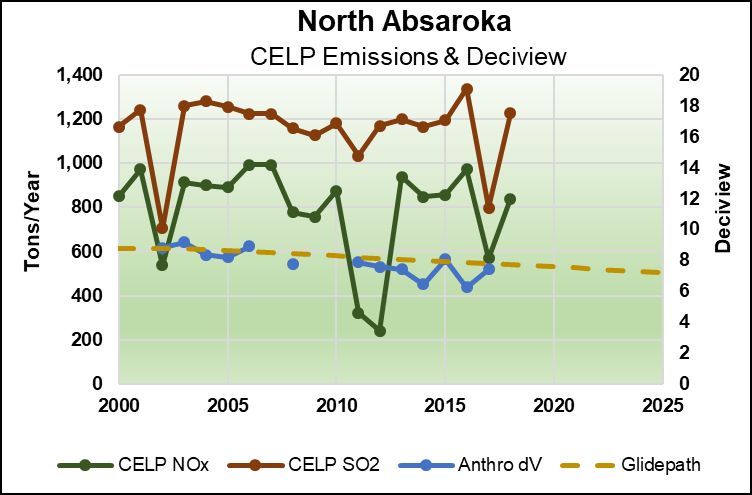
Figure 2: Google Earth Representation of CELP Facility

Colstrip Energy Limited Partnership
Four-Factor Analysis
Project #: ROS219002 Page 5
3.0 PROGRAM SUMMARY AND STATUS

As previously stated, the Regional Haze program is an attempt to attain ‘natural’
(nonanthropogenic) visibility conditions in all mandatory Class I areas 2 by 2064. The
Regional Haze Rule (RHR) itself was promulgated in substantially its current form in 1999
with adjustments made in 2017. 3 The rule has been implemented in incremental steps.
The first step, sometimes referred to as the 1st planning period (Round 1), was a
combination of BART and a four-factor analysis. During this initial planning period BART
applied to certain older facilities 4 and the four-factor program applied to ‘larger’ facilities
who had a potential of impacting (visibility) in a mandatory Class I area. CELP was
reviewed with respect to the four-factor analysis under Round 1, but no additional controls
were applied or required at that time.

3.1 Montana Initiatives

For Montana, the 1st planning period (Round 1) requirements were executed via the EPA.
This planning period roughly included the period of 2006 to 2018. In July 2006, Montana
determined that it no longer had the resources to complete the requirements of the
program and returned the program to EPA. 5 Following much discussion and analyses,
EPA six years later promulgated an FIP as it applied to sources in Montana. 6 As previously
discussed, the FIP did not impose new or additional controls on CELP for the Round 1
planning period.

Given that the timeframe for Round 1 has expired, the RHR now requires the
implementation of Round 2. Round 2 is meant to show an incremental progress toward
the national goal for the 10-year period 2018 to 2028. Additional 10-year implementation
periods will follow until the national goal is achieved [40 CFR 51.308(f)].

Recently MDEQ elected to bring the program back to state control. With that decision,
MDEQ is taking the lead in the development of the four-factor analysis and plans
associated with the second planning period. As is stands, MDEQ is attempting, by July
2021, to submit a SIP to EPA with the enforceable reductions (emission limits or plans that
will go into effect prior to 2028).

To implement the program fully, it was first necessary to measure regional haze (visibility
and its constituents) data in the various Class I areas. This has been an ongoing effort via
various ambient monitoring programs. Among them is the Interagency Monitoring of
Protected Visual Environments (IMPROVE) program [1]. This visibility monitoring program

2
 A mandatory Class I area is usually a national park or wilderness area above a certain threshold size (4,000
or 5,000 acres) and in existence on or before August 7, 1977. Montana has 12 (of 156) such areas.
3
 64 FR 35765; July 1, 1999; and 82 FR 3124; Jan. 10, 2017.
4
 The BART program is more fully explained in 40 CFR 51.308(e).
5
 Letter from DEQ to EPA dated July 19, 2006.
6
 The proposed FIP was published April 20, 2012 at 77 FR 23988 and became final on Sept. 18, 2012 at 77
FR 57864.
Colstrip Energy Limited Partnership
Four-Factor Analysis
Project #: ROS219002 Page 6
began in 1988 and continues to be a cooperative effort between EPA and various federal
land managers (primarily the National Park Service and the US Forest Service). The
results of that monitoring have indicated, for eastern Montana and Wyoming Class I areas,
that the primary pollutant that accounts for the most anthropogenic (human-caused)
regional haze degradation are (ammonium) sulfate and (ammonium) nitrate [2,3].

For Round 2, MDEQ has elected to look for reductions in SO2 and NOx (precursors to
ammonium sulfate and ammonium nitrate) emissions. The sources chosen for the analysis
are those facilities whose emissions-to-distance (from the Class I area) ratio exceeds a
particular value as noted below:

 If Q/d > 4, then the facility is chosen for a four-factor analysis
 Q = mean annual emissions from 2014 to 2017 of SO2 + NOx (tons)
 d = distance to the nearest mandatory Class I area (kilometers)

A value greater than 4 was calculated for CELP for the given time period (10.26
specifically, based on the 2014-2017 annual emission inventory period) and was chosen
by MDEQ for a four-factor analysis for Round 2.

3.2 Federal Initiatives

Because this request for information arises from the RHR, it is important to understand the
nature and purpose of the visibility protection program to ascertain important criteria that
will lead to the selection of specific reasonable progress requirements.

A visibility program aimed at attaining national visibility goals in mandatory Class I areas
was authorized in Section 169A of the Clean Air Act (42 USC 7491). The national goals
are to be attained by the year 2064, approximately 45 years from now. The rules which
are to implement this goal of protecting visibility are found at 40 CFR 51, Subpart P
(subsections 300 through 309). A review of Subpart P indicates the purpose and goals of
the program. The purposes of the program are outlined as follows:

 “The primary purposes of this subpart are . . .to assure reasonable
 progress toward meeting the national goal of preventing any future, and
 remedying any existing, impairment of visibility in mandatory Class I
 Federal areas which impairment results from manmade air pollution. . .”
 [40 CFR 51.300(a)].

The visibility program may be thought of as the implementation of two sub-programs. One
regards new source review (NSR, PSD, etc.) and the other addresses regional haze.
Regional haze may further be broken down into the BART program and the reasonable
progress program. The underlying reason stated for MDEQ’s March 13, 2019, letter and

Colstrip Energy Limited Partnership
Four-Factor Analysis
Project #: ROS219002 Page 7
other correspondence to CELP relates to reasonable progress achieved through the four-
factor analysis.

In that regard, the RHR outlines what it refers to as: “the core requirements” for the
implementation of the regional haze goals. More specifically, 40 CFR 51.308(d)(1) states:

 “For each mandatory Class I Federal area . . ., the State must establish
 goals . . . that provide for reasonable progress towards achieving natural
 visibility conditions. The reasonable progress goals must provide for an
 improvement in visibility for the most impaired days...”

The rules go on to provide the states with a list of what must be considered in developing
reasonable progress. Among these details are the four-factors analysis that is outlined
above in Section 2.0 and in the March 13, 2019, letter.

3.3 Overall Applicability

Montana is tasked to establish (a plan for) reasonable progress in carrying out the visibility
protection. Section 3.2 outlines the purpose of the program along with core elements. To
that end, MDEQ seeks a “detailed review of additional process controls” which is assumed
to be evaluated by both Montana and EPA for applicability in establishing a set of specific,
reasonable Montana control strategies that create “Reasonable Progress” toward the 2064
goals.

The purpose of the program is to protect visibility by remedying, reducing, and preventing
man-made impairments (or activities) over time in mandatory Class I areas. Reasonable
progress expresses the notion that states must have implementation plans to approach
the national goal by 2064 along a ‘glide-path’ of improvements to visibility, with certain
exceptions. Based on the language contained in 40 CFR 51.300(d)(1), it can be
ascertained that any activity, remedy or control (proposed or otherwise) that does not
reasonably “improve visibility” in a mandatory Class I area is not a rational candidate for
those “reasonable progress” goals [4]. That sentiment is confirmed in Section II.A EPA
August 20, 2019, guidance [5]:

 “The CAA and the Regional Haze Rule provide a process for states to follow
 to determine what is necessary to make reasonable progress in Class I
 areas. As a general matter, this process involves a state evaluating what
 emission control measures for its own sources, groups of sources, and/or
 source sectors are necessary in light of the four statutory factors, five
 additional considerations specified in the Regional Haze Rule, and possibly
 other considerations (e.g., visibility benefits of potential control measures,
 etc.). States have discretion to balance these factors and considerations in
 determining what control measures are necessary to make reasonable
 progress.”

Colstrip Energy Limited Partnership
Four-Factor Analysis
Project #: ROS219002 Page 8
As a result, an analysis that only considers one or more emission control options is not
enough for inclusion in reasonable progress mandates unless those emission controls are
expected to improve actual visibility in a Class I area in a discernible manner. It is neither
necessary nor appropriate to include an emission control as part of a reasonable progress
goal or plan without a reasonable expectation of a resulting improvement in regional haze
as a direct result of the application of the control (i.e., a discernible improvement in
deciviews 7 in a Class I area.

To that end, CELP has elected to not only analyze various control “options” utilizing four-
factors, but has also included a qualitative analysis of impacts this facility may have on
several nearby mandatory Class I areas. 8 This was accomplished to determine if either
the current configuration or future control options would fulfill the underlying need of the
program to “provide for an improvement in visibility” per 40 CFR 51.308(d)(1) at a
mandatory Class I area [6].

As will be presented in following sections of this document, no measured evidence of any
impact by CELP’s operations on the visibility in any mandatory Class I airshed was
established.

7
 The definition of a deciview is as follows: Deciview haze index=10 lne(bext/10 Mm-1). This is taken from the
definitions found in 40 CFR 51.301. There are, of course, numerous articles and explanations for the
deciview metric. One article may be found in the publication “IMPROVE,” Volume 2, No. 1, April 1993 which
was written by Pitchford and Malm, 1993. From a non-mathematical point of view, the change in deciview of
“1” is intended to represent a “just noticeable change” (or sometimes referred to as ‘just discernible’) in
visibility regardless of the baseline visibility.
8
 The nearest Class I area (UL Bend National Wildlife Refuge) is about 190 kilometers from the CELP facility.
Colstrip Energy Limited Partnership
Four-Factor Analysis
Project #: ROS219002 Page 9
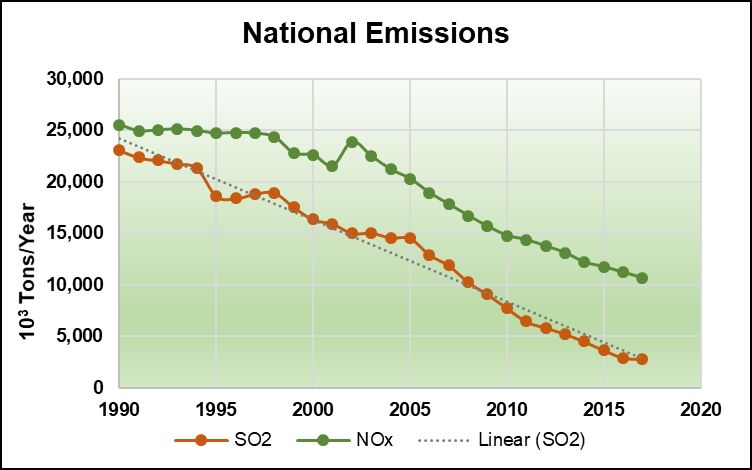
4.0 REASONABLE PROGRESS PERSPECTIVE

The first few sections of this report have provided a summary of the overall regional haze
program and the nature of Round 2 of implementation. It also outlined the program’s basic
elements and background. This section of the report describes the efforts already taken to
reduce emissions not only from the state, but in the Billings area in particular. This review
and discussion lead one to conclude that enough reductions have or are about to be
achieved which, by themselves constitute (more than) reasonable progress within the
meaning of the RHR [6].

4.1 National Emissions

A national downward trend of industrial emissions of sulfur dioxide and oxides of nitrogen
has been evidenced for many years. Figure 3 depicts the nation-wide emission rate of
these two compounds from 1990 through 2017.

 Figure 3: National Emission Trends of SO2 and NOx

The reductions observed over these years have occurred for many reasons mostly relating
to requirements in the Federal Clean Air Act, the Montana Clean Air Act and industrial
facility shutdowns.

While Figure 3 provides a historical perspective, it is also of interest to explore those
emissions recorded at the start of the RHR program (2000) as shown in Figure 4. This
graphic denotes SO2 emissions through 2064 since that is the year in which the national
goal is to be achieved.

Colstrip Energy Limited Partnership
Four-Factor Analysis
Project #: ROS219002 Page 10
Figure 4: Historical SO2 and NOx Emissions

From a national perspective, it appears that emissions of SO2 and NOx are on a fast-
downward trend. While emissions will not likely achieve “zero” by 2064, substantial
reductions have and will likely continue to occur. Regardless of the decisions to be reached
for Round 2, national emissions contributing to regional haze are anticipated to decline
with or without any observed visibility impairment.

4.2 Montana Emissions

As depicted in Figure 5, the Montana trend in lowering industrial emissions follows the
same general pattern as the national data. Except for a modest spike in NOx emissions
around year 2000, there has been a marked reduction in both NOx and SO2. It can be
inferred that Montana has been doing its part to reach the national goal. 9

9
 This statement presumes (without admission or proof) an a priori cause and effect between Montana
emissions and observed visibility in any nearby Mandatory Class I area. For reasons that will be forthcoming
in the September four-factor analysis, there is, in our opinion, no cause and effect relationship between
CELP’s NOx and SO2 emissions in particular and a measurable impact on visibility (expressed in deciviews).
Colstrip Energy Limited Partnership
Four-Factor Analysis
Project #: ROS219002 Page 11
Figure 5: Montana Industrial SO2 and NOx Emissions

Regardless of the decisions to be reached for Round 2, industrial emissions within the
state of Montana contributing to regional haze are anticipated to decline with or without
any observed visibility impairment. 10

In addition, significant emission reductions that dwarf the CELP facility’s emissions (by
almost a factor of 10) will take place during this planning period from the closure of Talen
Energy Colstrip Units 1 and 2 later in 2019. Those emission reductions would be in very
close proximity to CELP and would appear to exceed reasonable progress visibility goals
for this 2nd planning period.

4.4 CELP Emissions and Perspectives

As this request for information arises from the RHR it is important to understand the nature
and purpose of the visibility protection program to ascertain important criteria that will lead
to the selection of specific reasonable progress requirements.

As previously discussed, additional controls for CELP were considered by EPA during the
first planning period, but no additional controls were determined to be appropriate given
the size of the facility, the cost of compliance, and minimal visibility impacts, based on
overall emissions and distance to Class I areas. Therefore, the FIP did not propose nor
promulgate any additional controls for this facility.

10
 It is assumed for this particular discussion alone that a reduction in emissions (SO2 and/or NOx) has a
direct causal relationship with improved visibility. Analyses to follow will show that this is not the case. A
reduction in Montana emissions, CELP included, does not translate to an improvement in Class I visibility,
linear or otherwise.
Colstrip Energy Limited Partnership
Four-Factor Analysis
Project #: ROS219002 Page 12
In the broader perspective, Montana shows substantial and adequate reductions in SO2
and NOx emissions in the period since 2000 (and earlier although not shown in the figures
as a matter of convenience). These reductions have resulted from voluntary source
actions, implementation plans, plant closures, new plant constructions, and numerous
consent decrees. As previously mentioned, Montana’s emissions reductions as well as the
reductions anticipated from 2019 closure of Colstrip Units 1 and 2, are clear evidence that
emission reductions are anticipated to be ahead of any desired “uniform rate” of visibility
improvement or progress contemplated to date at any nearby Class I area [7]. 11 The
“uniform rate of progress” line is also referred to as the glidepath, which is the linear
representation of the visibility improvement needed to get from the baseline at a Class I
area to its “natural background” in 2064.

To be consistent with previous historical (and projected) emission summaries, the same
information is provided graphically below for the RHR program history.

 Figure 6: CELP SO2 and NOx Emissions from 2000 to 2064

Given the very efficient nature of the CFBC Boiler and the nature of CELP’s business in
generating electricity, the consistent operation and emission profile is to be expected.
Consistent operations, however, do not correlate to visibility impairment. Conversely, the
years of lower emissions at CELP also do not correlate to visibility improvement, as will be
shown graphically at each relevant Class I area.

11
 These uniform rates of progress for Montana’s Class I areas are taken in general terms from those
“glidepaths” shown in “State of Montana Regional Haze, 5-Year Progress Report,” MDEQ, August 2017,
Appendix C, Figures 9, 31, 42, 64, 53, 75, 86, 97 and 108.
Colstrip Energy Limited Partnership
Four-Factor Analysis
Project #: ROS219002 Page 13
4.5 Emissions vs. Visibility Impairment Analysis

The next step in the reasonable progress perspective is to analyze the current and
historical visibility measurements against emissions. A review of anthropogenic sources,
and to what extent these sources actually impact the Class I area of interest, was
completed to determine the anthropogenic impact on visibility. There are several methods
one may employ to determine if any emission reduction would lead to an improvement in
visibility at ‘nearby’ Class I areas. This analysis reviews the information in retrospect, and
also discusses how that data informs predictions of future visibility impacts.

In order to consider the results of a four-factor analysis as described by the RHR, there
must be first and foremost a reasonable probability of an actual improvement in visibility
impairment from CELP itself or combined with other nearby sources.

In addition to emissions data, there is concurrent visibility data at all the nearby Class I
areas. Visibility data from these areas was taken from the Western Regional Air
Partnership (WRAP)[8] and generated from the Interagency Monitoring for Protected
Visual Environments (IMPROVE)[1,2,9]. These areas and their closest proximity to CELP
are shown below.

 Table 1: Nearby Class I Areas and Proximity
 Approximate Distance
 Nearby Class I Area from CELP
 (kilometers)
 UL Bend National Wildlife Refuge 188
 Theodore Roosevelt National Park 250
 North Absaroka Wilderness Area 260
 Yellowstone National Park 280
 Gates of the Mountains Wilderness Area 410

Emissions data from CELP is provided for both the baseline period for the visibility program
(2000 to 2004) as well as Round 1 (2005 to 2018) with respect to those Class I areas. As
stated previously, Round 1 encompassed the analysis and implementation of BART along
with a four-factor analysis that took place concurrently.

It is possible to glean some insight as to whether the visibility data is responding to
changes in emissions during the same time period. If CELP has a measurable impact on
visual impairment at a Class I area, then the observed visibility (using deciviews as the
indicator) would follow the trend. Due to a myriad of statistical confounding variables,
meteorology among them, it would not be expected that this correlation between emissions
and visibility (deciviews) would be necessarily linear or strong. Nonetheless, if CELP has
a relatively consistent emissions profile during the monitoring period (2000 to present), it
is logical to assume that the deciview parameter would follow this trend.

Colstrip Energy Limited Partnership
Four-Factor Analysis
Project #: ROS219002 Page 14
The sections below provide such a comparison between emissions and various nearby
Class I areas, first graphically, then with respect to statistical correlation.

4.5.1 UL Bend National Wildlife Refuge Visibility vs Emissions

Another Class I area to consider is the UL Bend National Wildlife Refuge. This area is
located about 190 kilometers NNE of the CELP facility. A graphical review of the emissions
and visibility data over time is provided below.

 Figure 7: CELP SO2 and NOx Emissions from 2000 to 2018 Compared with the
 UL Bend National Wildlife Refuge Visibility Glidepath Through 2028

The analysis starts by a graphical review of the emissions and visibility data over time.
The figure compares visibility (Anthro dV refers to anthropogenic deciview impairment)
and the RHR glidepath at the UL Bend National Wildlife Refuge with CELP SO2 and NOx
data. The glidepath refers to the line of projected improvements from the starting point of
the RHR in 2000-2004 to “natural background” in 2064. Each Class I area has its own
glidepath, specific to its visibility degradation baseline.

The graphic seems to indicate that the glidepath and observed deciview data match
relatively closely. Thus, data to date shows that the area is meeting the uniform rate of
progress (glidepath) that RHR prescribes. The variation seen in CELP emissions (from
extended shutdown periods in 2017, for example) are not reflected in improved/lower
deciview values.

To complete the evaluation a correlation analysis is also presented in Appendix A.
Specifically, the Pearson Correlation Coefficient (r) was determined. The correlation
coefficient measures the linear correlation between two variables as shown in Appendix
Colstrip Energy Limited Partnership
Four-Factor Analysis
Project #: ROS219002 Page 15
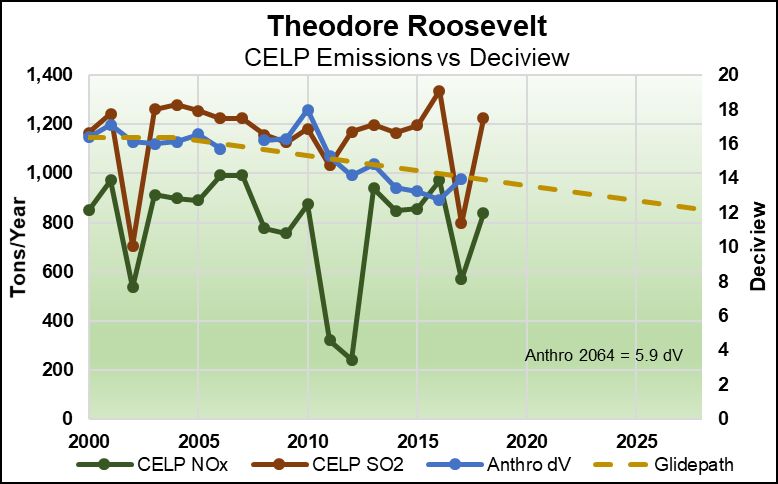
A, for example comparing CELP’s NOx and SO2 emissions with the glidepath (multiple
variables are compared). The value of “r” may vary from -1 to +1. A value of -1 indicates a
negative correlation (when one variable increases, the other variable decreases). A value
of zero indicates no correlation whatsoever and a value of +1 indicates a positive
correlation.
The other variable of interest is r2 (the square of the correlation coefficient r). This variable
is useful because it gives an indication of the strength of a correlation. In general, the r2
value is an indication of what percentage of the data fits the linear model of a correlation
between the two variables. For example, an r2 value of 0.50 would indicate that roughly
50% of the data fits the linear model well. Or, put another way, 50% of the data suggests
a good linear correlation and 50% of the data suggests no correlation.

In this instance, CELP NOx values had essentially no relation to Anthro dV (overall human-
caused visibility impairment) 12 and Anthro NO3 (the portion of anthropogenic visibility
impairment tied to NO3 compounds) at r values of 0.0.14 and 0.35, respectively.
Correspondingly, only 0.02 and 0.12 of the data (for Anthro dV and Anthro NO3) would fit
the linear model, based on the r2 value (confirmation of no correlation). The full Talen
Energy Colstrip Units 1-4 emissions were also evaluated to see how their emissions may
relate to Class I visibility. The Colstrip NOx values had an r value of 0.67 for the Anthro dV
and 0.92 to the glidepath (with 0.45 and 0.85 r2 values, respectively), indicating some
linear correlation between the Colstrip units and visibility/glidepath at UL Bend.

4.5.2 Theodore Roosevelt National Park Visibility vs. Emissions

Another Class I area of interest is the Theodore Roosevelt National Park. This Class I area
is approximately 250 kilometers from CELP and is unlikely to be impacted by CELP SO2
or NOx emissions. The visibility versus emissions information is presented in graphical
form below.

12
 The term anthropogenic deciview here is in reference to the definition of “Most impaired days” per 40 CFR
51.301.
Colstrip Energy Limited Partnership
Four-Factor Analysis
Project #: ROS219002 Page 16
Figure 8: CELP SO2 and NOx Emissions from 2000 to 2018 Compared with
 Theodore Roosevelt National Park Visibility Glidepath Through 2028

Although not specifically portrayed in the graphic, there is a notable trend in visibility
improvement in the past 10 years. This corresponds to the same 10-year period of
implementation of the 1st planning period. The emissions from CELP do not share this
same trend as CELP sees a more consistent emissions profile (and operation) over time.
No improvement in visibility was shown during CELP’s downtime.

No statistical correlation was observed with the visibility data and CELP’s emissions;
however, a fairly strong correlation is observed for Colstrip Units 1-4 SO2 data, Anthro dV
and Anthro SO4 (the portion of anthropogenic visibility impairment tied to SO4 compounds).
The statistical analysis is available in Appendix A.

4.5.3 North Absaroka Visibility vs. Emissions

An additional Class I area for consideration is the North Absaroka Wilderness Area. It is
roughly 260 kilometers from the facility to the border of the wilderness area. As with the
analyses that follow, the visibility/glidepath data used in this analysis were taken from the
WRAP Technical Support System [1,2].

Colstrip Energy Limited Partnership
Four-Factor Analysis
Project #: ROS219002 Page 17
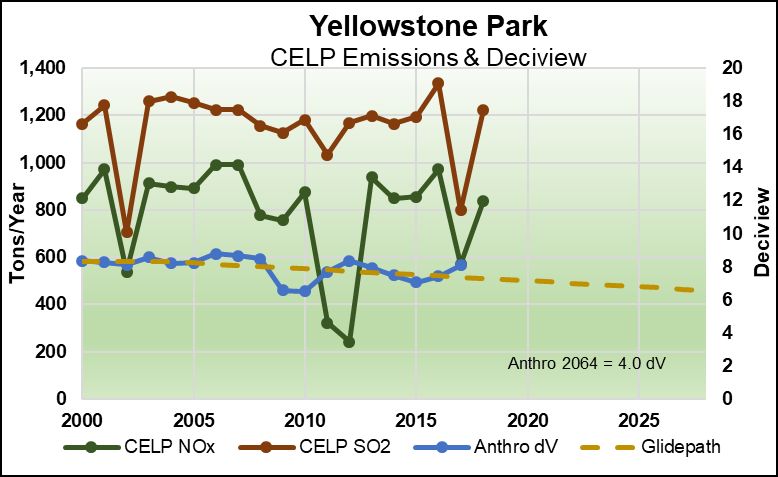
Figure 9: CELP SO2 and NOx Emissions from 2000 to 2018 Compared with the North
 Absaroka Wilderness Area Visibility Glidepath Through 2028

The most important observation to be gleaned from this chart is that the observed deciview
data indicates that this Class I area is already exceeding the uniform rate or progress
requirement on its glidepath. If there is no change in emissions from all SO2 and NOx
sources and all other parameters remain the same, the North Absaroka area will have
achieved the glidepath at the end of 2028 without any reductions required during Round
2.

Similar to Theodore Roosevelt National Park above, no statistical correlation was
observed with the visibility data and CELP’s emissions, however, a relatively strong
correlation is observed for Colstrip Units 1-4 SO2 data, the glidepath, and Anthro SO4 (the
portion of anthropogenic visibility impairment tied to SO4 compounds). The statistical
analysis is available in Appendix A.

4.5.4 Yellowstone National Park Visibility vs. Emissions

Yellowstone National Park is the next Class I area for consideration. It is roughly 280
kilometers from the facility to the border of the national park. The figure compares visibility
(Anthro dV) and the RHR glidepath at Yellowstone National Park with CELP SO2 and NOx
data. In reviewing the figure below, the observed visibility at the site seems, on the whole,
to be following the designed glidepath. 13 The graphical data from CELP appear to be
unrelated to the Yellowstone visibility data.

13
 The “glidepath” is a straight line of deciviews starting at the baseline (≈ 2000-2004) through the 2064
endpoint of the RHR program. The “endpoint” is the final desired deciviews which represents “remedying of
… existing impairment of visibility … which … results from manmade pollution.” (Clean Air Act). If visibility is
Colstrip Energy Limited Partnership
Four-Factor Analysis
Project #: ROS219002 Page 18
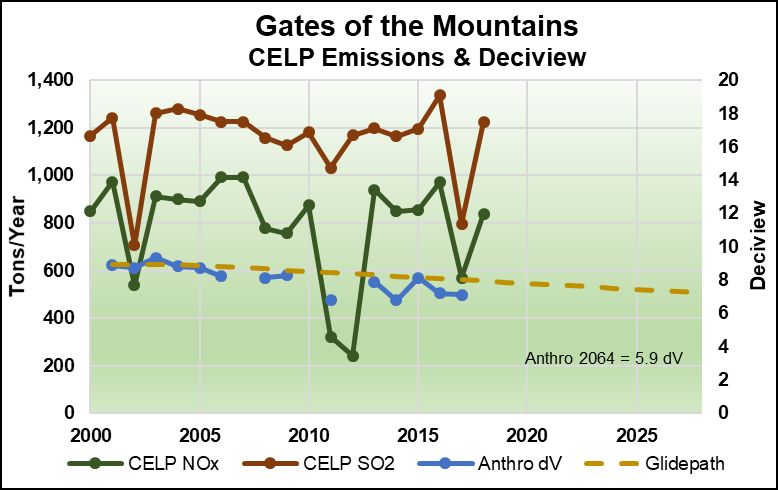
Figure 10: CELP SO2 and NOx Emissions from 2000 to 2018 Compared with the
 Yellowstone National Park Visibility Glidepath Through 2028

The full correlation analysis results are available in Appendix A, but no evident correlations
are seen for CELP. The glidepath seems to be trending in the same direction as Colstrip
Units 1-4 NOx and SO2, but the emissions and visibility seem less related.

4.5.5 Gates of the Mountains Wilderness Area Visibility vs. Emissions

The Gates of the Mountains Wilderness Area was selected as another Class I area to
review for completion purposes. Tthe area is about 410 kilometers WNW of the CELP
facility making it an area very unlikely to be impacted by CELP. Nonetheless, a review of
that data was undertaken. A graphical review of the emissions and visibility data over time
is provided below.

following this glidepath it is evidence of reasonable progress towards the national goal.
Colstrip Energy Limited Partnership
Four-Factor Analysis
Project #: ROS219002 Page 19
Figure 11: CELP SO2 and NOx Emissions from 2000 to 2018 Compared with
 Gates of the Mountains Wilderness Area Visibility Glidepath Through 2028

The graphic reveals two interesting features. The visibility improvement is ahead of the
desired uniform rate of progress wanted for the program. And the current visibility (mean
for past five years) is at or near the desired level for this 2nd planning period.

Given the distance and general wind direction, any relation of CELP emissions to Gates
of the Mountains visibility seems implausible. No correlation is seen with CELP data.
Surprisingly, there appear to be correlations between Colstrip Units 1-4 emissions data
and Gates of the Mountains visibility. However, correlations do not always equal causation
and, as with all of this information, it must be viewed as a whole.

Colstrip Energy Limited Partnership
Four-Factor Analysis
Project #: ROS219002 Page 20
5.0 FOUR-FACTOR ANALYSIS

The following four-factor analysis was completed for CELP in response to the March 13,
2019, email from MDEQ. This facility was selected by MDEQ because of a “Q/d” analysis
used by MDEQ to screen facilities for Round 2. 14 MDEQ’s analysis used 4.0 as the action
threshold for determining enrollment in Phase 2. The CELP facility had a Q/d of 10.26,
over the action threshold, when utilizing 2014-2017 average annual emissions. As
previously mentioned, additional controls for CELP were considered by EPA during Round
1 using the four-factor analysis and process. That analysis is revisited and updated for this
discussion.

The following outlines the analysis for this source using primarily the direction of the EPA
Draft Guidance [10] and the WRAP 2009 four-factor analysis [11]. The initial step in the
four-factor analysis was to identify possible additional control options for this source. The
options chosen include control techniques addressed in guidelines published by EPA, the
EPA Cost Control Manual, BART analyses, and National Association of Clean Air
Agencies (NACAA).

5.1 SO2 Control Measures

Several techniques can be used to reduce SO2 emissions from fossil fuel combustion
sources. SO2 control options can be divided into pre-combustion strategies (e.g.,
combusting low sulfur fuels, fuel blending, coal cleaning, etc.), combustion techniques
(e.g., types of boilers, turbines, etc.), and post-combustion controls (e.g., wet scrubbers,
dry scrubbers, etc.).

CELP currently controls SO2 emissions using limestone injection. Limestone is injected
with the waste coal prior to its combustion in the boiler. In the boiler, the limestone calcines
to lime and reacts with SO2 to form calcium sulfates and calcium sulfites. The calcium
compounds are removed as particulate matter by the baghouse. Depending on the fuel
fired in the boiler and the total heat input, CELP must control SO2 between a 70% to 90%
reduction per Montana Operating Permit #OP2035-03. The current limestone injection
system is operating at or near its maximum capacity and increasing limestone injection
beyond the current levels results in plugging of the injection lines, increased bed ash
production which can reduce combustion efficiency, and increased particulate loading to
the baghouses. Increasing limestone injection beyond its current level would require major
upgrades to the limestone feeding system and the baghouses. Furthermore, an upgrade
to the existing limestone injection system would expect only modest increases in SO2
removal efficiency compared to add-on SO2 control systems which were further analyzed
within this section. Therefore, upgrading the existing system is not considered further. This
analysis will focus on add-on control systems for SO2 control.

14
 See email letter from MDEQ dated March 13, 2019.
Colstrip Energy Limited Partnership
Four-Factor Analysis
Project #: ROS219002 Page 21
5.1.1 SO2 Control Technologies Considered

As CELP’s fuel type (waste coal), type of boiler (Circulating Fluidized Bed Combustion),
and the limestone system are operating at current maximum capacity, this cost analysis
will focus on post-combustion controls to further reduce sulfur dioxide emissions beyond
the existing limestone injection control. The post-combustion controls that are potentially
technically feasible in this application are flue gas desulfurization (FGD) systems. FGD
options for the CFBC boiler include: Wet Lime Scrubber, Wet Limestone Scrubber, Dual-
Alkali Scrubber, Spray Dry Absorber, Dry Sorbent Injection, Circulating Dry Scrubber, and
Hydrated Ash Reinjection. Each control system is briefly described as follows.

Wet Lime Scrubber

The wet lime scrubbing process uses alkaline slurry made by adding lime (CaO) to water.
The alkaline slurry is sprayed into the exhaust stream and reacts with the SO2 in the flue
gas. Insoluble calcium sulfite (CaSO3) and calcium sulfate (CaSO4) salts are formed in the
chemical reaction that occurs in the scrubber. The salts are removed as a solid waste by-
product. The waste by-product is mainly CaSO3, which is difficult to dewater. Solid waste
by-products from wet lime scrubbing are typically managed in dewatering ponds and
landfills.

Wet Limestone Scrubber

Wet limestone scrubbers are very similar to wet lime scrubbers. The use of limestone
(CaCO3) instead of lime requires different feed preparation equipment and a higher liquid-
to-gas ratio. The higher liquid-to-gas ratio typically requires a larger absorbing unit. The
limestone slurry process also requires a ball mill to crush the limestone feed.

Wet lime/limestone scrubbers can achieve SO2 control efficiencies of approximately 95%
or greater when used on boilers burning higher sulfur bituminous coals but may be less on
lower sulfur coals. The actual control efficiency of a wet lime/limestone FGD system
depends on several factors, including the uncontrolled SO2 concentration entering the
scrubber. Similar to wet lime scrubbers, wet limestone scrubbers generate sludge that can
create material handling and disposal issues.

Dual Alkali Wet Scrubber

Dual-alkali scrubbers use a sodium-based alkali solution to remove SO2 from the
combustion exhaust gas. The process uses both sodium-based and calcium-based
compounds. The sodium-based reagents absorb SO2 from the exhaust gas, and the
calcium-based solution (lime or limestone) regenerates the spent liquor. Calcium sulfites
and sulfates are precipitated and discarded as sludge, and the regenerated sodium
solution is returned to the absorber loop.

The dual-alkali process requires lower liquid-to-gas ratios than scrubbing with lime or
limestone. The reduced liquid-to-gas ratios generally mean smaller reaction units;
however, additional regeneration and sludge processing equipment is necessary.
Colstrip Energy Limited Partnership
Four-Factor Analysis
Project #: ROS219002 Page 22
A sodium-based scrubbing solution, typically consisting of a mixture of sodium hydroxide,
sodium carbonate, and sodium sulfite, is an efficient SO2 control reagent. However, the
process generates a sludge that can create material handling and disposal issues. The
control efficiency is similar to the wet lime/limestone scrubbers at approximately 95% or
greater. Once again, control efficiencies are highly dependent upon the uncontrolled SO2
concentration entering the scrubber.

Spray Dry Absorber

The typical spray dry absorber (SDA) uses lime slurry and water injected into a tower to
remove SO2 from the combustion gases. The towers must be designed to provide
adequate contact and residence time between the exhaust gas and the slurry in order to
produce a relatively dry by-product. The process equipment associated with an SDA
typically includes an alkaline storage tank, mixing and feed tanks, atomizer, spray
chamber, particulate control device, and recycle system. The recycle system collects solid
reaction products and recycles them back to the spray dryer feed system to reduce alkaline
sorbent use.

SDAs are the commonly used dry scrubbing method in large industrial and utility boiler
applications. SDAs have demonstrated the ability to achieve greater than 95% SO2
reduction. Once again, control efficiencies are highly dependent upon the uncontrolled
SO2 concentration entering the scrubber.

Dry Sorbent Injection

Dry sorbent injection (DSI) involves the injection of powdered or hydrated sorbent (typically
alkaline) directly into the flue gas exhaust stream. Dry sorbent injection systems are simple
systems, and generally require a sorbent storage tank, feeding mechanism, transfer line
and blower, and injection device. The dry sorbent is typically injected countercurrent to the
gas flow through a venturi orifice. An expansion chamber is often located downstream of
the injection point to increase residence time and contact efficiency. Particulates
generated in the reaction are controlled in the system’s particulate control device.

SO2 control efficiencies for dry sorbent injection systems are approximately 50%, but if the
sorbent is hydrated lime, then 80% or greater removal can be achieved. These systems
are commonly called lime spray dryers. Once again, control efficiencies are highly
dependent upon the uncontrolled SO2 concentration entering the scrubber.

Circulating Dry Scrubber

The circulating dry scrubber (CDS) uses a circulating fluidized bed of dry hydrated lime
reagent to remove SO2. Flue gas passes through a venturi at the base of a vertical reactor
tower and is humidified by a water mist. The humidified flue gas then enters a fluidized
bed of powdered hydrated lime where SO2 is removed. The dry by-product produced by
this system is routed with the flue gas to the particulate removal system.

Colstrip Energy Limited Partnership
Four-Factor Analysis
Project #: ROS219002 Page 23
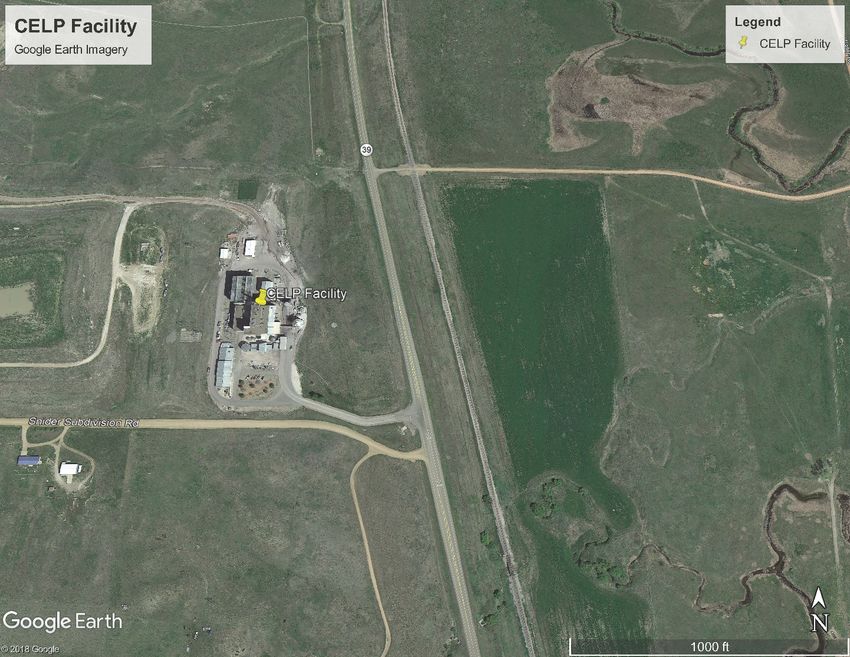
Hydrated Ash Reinjection

The hydrated ash reinjection (HAR) process is a modified dry FGD process developed to
increase utilization of unreacted lime (CaO) in the CFBC ash and any free lime left from
the furnace burning process. The hydrated ash reinjection process will further reduce the
SO2 concentration in the flue gas. The actual design of a hydrated ash reinjection system
is vendor-specific. In a hydrated ash reinjection system, a portion of the collected ash and
lime is hydrated and re-introduced into a reaction vessel located ahead of the fabric filter
inlet. In conventional boiler applications, additional lime may be added to the ash to
increase the mixture’s alkalinity. For CFBC applications, sufficient residual CaO is
available in the ash and additional lime is not required.

5.1.2 Eliminating Technically Infeasible Options

CDS systems result in high particulate loading to the unit’s particulate control device.
Because of the high particulate loading, the pressure drop across a fabric filter would be
unacceptable; therefore, electrostatic precipitators (ESP) are generally used for particulate
control. CELP has a high efficiency fabric filter (baghouse) in place. Based on limited
technical data from non-comparable applications and engineering judgment, it has been
determined that CDS is not technically feasible with a CFBC boiler equipped with a fabric
filter for particulate control. Therefore, CDS will not be evaluated further.

The CELP facility has a limited area to install additional SO2 controls that would require
high quantities of water and dewatering ponds (see Figure 12). The wet FGD scrubber
systems with the higher water requirements (Wet Lime Scrubber, Wet Limestone
Scrubber, Dual Alkali Wet Scrubber) would require an on-site dewatering pond or an
additional landfill to dispose of scrubber sludge. Due to CELP’s limited available space, its
proximity to the East Armels Creek to the east of the plant and an unnamed creek to the
south of the plant, and limited water availability for these controls, these technologies are
considered technically infeasible and will not be evaluated further.

Colstrip Energy Limited Partnership
Four-Factor Analysis
Project #: ROS219002 Page 24
Figure 12: CELP Property Boundary and Adjacent Creeks

5.1.3 Identify Technically Feasible Options

Technologies requiring low amounts of water and installation space were evaluated. The
three technically feasible control options for the CELP facility were determined to be HAR,
SDA, and DSI.

The ability of the existing fabric filter baghouses at CELP to accommodate additional
particulate resulting from HAR, SDA or DSI is in question based on prior conversations
with a vendor of these systems. The vendor previously indicated that the baghouse design
must be matched with the add-on control systems and its resulting particulate loading.
Therefore, the existing baghouse system would need to be replaced or potentially
redesigned significantly to accommodate the increase in particulate in the flue gas stream.
As a result, we have included a redesigned (new) fabric filter baghouse in the cost for each
SO2 control technology. The costs of these feasible technologies will be discussed in
Section 5.3.

Colstrip Energy Limited Partnership
Four-Factor Analysis
Project #: ROS219002 Page 25
5.2 NOx Control Measures

Applicable NOx control technologies can be divided into two main categories: combustion
controls, which limit NOx production, and post-combustion controls, which destroy NOX
after formation.

CELP currently controls NOx emissions using good combustion practices in the CFBC
boilers. 15 Emissions are controlled through the boiler design and its lower operating
temperatures, and a recirculation of fuel and ash particles through the combustion boiler.
The lower operating temperature in a CFBC boiler already reduces the formation of
thermal NOx emissions in the range of 50% or more compared to other boiler designs.
CELP must meet NOx emission limits of 328.0 pounds per hour, 7,864 pounds per day,
and 1,435 tons per year per #OP2035-03. CELP demonstrates compliance with these
limits using continuous emission monitors and EPA Method 7.

5.2.1 NOx Control Technologies Considered

As CELP is currently using boiler design to control NOx emissions, only post-combustion
controls were considered for this analysis. The post-combustion controls that are initially
technically feasible in this application are Low Excess Air (LEA), Flue Gas Recirculation
(FGR), Overfire Air (OFA), Low NOx Burners (LNB), Selective Catalytic Reduction (SCR),
and Selective Non-Catalytic Reduction.

Low Excess Air

LEA operation involves lowering the amount of combustion air to the minimum level
compatible with efficient and complete combustion. Limiting the amount of air fed to the
furnace reduces the availability of oxygen for the formation of fuel NOx and lowers the
peak flame temperature, which inhibits thermal NOx formation.

Emissions reductions achieved by LEA are limited by the need to have sufficient oxygen
present for flame stability and to ensure complete combustion. As excess air levels
decrease, emissions of CO, hydrocarbons and unburned carbon increase, resulting in
lower boiler efficiency. Other impediments to LEA operation are the possibility of increased
corrosion and slagging in the upper boiler because of the reducing atmosphere created at
low oxygen levels.

This technology is typically utilized on Pulverized Coal (PC)-fired units. This option cannot
be utilized on CFBC due to air needed to fluidize the bed.

15
 CFBC technology design has inherently lower combustion temperatures than pulverized coal (PC)
technology. The lower combustion temperature of a CFBC boiler (1550 – 1650ºF) typically leads to a lower
formation of thermal NOx than a PC boiler, which has a relatively higher combustion temperature (2400 –
2700ºF) and more thermal NOx.

Colstrip Energy Limited Partnership
Four-Factor Analysis
Project #: ROS219002 Page 26
You can also read