March 2020 DRAFT Seattle's Source Control Plan for the Lower Duwamish Waterway (2021 - 2026) - The Department of Ecology
←
→
Page content transcription
If your browser does not render page correctly, please read the page content below
Seattle’s Source Control Plan for
                    the Lower Duwamish Waterway
                              (2021 – 2026)
                           March 2020 DRAFT

Before inspection                 After inspection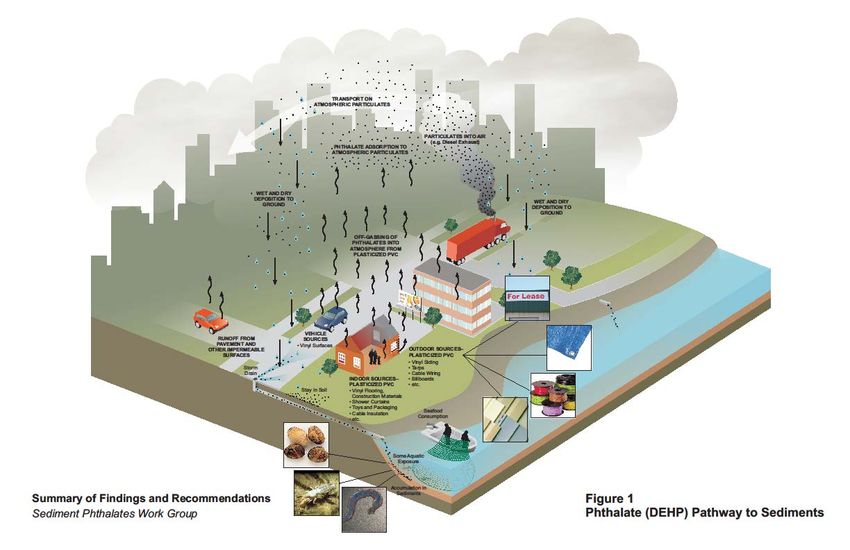
TABLE OF CONTENTS
1.    Introduction .......................................................................................................................................... 1
             Approach ....................................................................................................................................... 2
2.    Background ........................................................................................................................................... 2
             Drainage and Wastewater Systems in the LDW ........................................................................... 3
      2.1.1.    City Storm Drains .................................................................................................................. 6
      2.1.2.    Combined Sewer Overflows.................................................................................................. 6
      2.1.3.    Emergency Overflows ........................................................................................................... 8
3.    Business inspection program ................................................................................................................ 8
             Corrective Actions ......................................................................................................................... 9
      3.1.1.   Notices of Violation ............................................................................................................. 10
      3.1.2.   Referrals .............................................................................................................................. 10
4.    Source Tracing/Sampling Program ..................................................................................................... 10
             2014‐2019 Progress .................................................................................................................... 11
      4.1.1.   Source Tracing ..................................................................................................................... 11
           Overview by Chemicals Found in Storm Drain Solids Samples (2003 – 2019) ............................ 13
      4.2.1.   Arsenic................................................................................................................................. 15
      4.2.2.   Copper ................................................................................................................................. 16
      4.2.3.   Lead ..................................................................................................................................... 16
      4.2.4.   Mercury ............................................................................................................................... 17
      4.2.5.   Zinc ...................................................................................................................................... 18
      4.2.6.   LPAH .................................................................................................................................... 18
      4.2.7.   HPAH ................................................................................................................................... 19
      4.2.8.   cPAH .................................................................................................................................... 20
      4.2.9.   PCBs..................................................................................................................................... 20
      4.2.10. Phthalates ........................................................................................................................... 22
      4.2.11. Dioxins/Furans .................................................................................................................... 24
           Near End‐Of‐Pipe Samples .......................................................................................................... 25
             Outfall to Outfall Comparisons ................................................................................................... 26
             New Sediment Trap Design ......................................................................................................... 26
5.    Status of Data Gaps Identified in Previous SCIP.................................................................................. 27
6.    Line cleaning program......................................................................................................................... 28
             Progress To Date ......................................................................................................................... 29
7.    Citywide programs .............................................................................................................................. 32
             Spill Response and Water Quality Investigations ....................................................................... 32
      7.1.1.      Denver Ave S PCB Spill ........................................................................................................ 32
           Illicit Discharge Detection and Elimination ................................................................................. 32
             Street Sweeping .......................................................................................................................... 33

City of Seattle                                                                     i                                                        March 29, 2020
LDW 2021 ‐ 2026 Source Control Plan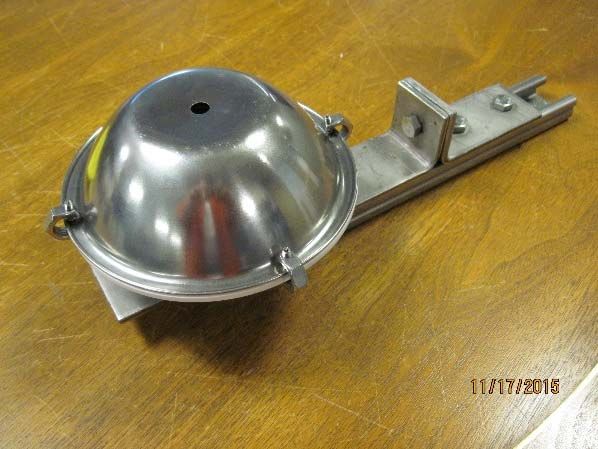
Site Investigations ....................................................................................................................... 33
       7.4.1.   Seattle Department of Transportation ............................................................................... 33
       7.4.2.   Seattle Parks Department ................................................................................................... 33
            Transportation Programs ............................................................................................................ 34
       7.5.1.    Arterial Asphalt Concrete (AAC) Program ........................................................................... 35
       7.5.2.    Arterial Major Maintenance ............................................................................................... 35
       7.5.3.    Non‐Arterial Street Resurfacing and Restoration (NASRR) ................................................. 35
       7.5.4.    Slurry Sealing ....................................................................................................................... 35
            Capital Projects ........................................................................................................................... 36
       7.6.1.  SPU ...................................................................................................................................... 36
       7.6.2.  SDOT .................................................................................................................................... 36
8.     City‐Owned Property and Right‐of‐Way ............................................................................................. 37
              Discovering and Reporting Contamination ................................................................................. 38
9.     2021 – 2026 Plan................................................................................................................................. 41
              Business Inspections ................................................................................................................... 41
       9.1.1.   Upper Reach ........................................................................................................................ 41
       9.1.2.   Middle Reach ...................................................................................................................... 41
       9.1.3.   Lower Reach ........................................................................................................................ 41
       9.1.4.   Direct Dischargers ............................................................................................................... 41
            Storm Drain Solids Sampling ....................................................................................................... 42
    9.2.1.   Basin Prioritization .............................................................................................................. 42
    9.2.2.   Planned Sampling Activities ................................................................................................ 47
    9.2.3.   Other Source Tracing Activities ........................................................................................... 53
10. Long‐Term Monitoring and Effectiveness Evaluation ......................................................................... 53
              Line Cleaning ............................................................................................................................... 55
              Transportation ............................................................................................................................ 56
11. Reporting ............................................................................................................................................ 56
12. References .......................................................................................................................................... 57

Figures
Figure 1: Mercury in Diagonal Ave S CSO/SD near end‐of‐pipe samples. .................................................. 17
Figure 2: Frequency histogram of PCBs in private onsite versus right‐of‐way catch basins (2003‐2019) . 21
Figure 3: BEHP pathways. ........................................................................................................................... 24
Figure 4: Comparison of dioxins/furans in City and non‐City storm drains and combined sewers in the
          LDW and East Waterway. ............................................................................................................. 25
Figure 5: Field prototype #1. ...................................................................................................................... 27
Figure 6: Field prototype #2. ...................................................................................................................... 27
Figure 7: Field prototype #3. ...................................................................................................................... 27
Figure 8: Soil sample locations at Duwamish Waterfront Park.................................................................. 34

City of Seattle                                                                     ii                                                      March 29, 2020
LDW 2021 ‐ 2026 Source Control Plan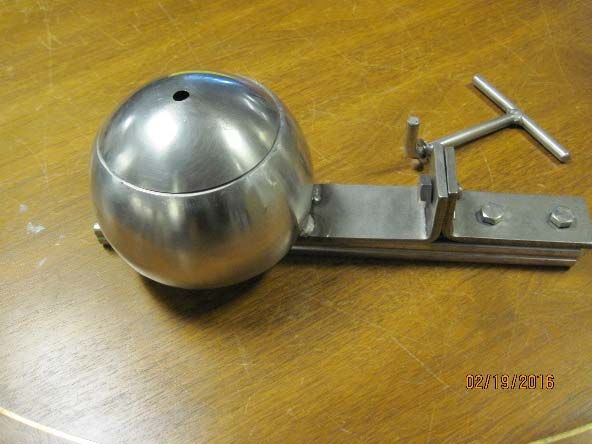
Tables
Table 1:       LDW remedial action levels. ...................................................................................................... 1
Table 2:       Outfalls in the LDW that are owned or used by City of Seattle. ............................................... 5
Table 3:       CSO 111 overflow records (2007‐2018). ................................................................................... 7
Table 4:       Emergency overflow records..................................................................................................... 8
Table 5:       Summary of corrective actions.................................................................................................. 9
Table 6:       Summary of source tracing samples collected in the LDW (July 2014 through June 2019). .. 11
Table 7:       Source tracing sample counts by sample type (July 2014 through June 2019). ..................... 12
Table 8:       New traps installed 2014‐2019. .............................................................................................. 12
Table 9:       Sediment traps maintained by SPU in the LDW. ..................................................................... 13
Table 10:      Summary statistics for select contaminants in storm drain solids collected from the City
               MS4.......................................................................................................................................... 14
Table 11:      Samples containing elevated levels of LPAH (2014‐2019). ..................................................... 18
Table 12:      Samples containing elevated levels of HPAH (2014 ‐ 2019).................................................... 19
Table 13:      Summary of SPU line cleaning in the LDW. ............................................................................. 30
Table 14:      City‐owned facilities with SWPPPs in LDW.............................................................................. 38
Table 15:      City‐owned properties on Ecology's confirmed and suspected site list.................................. 39
Table 16:      Public right‐of‐way locations on Ecology's confirmed and suspected site list as of December
               2019. ........................................................................................................................................ 40
Table 17:      Summary of outfall prioritization. ........................................................................................... 44
Table 18:      Summary of Planned Source Tracing Activities by Outfall (2021 – 2026). .............................. 48
Table 19:      Existing sediment traps that SPU will operate/maintain over the next five years. ................ 54
Table 20:      Locations where new sediment traps will be installed over the next 5 years. ....................... 54

Appendices
Appendix A:          Business inspection, source tracing, and line cleaning information
Appendix B:          Box plots and near end‐of‐pipe heat tables for storm drain solids samples
Appendix C:          Summary of source tracing results by outfall
Appendix D:          Description of sources identified to date
Appendix E:          Spill and water quality complaint response (July 1, 2014 – June 30, 2019)
Appendix F:          Citywide programs that support source control in the LDW
Appendix G:          Business inspected (July 1, 2014 – June 30, 2019)
Appendix H:          Notices of violations issued (July 1, 2014 – June 30, 2019)
Appendix I:          Businesses referred to other agencies (July 1, 2014 – June 30, 2019)
Appendix J:          Outfall ranking and prioritization
Appendix K:          City‐owned properties and rights‐of‐way on Ecology’s confirmed and suspected
                     contaminated site list
Appendix L:          Corrective actions tracked in database
Appendix M:          Private drainage facilities inspected (July 1, 2014 – June 30, 2019)

City of Seattle                                                                    iii                                                        March 29, 2020
LDW 2021 ‐ 2026 Source Control Plan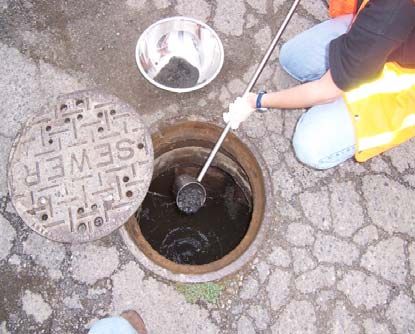
Acronyms and Abbreviations
AKART               All known, available and reasonable methods of prevention, control and treatment
AOC                 Administrative Order on Consent
As                  Arsenic
BA                  Benzoic acid
BAl                 Benzyl alcohol
BBP                 Butyl benzyl phthalate
BEHP                Bis(2‐ethylhexyl)phthalate
CB                  Catch basin
Cu                  Copper
COC                 Chemical of concern
cPAH                Carcinogenic polycyclic aromatic hydrocarbons = sum of benzo(a)anthracene,
                    benzo(a)pyrene, benzo(b)fluoranthene, benzo(k)fluoranthene, chrysene,
                    dibenz(a,h)anthracene, indeno(1,2,3‐cd)pyrene
CSCSL               Confirmed and suspected contaminated site list
CSL                 Cleanup screening level per Washington State Department of Ecology Sediment
                    Management Standards (WAC 173‐204)
CSO                 Combined sewer overflow
DMP                 Dimethyl phthalate
Ecology             Washington State Department of Ecology
EOF                 Emergency overflow
EPA                 U.S. Environmental Protection Agency
ERTS                Environmental report tracking system
HPAH                High molecular weight polycyclic aromatic hydrocarbons = sum of benzo(a)anthracene,
                    benzo(a)pyrene, benzo(b)fluoranthene, benzo(g,h,i)perylene, benzo(k) fluoranthene,
                    chrysene, dibenz(a,h)anthracene, fluoranthene, indeno(1,2,3‐cd)pyrene, pyrene
KC                  King County
LAET                Lowest apparent effects threshold (dry weight equivalent of the sediment cleanup
                    objective)
2LAET               Second lowest apparent effects threshold (dry weight equivalent of cleanup screening
                    level)
LDW                 Lower Duwamish Waterway
LDWG                Lower Duwamish Waterway Group (City of Seattle, King County, Port of Seattle, and The
                    Boeing Company)
LPAH                Low molecular weight polycyclic aromatic hydrocarbons = sum of acenaphthene,
                    acenaphthylene, anthracene, fluorene, naphthalene, phenanthrene
Hg                  Mercury
MEP                 Maximum extent practicable
mg/kg               milligrams per kilogram
MH                  Maintenance hole

City of Seattle                                           iv                                  March 29, 2020
LDW 2021 ‐ 2026 Source Control Plan
MS4                 Municipal separated storm sewer system per the National Pollutant Discharge
                    Elimination System program
MTCA                Washington State Model Toxics Control Act (WAC 173‐340)
NEP                 Near end‐of‐pipe
ng/kg               nanogram per kilogram
NOV                 Notice of violation
NPDES               National Pollutant Discharge Elimination System
ODS                 Outside drainage system. For source tracing purposes, ODS samples include soil, surface
                    dirt, or other material such as paint or caulk.
Parks               Seattle Department of Parks and Recreation
Pb                  Lead
PCBs                Polychlorinated biphenyls
PS                  Pump station
RAL                 Remedial action level
RCB                 Catch basin located in the public right‐of‐way
ROW                 Right of way
RI/FS               Remedial Investigation/Feasibility Study
SCIP                Source Control Implementation Plan.
SCIP 1              City of Seattle Source Control Implementation Plan for 2015‐2020
SCIP 2              City of Seattle Source Control Implementation Plan for 2021‐2026
SCO                 Sediment cleanup objective per Washington State Department of Ecology Sediment
                    Management Standards (WAC 173‐204)
SD                  Storm drain
SDCI                Seattle Department of Construction and Inspections
SDOT                Seattle Department of Transportation
SMS                 Sediment Management Standards (WAC 173‐204)
SPU                 Seattle Public Utilities
TEQ                 Toxicity equivalent. Calculated using the following toxicity equivalency factors for cPAH
                    per Lower Duwamish Water Group:
                             benzo(a)anthracene:             0.1
                             benzo(a)pyrene                   1
                             benzo(b)fluoranthene            0.1
                             benzo(k)fluoranthene            0.1
                             chrysene                       0.01
                             dibenz(a,h)anthracene           0.4
                             indeno(1,2,3‐cd)pyrene          0.1
TPH                  Total petroleum hydrocarbons per method NWTPH‐Dx (diesel extended)
ug/kg dw             micrograms per kilogram, dry weight
WSDOT                Washington State Department of Transportation
Zn                   Zinc

City of Seattle                                             v                                    March 29, 2020
LDW 2021 ‐ 2026 Source Control Plan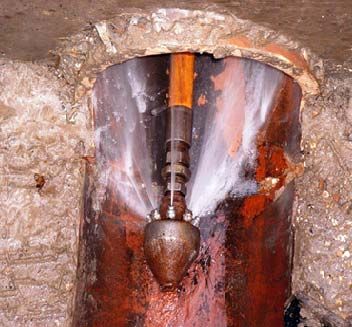
1. INTRODUCTION
This report presents Seattle’s Source Control Implementation Plan (SCIP) for the Lower Duwamish Waterway
(LDW) for the period 2021 to 2026. It is the City’s second 5‐year plan, presenting information on the City’s
source control efforts over the past five years and plans for the next five years. The SCIP is developed by Seattle
to describe the results and actions focused on source control in the Lower Duwamish Waterway, present
information for use in the LDW Superfund sufficiency evaluation and meet the requirements of Appendix 13 of
the 2019‐2024 National Pollutant Discharge Elimination System (NPDES) Phase I Municipal Stormwater Permit.
The remedial design phase of the cleanup began in 2016 with the release of the 3rd Administrative Order on
Consent (AOC) for the Lower Duwamish Waterway Superfund site, which directed the Lower Duwamish
Waterway Group (LDWG) to conduct predesign studies needed to advance the implementation of the Selected
Remedy for the LDW (EPA 2016). Seattle has incorporated pertinent data generated as part of these pre‐design
studies, to assess source control actions and develop priorities for future source control activities. Since then, in
2018, the U.S. Environmental Protection Agency (EPA) issued the 4th AOC (EPA 2018) which initiated the design
of the remedy for river mile 3.0 to 5.0 (Upper Reach). Design is expected to occur over the next 4 years, with
cleanup currently scheduled to begin in late 2024.
Seattle has taken the waterway cleanup schedule into account in developing this plan and although the City has
a relatively small footprint in the Upper Reach compared to other areas in the LDW, Seattle intends to revisit the
Upper Reach to ensure that source controls are in place so that cleanup can proceed. The City’s source control
program over the next five years will also focus on the Middle Reach (mile 2.2 to 4.0) where several City outfalls
discharge to the waterway. As in the previous SCIP, Seattle’s goal over the next five years is to minimize the
potential for waterway sediments to exceed the Remedial Action Levels (RALs) set by EPA (Table 1). While
meeting the RALs in the offshore sediment is Seattle’s goal, it is important to understand that due to the urban
and industrial nature of the Duwamish watershed, low levels of contaminants are ubiquitous and will continue
being discharged to the waterway during and after cleanup. No amount of source control efforts would
eliminate these low‐level discharges.
Table 1: LDW remedial action levels.
Remedial Action Level
Chemical Units
LDW‐wide Intertidal
Arsenic mg/kg 57 28
PCBs mg/kg 12 65
g/kg dw 130 a
1,000a
cPAH g TEQ/kg dw 1,000 900
Dioxins/furans ng TEQ/kg dw 25 28
b
Benthic SMS ‐‐ 2 x SCO ‐‐
Source: EPA (2014).
a. Approximate dry‐weight equivalent of the organic carbon normalized value.
b. 10‐year post‐construction target to meet SCO.
Preventing recontamination and planning longer term objectives will require collaboration among the agencies
with jurisdiction, including the Washington State Department of Ecology (Ecology), EPA, and King County. The
City assumes that long‐term objectives will be established as part of the Ecology led Source Control Program for
implementation of the Record of Decision for the LDW. The City will coordinate with Ecology and the other
agencies to establish the long‐term objectives and incorporate them into source control plans.
City of Seattle 1 March 29, 2020
LDW 2021 ‐ 2026 Source Control Plan
This plan describes work conducted to identify and control sources in the LDW since Seattle’s 2015‐2020 Source
Control Implementation Plan (Seattle 2016) was published (covering the period July 1, 2014 through
June 30, 2019) and explains the City’s source control program in the LDW for the next five years (2021 – 2026).
It also describes what has been done and learned up to now and new strategies and improvements that will be
tried and evaluated in the future. Future expansion or changes to the City source control program over the next
five years will be predicated on available funding and resources and guided by lessons learned as the program is
refined to address future conditions and the upcoming waterway cleanup in the upper reach of the LDW
(RM 3.0 to 5.0).
Background information about the City’s stormwater and wastewater infrastructure are provided in Section 2.
Summary of findings from Seattle’s LDW‐specific business inspection, source tracing, and line cleaning programs,
are provided in Sections 3, 4, and 5, respectively. Section 6 describes the City’s planned source control activities
for the next five years and Section 8 describes mechanisms for reporting progress to Ecology.
APPROACH
In developing this plan, the City used a three‐pronged approach: (1) document current source control activities
in the LDW, (2) prioritize drainage basins/systems in the LDW, and (3) develop plan for next five years and
prioritize future program enhancements. The City used multiple lines of evidence to prioritize drainage
basins/systems so that future activities could be focused on the most critical areas. Priority basins were selected
as follows:
Locations where elevated levels of contaminants were found in both offshore sediment samples
collected in the vicinity of the outfall and storm drain solids samples collected from the downstream end
of the drainage system (i.e., near end‐of‐pipe samples).
Locations where storm drain solids contaminant concentrations are significantly higher than in other
drains in the LDW, which suggests the presence of a unique source(s) in that basin.
Locations where offshore sediments were predicted to exceed the sediment RAL based on the sediment
transport/bed composition model that was developed during the LDW Feasibility Study.
Priority basins were then ranked using the following criteria:
Evidence of ongoing sources and pollution‐generating activities in the basin based on business
inspection findings.
Drainage basin size, which provides an indication of pollutant loading potential.
Multiple and recurring exceedances of source tracing triggers for chemicals of concern identified in
waterway sediment, which indicates need for additional source tracing.
Land use characteristics such as percentage of industrial use in the basin.
A detailed description of how basins were prioritized is provided in Appendix J.
Future program improvements are included in this plan and are listed in each section as enhancements.
2. BACKGROUND
Seattle Public Utilities (SPU) has implemented an aggressive source control program in the LDW drainage basin
since early 2003. At that time, LDWG’s municipal partners (e.g., City of Seattle, King County, and Port of
Seattle), began to coordinate their efforts to identify and reduce sources of contamination to the LDW. EPA and
Ecology were also beginning to develop a comprehensive strategy for controlling sources to the LDW; the final
version was published by Ecology in 2004. Ecology’s strategy was last updated in 2016.
City of Seattle 2 March 29, 2020
LDW 2021 ‐ 2026 Source Control Plan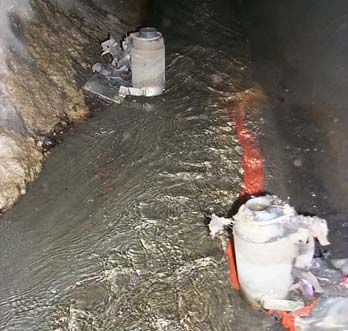
Since its start in 2003, Seattle’s source control program has been successful in identifying and controlling
sources of contaminants to the LDW. SPU’s source control program includes activities specifically designed to
support the cleanup of the waterway, as well as activities that are employed citywide as part of the City’s
stormwater management program. The LDW‐specific activities that Seattle must implement are contained in
Appendix 13 Ecology’s NPDES Phase I Municipal Stormwater Permit. While the SCIP describes both stormwater
and wastewater systems, Appendix 13 requirements are only applicable to the municipal storm sewer system
(MS4). The program includes more comprehensive and frequent business inspections than in other parts of the
City. The Appendix 13 LDW‐specific activities include focused source sampling, an effectiveness monitoring
program, targeted line‐cleaning, and an annual prioritization process. Citywide activities that support source
control efforts in the LDW include the spill response program, water quality complaint response program, illicit
discharge detection and elimination program, operations and maintenance of the City‐owned drainage and
wastewater systems and properties, stormwater code development and implementation, drainage system
retrofits and other capital improvements, public education and outreach, and interdepartmental coordination.
These programs are described in Appendix F.

      DRAINAGE AND WASTEWATER SYSTEMS IN THE LDW
The City owns and operates most of the municipal systems that collect stormwater and wastewater from homes
and businesses throughout Seattle. King County owns the conveyance system that transports the
stormwater/wastewater from the City trunk lines to the treatment plants. Both the City and County wastewater
collection systems overflow to the Duwamish when there are combined sewer overflows (CSOs). When the
system was originally built early in the 1900’s, stormwater and wastewater were collected in the same pipes and
the combined sewage was discharged to a receiving water body, including the Duwamish. Later some of the
combined sewage was routed to a treatment plant, such as the one that Seattle built near Diagonal Ave S and
E Marginal Wy S in 1938.
In 1961, following the formation of METRO, the City and METRO agreed that METRO would take over ownership
and operation of the combined sewer trunk lines, collection pipes and associated overflow points for large
(1,000 acres or more) basins.1 The City continued operating the local collection system and overflow points for
smaller basins, which conveyed combined stormwater and wastewater to METRO’s trunk lines. METRO agreed
to “accept” the City’s sewage and took responsibility for treating it.
In 1985 the Washington Legislature enacted a requirement that combined sewer overflows be reduced at the
earliest possible date. The Department of Ecology directed METRO to reduce the volume of overflows from its
CSOs by 75 percent by the year 2005. METRO determined that separating stormwater from sanitary sewage
would be the fastest and most cost‐effective means to reach that goal. METRO and the City worked together to
separate stormwater from wastewater in several drainage basins. The consequence of that effort was that
more untreated stormwater was discharged to local water bodies. As our understanding of stormwater impacts
has evolved and stormwater regulations were promulgated, CSO control projects have more recently focused on
using green stormwater infrastructure to mitigate stormwater impacts to the combined sewer system.
Due to this history, the City currently is served by three kinds of drainage systems2:

1
    The Metropolitan Sewerage System shall thus include trunk or interceptor sewer facilities extending to a point within each tributary,
    and natural drainage area, where not more than one thousand acres remain to be served beyond the upper terminus of such trunk or
    interceptor sewer. Basic Agreement, p. 2.
2   The drainage system is termed the Municipal Separate Storm Sewer System (MS4) by Ecology and EPA.

City of Seattle                                                     3                                                      March 29, 2020
LDW 2021 ‐ 2026 Source Control Plan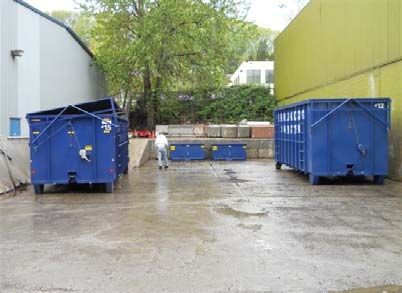
Separate storm sewer system where stormwater is collected in storm drains, which discharge directly to
the receiving water bodies and wastewater is collected in a sanitary sewer system which conveys flow to
the King County conveyance system and treatment plants at West Point or Renton.
Combined sewer system where stormwater and wastewater are collected in a single pipe and flow is
routed to the treatment plants via the King County conveyance system. During large storm events,
combined flows can exceed the capacity of the conveyance system. When this occurs, excess flows are
discharged to the nearest waterway via an overflow structure to keep wastewater/stormwater from
backing up into homes, businesses, and on City streets. Seattle and King County both operate combined
sewer overflows (CSOs) in Seattle.
Partially separated system where runoff from streets is generally collected in a separate storm drain
system, but runoff from private properties (e.g., rooftops, yards, parking lots, and other areas) continues
to discharge to the combined sewer system. These areas were once served by the combined sewer
system, but the City and METRO later constructed storm drain separation projects that diverted street
runoff from the combined system. Most of these separation projects were constructed in the
1960‐1990s, typically to reduce the occurrences of combined sewer overflows.
A total of approximately 20,000 acres discharges to the LDW Superfund Site including approximately 8,940 acres
of land in south Seattle, Georgetown, South Park, the City of Tukwila, and unincorporated King County that are
served by separated storm drains (private and public) and approximately 20,000 acres that are served by
combined sewers3.
Average annual runoff is estimated at about 4,100 million gallons per year based on average rainfall conditions
(1986) with an expected range of approximately 3,100 to 5,300 million gallons per year for typical dry (1993) and
wet years (2002), respectively (SPU 2008)4. Average annual CSO discharges for the period 2014‐2018 from King
County (195,877,000 million gallons per year) and SPU CSOs (362,000 million gallons per year) in the LDW are
estimated at approximately 196 million gallons per year.
Most of the Duwamish waterfront areas discharge stormwater directly to the LDW via privately‐owned storm
drains or sheet flow. Upland areas are typically served by a variety of private and public (i.e., City of Seattle,
Port of Seattle, City of Tukwila, King County, and Washington Department of Transportation [WSDOT]) drainage
systems. Seattle owns 18 active outfalls within the LDW study area. Seattle City Light (SCL) owns three of the
City storm drain outfalls, which only serve the Duwamish Substation. Seattle also discharges to 15 other outfalls
in the LDW that are owned by King County, WSDOT, City of Tukwila, or private entities.
In addition, Seattle operates three emergency overflows that discharge sewage to outfalls owned by King
County and the City of Tukwila. Emergency overflows are located on sanitary sewer force mains to relieve
backups due to pump station failure or mechanical clogging. All of the sanitary sewer pump stations in the LDW
are equipped with backup generators, so these systems are not affected by power outages.
Outfalls owned or used by the City of Seattle in the LDW are listed in and shown on Map 1. The source control
activities described in this plan are applicable to the portions of these systems located within the City‐owned
MS4.
3 Because much of the area in the LDW is partially separated, the separated storm and combined sewer basins overlap.
4 Annual stormwater runoff was estimated from land use, soil type, slope, and rainfall using a simplified Hydrologic Simulation
Program‐Fortran (HSPF) model.
City of Seattle 4 March 29, 2020
LDW 2021 ‐ 2026 Source Control PlanTable 2: Outfalls in the LDW that are owned or used by City of Seattle.
Outfall Currently River Outfall Map Seattle Area Diameter
Owned or Side Number a Number b Use (acres) c (inches)
Built Bym
Upper Reach
16th Ave S SD (east) Tukwila East 3031 4, 57 SD 3.2 12
3032
KCIA SD#2/ PS 78 EOF King County East 2062 ‐‐ EOF 0 48
KCIA SD#1 King County East 2080 5, 31, 58 SD 114 30
S Norfolk CSO/PS 17 Tukwila East 2095 6, 32, 59 EOF, SD 431 d 84
EOF/SD 1,060 e
I5 SD at S Ryan St WSDOT East NA 7 SD 407 60
16th Ave S SD (west) King County West 2215 8 SD 1.3 12
17th Ave S SD Seattle West NA 9, 34, 60 SD 2.9 18
S 96th St SD Private West 2100 10, 35, 61 SD 99 72
Duwamish substation Seattle West NA 11, 62 SD 1.9 8
SD#3
Duwamish substation Seattle West 2098 11, 62 SD 1 8
SD#2
Duwamish substation Seattle West 2099 11, 62 SD 0.6 8
SD#1
W Marginal Pl S SD Tukwila West 2200 11, 62 SD 4.9 30
Middle Reach
Head of Slip 2 SD Private East 2019 12, 36, 63 SD 12o 24
1st Ave S SD (east) WSDOT East 2503 13, 37, 64 SD 15 36
S River St SD Seattle East NA 14, 38, 65 SD 7.6 8
S Brighton St SD Seattle East NA 15, 39, 66 SD 19 30
S Myrtle St SD Seattle East 2026 16, 40, 67 SD 8.6 30
S Garden St SD Private East 2035 17, 41 SD 1.5 30
I5 SD at Slip4 WSDOT East 2046 18, 42, 68 SD 65 f 72
Georgetown SD Seattle East 2047 19, 43, 69 SD 4.5 24
North Boeing Field SD g Seattle East None ‐‐ None 0 24
KCIA SD #3/PS44 EOF King County East 2049 ‐‐ EOF 0 60
SW Kenny St SD/T115 Seattle West 2127 20, 44, 70 SD 154 48
CSO 100 e
Highland Park Wy SW SD Seattle West 2125 21, 45, 71 SD 296 h 72
1st Ave S SD (west) WSDOT West NA 22, 46, 72 SD 606 Channel
2nd Ave S SD Private West 23, 47, 73 SD 18.4 36 n
West Seattle reservoir Seattle West 2120 ‐‐ Water i None 36
overflow
S Webster St SD Seattle West 2113 SD j 6
7th Ave S SD Seattle West 2112 24, 48, 74 SD 238 72
City of Seattle 5 March 29, 2020
LDW 2021 ‐ 2026 Source Control PlanOutfall Currently River Outfall Map Seattle Area Outfall
Owned or Side Number a Number b Use
Built Bym
Lower Reach
S Nevada St SD Seattle East NA 25, 49, 75 SD 26 18
Diagonal Ave S CSO/SD Seattle East 2155 26, 27 CSO, SD 415 k 144
50, 51 1,500
736, 77 2,666
SW Dakota St SD Seattle West 2253 28, 52, 78 SD 47 l 30
SW Idaho St SD Seattle West 2147 29, 53, 79 SD 423 72
South Ops Center SD Seattle West ‐‐ 30 SD 6 30
SD = storm drain, CSO = combined sewer overflow, EOF = emergency overflow, (D) = drainage area, (C) = combined sewer area,
PS = pump station, Ops = Operations
Note: outfalls are listed in order from downstream end of waterway to upstream end of waterway starting with outfalls located on
the east side followed by those on the west side of the waterway
624 / 5,000 / 2,613 = City CSO basin area / King County CSO basin area / separated drainage basin
a. Number from the Herrera (2004) outfall survey used by Ecology to identify outfalls.
b. Refer to Map Atlas for maps. Maps are grouped by 1) drainage basin area, 2) business inspections, spills, and water quality
complaints 3) samples collected in each drainage system.
c. Drainage area in City MS4.
d. Includes portion of S Norfolk CSO/PS 17 EOF/SD drainage basin that can discharge to the I‐5 SD at S Ryan St during large
storm events.
e. King County combined sewer basin
f. An additional 85 acres from I‐5 and railroad right‐of‐way drain to this outfall
g. This storm drain is no longer active.
h. Does not include the approximately 7.3 acre overlap within the 1st Ave S drainage basin.
i. Overflow from drinking water reservoir. No drainage connections.
j. A single catch basin in S Riverside Dr is connected to this outfall.
k. Seattle combined sewer service area, King County combined sewer service area, and drainage basin, respectively.
l. An additional 9 acres drains to the constructed channel that discharges to the LDW downstream (i.e., east) of the City’s
outfall. See Section 5.3.3.
m. Entity that is currently responsible for the outfall.
n. Upstream end of private pipe.
o. Includes areas served by private storm drains. City MS4 includes 7 catch basins on E Marginal Wy S
and one on 1st Ave S.
2.1.1. City Storm Drains
The City‐owned MS4 serves an area of about 5,5005 acres in the LDW. Stormwater runoff from the City‐owned
MS4 is discharged to the LDW via 32 outfalls, 17 of which are owned by the City. Maps 4‐30 show the basin
areas for outfalls owned by the City of Seattle and outfalls that the City uses to discharge stormwater and/or
wastewater from City‐owned systems.
2.1.2. Combined Sewer Overflows
The City and King County both operate and maintain combined sewer overflows (CSOs) in the LDW. This plan
does not address actions in CSO basins as SPU and King County are currently developing and implementing Long
Term Control Plans to address these discharges and associated potential sources of pollutants. The information
5 Includes portions of the I‐5 corridor and railroad right‐of‐way that have not been separately delineated.
City of Seattle 6 March 29, 2020
LDW 2021 ‐ 2026 Source Control Planis provided to summarize CSOs that discharge via City‐owned outfalls in the LDW. CSO basins are shown on
Map 3.
Only one City outfall in the LDW is affected by CSOs, the Diagonal Ave S CSO/SD. Both the City (CSO 111) and
King County (Hanford #1) combined sewer systems overflow to the Diagonal Ave S CSO/SD outfall. CSO 111
serves an area of approximately 416 acres of mostly industrial and commercial property. The area is partially
separated. CSO 111 had 8 separate overflow points in the Diagonal Ave S system (111A through 111H), but two
were sealed in 2011 (111E and 111F) after records showed that these structures had not overflowed since at
least 1998 and modeling indicated that these locations had a low probability of ever overflowing in the future
(CH2M Hill et al. 2012). Overflow records are summarized in Table 3.
In 2005, SPU modified the overflow structure on the largest overflow point (111D) to allow more flow to enter
the King County system for treatment at its West Point facility. In 2014, SPU raised the overflow weirs at
outfalls B and C. SPU has been monitoring the system and updated the basin model in 2018. Modeling indicates
that raising the weirs has decreased the frequency of overflows at CSO 111 from 1.9 to 1.2 times per year on
average (SPU 2019).
CSO 111 was included in the Long‐Term Control Plan (LTCP) that SPU prepared to control CSOs throughout the
City (CH2M Hill et al. 2015).6 It identified the following control measures for CSO 111:
Offline storage for overflows 111B 111C to be provided by modifying existing control structures and
rerouting storm drains to isolate the structures. Two new effluent pump stations will also be installed.
Offline storage for overflow 111H.
Table 3: CSO 111 overflow records (2007‐2018).
No. of Duration Total Volume Rainfall Total
Year
Overflows (hrs) (gallons) (inches)
2007 11 134 22,293,000 31.8
2008 0 0 0 29.3
2009 9 7 1,483,000 37.7
2010 6 41 1,721,000 45.6
2011 2 18 1,236 35.8
2012 4 28 315,000 47.6
2013 3 4 11,507 27.9
2014 3 17 146,654 46.8
2015 3 6.6 1,056,402 39.9
2016 0 0 0 45.2
2017 2 5.9 549,547 44.5
2018 1 2.8 56,370 33.7
2019 1 8 1,401,251 29.3
The Diagonal outfall also receives overflows from King County’s Hanford #1 (Hanford at Rainier) CSO. The
Hanford #1 CSO serves an area of about 4,800 acres7 of industrial and commercial land. Overflows from this
system discharge to the Diagonal Ave S CSO/SD via King County’s regulator station located at 8th Ave S and
S Hanford St. Annual overflows from the King County Hanford #1 CSO to the City’s Diagonal Ave S CSO/SD for
2014‐2018 ranged from a minimum of 24,557,000 gallons in 2018 to a maximum 78,288,000 gallons in 2014 and
averaged 57,414,00 gallons per year (King County 2015 through King County 2019). Control of the Hanford #1
6
http://www.seattle.gov/util/EnvironmentConservation/Projects/SewageOverflowPrevention/IntegratedPlan/index.htm
7
Total area served by the combined sewer. Includes about 1,500 acres that drain to the combined sewer in this area (Phillips 2013).
City of Seattle 7 March 29, 2020
LDW 2021 ‐ 2026 Source Control PlanCSO is addressed in King County’s CSO control plan. For further information, see King County’s website at
http://www.kingcounty.gov/environment/wastewater/CSO/Library/PlanUpdates.aspx.
2.1.3. Emergency Overflows
Seattle operates three emergency overflows on sanitary pump stations in the LDW. As explained above, EOFs
are relief points on sanitary force mains to prevent sewer backups should the pump fail, or a blockage occur in
the line. These discharges are regulated as sanitary sewer overflows (SSO). SPU is required to submit an
Environmental Incident Report Form to Ecology’s Environmental Report Tracking System (ERTS) for any sanitary
sewer overflow immediately after the time the City becomes aware of the discharge, has assessed the situation,
taken appropriate steps to control the discharge, and submit a letter report to Ecology within five business days.
The report describes 1) the reason for the discharge, 2) date and duration of the discharge, 3) estimated time
the discharge is expected to continue if it has not been corrected, 4) estimated discharge volume, and 5) steps
taken or planned to reduce, eliminate, or prevent future occurrences. Records from 2009‐2019 indicate that
EOFs occur infrequently (Table 4).
Table 4: Emergency overflow records.
Pump Outfall Reported EOFs
Station Date Duration Volume
(hrs) (gallons)
17 Norfolk CSO/PS17 EOF/SD 12/12/10a 6.8 1,300,000b
17 Norfolk CSO/PS17 EOF/SD 02/19/17 c 5.2 47,075
44 KCIA SD#2/PS44 EOF 12/12/10a 4.4 72,000
45/78d KCIA SD#2/PS45 EOF ‐‐ ‐‐ ‐‐
45 KCIA SD#2/PS44 EOF 02/19/17 0.2 100
NAe 7966 Perimeter Rd S 09/19/19 68 320,000
a. Seattle rain gauges recorded a 50‐ to 100‐year event on December 11‐12, 2010. Under these conditions, inflow
and infiltration can overwhelm the capacity of the sewer system, because City systems are not designed to handle
this size storm event.
b. Worst case estimate. No evidence that duckbill valve opened to allow flow from the sanitary sewer to discharge to
the storm drain. SPU crews did not observe any evidence of sewage in the ditch downstream of the duckbill valve
(e.g., toilet paper, rags).
c. Pump station capacity exceeded
d. PS78 overflows to PS45.
e. Overflow occurred at MH 072‐037 due to blockage in sanitary sewer line caused by vandals (plywood dumped in
maintenance hole). Sewage flowed down ditch and entered KCIA SD #1 drainage system. SPU removed
approximately 3,000 gallons of sewage from ditch and surface soil from about 800 feet of ditch.
3. BUSINESS INSPECTION PROGRAM
SPU inspects businesses in the LDW to ensure that they are complying with City Stormwater Code requirements
for pollution prevention. During the current reporting period, SPU conducted nearly 1,300 inspections at 655
businesses in the LDW.8 Inspection locations are shown on Maps 31‐54. A list of businesses inspected is
provided in Appendix G.
8 Inspection numbers exceed business numbers because businesses may be inspected more than once during an inspection cycle to
achieve compliance with Seattle Stormwater Code.
City of Seattle 8 March 29, 2020
LDW 2021 ‐ 2026 Source Control PlanA detailed description of SPU’s inspection program is provided in Appendix A. Improvements made over the
past 5 years are summarized below:
New database. In 2018, SPU converted to a new database based on the Microsoft Dynamics platform,
which is now available to inspectors in the field on mobile tablet computers via a secure server
connection. The database is also accessible on smartphone via the Resco Cloud platform. It merges
records from the previously separate business inspection, spill response, water quality complaint, and
stormwater facility inspection databases into a single integrated repository, which improves information
sharing and allows inspectors to be better prepared with a full history of business’ past performance
across multiple disciplines.
Messaging. Inspectors were trained to emphasize the required corrective actions and the enforcement
process, which improved the rate and pace of business compliance.
Re‐inspections. When possible, inspectors attempt to create a re‐inspection appointment during the
initial inspection meeting. This practice reinforces the concept of the compliance deadline and improves
compliance rate.
Shortened enforcement process. The enforcement process has been modified by removing the
“Second and Final” letter. Enforcement now transitions to a Notice of Violation with a suspended
penalty immediately following the first re‐inspection.
Technical assistance. Inspectors have improved business compliance through increased dissemination
of best management practice literature as enclosures or attachments in corrective action letters.
Inspection checklist. To improve inspector efficiency, the checklist was modified to focus on violations
of the City of Seattle Stormwater code and related best management practices. Information related to
hazardous waste, vehicle use, industrial wastewater, and other elements of the business that did not
directly relate to the business inspection process was eliminated from the checklist.
CORRECTIVE ACTIONS
When inspectors find problems, they require businesses to implement corrective actions. With the 2019
changes to the data base, corrective actions are now tied directly to the BMP requirements in the City
Stormwater Manual. Prior to 2019, SPU tracked 26 different corrective actions in the Business Inspection
Database. The new database tracks 87 corrective actions. See Appendix L for a list of corrective actions that
SPU currently tracks.
To enable comparison between SCIP 1 and SCIP 2, corrective actions have been organized by BMP in Table 5. As
of June 30, 2019, inspectors have found problems that required corrective actions at 1,042 of the over 1,700
businesses inspected.9 Approximately 40 percent of the 7,175 corrective actions required between 2003 and
2019 were associated with spill control and cleanup practices. Twenty‐three percent were associated with
stormwater practices, such as cleaning and mapping onsite drainage systems or illicit connections/discharges.
Table 5: Summary of corrective actions.
Corrective Action Category 2003 ‐ 2014 2014 ‐ 2019
Spill plan 15% 14%
Clean onsite catch basins 10% 14%
Spill kit 12% 10%
Stormwater and spill response training 11% 11%
Referral to partner agency 11% 10%
9 Includes business located in the combined sewer basin.
City of Seattle 9 March 29, 2020
LDW 2021 ‐ 2026 Source Control PlanCorrective Action Category 2003 ‐ 2014 2014 ‐ 2019
Illicit connection, prohibited discharge 9% 6%
Spill cleanup 3% 3%
Container storage 7% 7%
Perform routine site maintenance 6% 7%
Solid waste storage 6% 0.6%
Repair, map, or install drainage infrastructure 3% 7%
Cleaning and washing 3% 3%
Storage of leachable or erodible materials 2% 5%
Equipment and vehicle repair 1% 1%
Material transfer / loading/ unloading 1% 0.5%
Vehicle and equipment fueling 0.5% 1%
3.1.1. Notices of Violation
From 2014 to 2019, SPU issued 49 Notices of Violation (NOV) to businesses in the LDW (see Appendix H). Most
NOVs (25) were associated with illicit connections and/or discharges followed by failure to implement
appropriate BMPs (15), broken or clogged side sewer (8), and failure to report spill (3). SPU started issuing
monetary penalties in 2009. Penalties are often suspended if the business corrects the problem within the
specified time period. During this reporting period, penalties were suspended for 34 of the NOVs. Penalties
ranged from $500 to $4,500.
3.1.2. Referrals
From 2014 to 2019, SPU referred 85 sites to other agencies or other City Departments for follow‐up. If there are
hazardous waste handling, labelling, or disposal issues, the site is referred to King County Hazardous Waste
program (small quantity generators) or Ecology (large quantity generators). If there are industrial waste issues
(e.g., process waste being discharged to the sanitary or combined sewer), the site is referred to King County
Industrial Waste program.
A list of referrals in provided in Appendix I. Referrals are summarized by agency below:
King County Hazardous Waste ................................................................. 8
King County Industrial Waste ................................................................. 20
Ecology Hazardous Waste Program ......................................................... 5
Ecology Water Quality Program ............................................................. 24
Other City Department/SPU Division ..................................................... 21
Other Agency ............................................................................................ 7
It is difficult to track status once a site has been referred to another agency. SPU typically only tracks progress of
those sites referred to another City department or another division within SPU.
4. SOURCE TRACING/SAMPLING PROGRAM
This section describes the City’s sampling efforts to identify and characterize sources of contaminants
discharged to and from the City‐owned drainage system. SPU conducts source tracing to determine the extent
and location of contaminants within the drainage system. Sampling is designed to identify sources by sampling
at key locations within these systems. Sampling generally starts at the downstream end of the system or at key
junctions within the system and systematically moves upstream to identify sources. In addition, inspectors also
City of Seattle 10 March 29, 2020
LDW 2021 ‐ 2026 Source Control Plancollect samples from catch basins on private property during business inspections if problems or unusual
conditions are encountered during the inspection. SPU refers to these as “private onsite catch basin” samples.
Data generated by the sampling program are used to:
Identify sources of contaminants to the City‐owned MS4
Characterize the quality of storm drain solids discharged to the LDW for use in recontamination analyses
Identify and prioritize City‐owned MS4 sections for cleaning.
Source tracing is an iterative process and although fairly straightforward, in practice it can be difficult to locate
individual sources. Tracing works best when contaminants associated with a site are significantly elevated and
the site discharges into a relatively flat section of pipe where material can accumulate.
A detailed description of SPU’s source tracing program is provided in Appendix A.
2014‐2019 PROGRESS
4.1.1. Source Tracing
Between July 1, 2014 and June 30, 2019, SPU collected 370 source tracing samples from 22 storm drains in the
LDW drainage basin. Samples were collected in 14 of the 17 city‐owned outfalls and 8 of the other 15 outfalls
used by the Seattle plus four other outfalls in the LDW (Table 6). Sample locations are shown on Maps 55‐79.
Box plots of the sample results for select chemicals are provided in Appendix B. A detailed description of the
source tracing results for each major drainage basin discharging to outfalls either owned by or used to discharge
stormwater and/or wastewater from City‐owned systems is provided in Appendix C and a summary of the
specific sources identified to date is provided in Appendix D.
Table 6: Summary of source tracing samples collected in the LDW (July 2014 through June 2019).
City‐owned outfalls Sample Type Other outfallsb Sample Type
Upper Reach
17th Ave S SD Trap, inline, ODS, CB 16th Ave S SD (east) Inline
Duwamish substation SDsa Inline, CB KCIA SD #1 Inline
S Norfolk St CSO/PS17 EOF/SD Trap, inline, CB, ODS
I5 SD at S Ryan St Nonec
16th Ave S SD (west) None
S 96th St SD Inline
W Marginal Pl S SDa Inline
City‐owned outfalls Sample Type Other outfallsb Sample Type
Middle Reach
1st Ave S SD (east) Inline Head of Slip 2 SD Inline
S River St SD Inline, CB, ODS S Garden St SD None
S Brighton St SD Inline, CB, ODS I5 SD at Slip 4 Trap, inline
S Myrtle St SD Trap, inline, CB 1st Ave S SD (west) Trap, inline, CB, ODS
Georgetown SD Inline 2nd Ave S SD CB
SW Kenny St SD/T115 CSO Trap
City of Seattle 11 March 29, 2020
LDW 2021 ‐ 2026 Source Control PlanHighland Park Wy SW SD Trap, inline, CB
S Webster St SD CB
7th Ave S SD Trap, inline, CB, ODS
City‐owned outfalls Sample Type Other outfallsb Sample Type
Lower Reach
S Nevada St SD Inline, CB Diagonal Ave S SD None
Diagonal Ave S CSO/SD Trap, inline, CB
SW Dakota St SD Inline
SW Idaho St SD Trap, CB
Note: Outfalls are listed in order from upstream end of the waterway to downstream end of the waterway starting
with outfalls located on the east side followed by those on the west side of the waterway
Trap = inline sediment trap, CB = catch basin grab sample, inline = inline grab sample
ODS = outside drainage system (e.g.., soil or street dirt, and other materials such as paint or caulk)
a. Samples collected by Ecology (Leidos 2015) in Duwamish Substation SD#2 and #3 plus W Marginal Pl SD
b. Receives discharges from City‐owned stormwater and/or wastewater collection systems.
c. Sampling attempted, but not enough sediment present for chemical analysis.
Sample counts by sample type are summarized in Table 7.
Table 7: Source tracing sample counts by sample type (July 2014 through June 2019).
Sample Type Count
Sediment trap 124
Inline grab 91
Private onsite catch basin grab 104
Right‐of‐way catch basin grab 51
Soil/street dirt 40
Total 410
In 2014‐2019, SPU installed new traps at 6 locations (Table 8). Traps were installed to provide near end‐of‐pipe
data for future sufficiency analyses or to support source tracing efforts.
Table 8: New traps installed 2014‐2019.
Reach Year Number Storm Drain Purpose
Long term Sediment Source
monitoringa trap pilot tracing
Upper 2017 1 17th Ave S SD X
Middle 2016 1 S Myrtle St SDb X X
Middle 2016 1 Diagonal Ave S CSO/SDb X
Middle 2018 3 Diagonal Ave S CSO/SD X
a. Traps installed near the downstream end of the system to support long term monitoring/source control sufficiency
evaluation.
b. Modified‐Norton (SPU’s old trap), Portland’s SIFT, Hamlin, and 2 versions of SPU’s lower profile bowl‐style trap installed
at two field test locations in 2016. Traps were retrieved in 2017, 2018, and 2019. The 2017 samples were analyzed for
City of Seattle 12 March 29, 2020
LDW 2021 ‐ 2026 Source Control Plangrain size. The 2018 and 2019 samples were analyzed for chemistry and grain size when there was enough material.
SPU plans to retrieve these sediment traps in 2020 to compare trap style performance. After 2020, the traps in
Diagonal Ave S CSO/SD will be removed and the traps in S Myrtle St SD will be replaced by a single trap to evaluate
contributions to the LDW over the long term.
SPU currently maintains sediment traps at 28 locations in 10 of the major storm drains discharging to the LDW
to monitor the quality of solids discharged to the LDW and in larger basins where multiple traps are installed, to
isolate contributions from major sub‐basins contributing to the outfall . Trap installations are summarized in
Table 9 and shown on Map 87.
Table 9: Sediment traps maintained by SPU in the LDW.
Storm drain Trap Type No. of traps Year Installed Last sampled
by SPU
Upper Reach
17th Ave S SD Modified‐Norton 1 2017 May 2019
S Norfolk St CSO/PS17 EOF/SD Modified‐Norton 5 2007 April 2019
Middle Reach
S Myrtle St SD a 1 2016 May 2019
I5 SD at Slip 4 Modified‐Norton 1 2005 April 2019
SW Kenny St SD/T115 CSO Modified‐Norton 1 2008 April 2019
Highland Park Wy SW SD Modified‐Norton 2 2008 April 2019
1st Ave S SD (west) Modified‐Norton 5 2008 April 2019
7th Ave S SD Modified‐Norton 3 2008 April 2019
Lower Reach
Diagonal Ave S CSO/SD a 6 2003‐2016 April 2019
SW Idaho St SD Modified‐Norton 3 2008 April 2019
Total 28
a. Sediment trap pilot test location. Modified‐Norton, SIFT, Hamlin, and SPU’s new bowl style traps are installed in
the two most downstream maintenance holes in the S Myrtle St SD and at Airport Wy S and S Spokane St in the
Diagonal Ave S CSO/SD.
OVERVIEW BY CHEMICALS FOUND IN STORM DRAIN SOLIDS SAMPLES (2003 – 2019)
This section summarizes results of SPU source tracing efforts in the City MS4 for the entire period of record
(2003‐2019). Data analysis focuses on results for the following chemicals of concern in waterway sediment and
chemicals commonly found in storm drain solids samples collected from the City MS4 and from catch basins on
private property that drain to the MS4.
Arsenic Bis(2‐ethylhexyl) phthalate (BEHP)
Copper Low molecular weight polycyclic aromatic hydrocarbons (LPAH)
Lead High molecular weight polycyclic aromatic hydrocarbons (HPAH)
Mercury Polychlorinated biphenyls (PCBs)
Zinc Carcinogenic polycyclic aromatic hydrocarbons (cPAH).
LPAH = Sum of acenaphthene, acenaphthylene, anthracene, anthracene, fluorene, naphthalene,
and phenanthrene.
City of Seattle 13 March 29, 2020
LDW 2021 ‐ 2026 Source Control PlanYou can also read