Liverpool City Region Housing Strategy - 2nd Working Draft February 2007 - Meetings, agendas ...
←
→
Page content transcription
If your browser does not render page correctly, please read the page content below
Liverpool City Region Housing
Strategy
2nd Working Draft
February 2007

nd
Liverpool City Region Housing Strategy   2 Draft

Contents

1    Preface                                   2

2    Introduction                              3

3    Strategic Policy Context                  11

4    The Evidence Base                         14

5    Vulnerable Housing Markets                39

6    The Vision and Objectives                 42

7    Spatial Framework                         45

8    Strategic Enablers of Change              50

9    Monitoring Framework                      73

February 2007
nd
Liverpool City Region Housing Strategy                                                               2 Draft

1        Preface
1.1      The Liverpool City Region Housing Strategy is a major piece of work, funded by the
         Department for Communities and Local Government, which will provide an investment
         framework for future housing development across the city region. The work is being led
         by a steering group drawn from all of the city region’s local authorities, and the Strategy is
         being prepared by a consortium of consultants led by GVA Grimley LLP.

1.2      The Liverpool City Region Housing Strategy will provide a framework for housing
         investment to support regeneration and economic growth in the City Region. It will
         provide context for Local Development Frameworks, future reviews of Regional Spatial
         Strategy and Regional Economic Strategy. It also addresses the demands of recent and
         emerging housing, planning and economic policy developments, notable recent Planning
         Policy Statement 3, the Barker Review of Land Use Planning, and the Northern Way
         Growth Strategy. It is a key element of the Liverpool City Region Development
         Programme, helping to deliver the Sustainable Communities element of the CRDP.

1.3      The first phase of work was carried out in 2005-06 by Ecotec, which defined the three
         housing markets within the City Region. These were defined on the basis of travel-to-
         work patterns, demographic information and housing market conditions. There is some
         overlap between the areas. The first phase of the project also provided a large amount of
         information and evidence – economic, social and so on – which prepared the ground for
         the second phase – the preparation of the Strategy itself.

         A Note on the “Working Draft” Housing Strategy

1.4      This is a working draft of the Housing Strategy. It is intended to share key evidence and
         suggested policy responses. This document will be the basis for consultation with
         partners in March 2007. Feedback from partners will then be incorporated and the
         Housing Strategy refined for its launch in April 2007.

February 2007                                        2
nd
Liverpool City Region Housing Strategy                                                              2 Draft

2        Introduction
2.1      Partners across the Liverpool City Region have been working collaboratively to fully
         understand the way in which their housing markets work, interact and complement one
         another. The City Region has set out its economic growth plans in the City Region
         Development Plan (CRDP). These plans will build upon recent economic successes,
         exploit competitive advantages and put in place the strategic infrastructure that is
         required to sustain growth.

2.2      The City Region authorities have jointly agreed a response to the Draft Regional Spatial
         Strategy which details a sustainable level of housing supply at a local level in order to
         regenerate the most vulnerable parts of the City Region and grow the housing market in
         a sustainable way.

2.3      Recent changes in the economy and demographics of the City Region have added
         impetus to the need to jointly understand and plan for the right choice of housing in the
         right locations. At the same time, Planning Policy Statement 3 (PPS3) has reinforced the
         need to undertake “strategic” housing market assessments as a basis for planning for a
         balanced growth in functional market areas.

2.4      These are not insignificant drivers of change. The City Region authorities and their
         partners have therefore worked collaboratively to devise a Housing Strategy that
         responds to the opportunities and challenges that are likely to arise from the growth of
         the City Region’s economy. The Strategy is informed by a series of strategic “Housing
         Market Assessments” covering all local authorities within the City Region.

2.5      It is worthy to note that this is the first City Regional Housing Strategy to be prepared and
         represents joint working and a shared vision between thirteen local authorities and a
         range of stakeholder groups.

         The Vision

2.6      The City Region Housing Strategy aims to secure balanced housing markets which will
         meet locally defined needs and provide a choice of housing and neighbourhoods that will
         underpin economic growth. Integral to this vision is a focus on growth of the City Region’s
         economic assets and the ways in which the housing can reinforce their growth while at
         the same time redressing disparities in socio-economic conditions.

2.7      The City Region’s principal economic assets are:

February 2007                                        3
nd
Liverpool City Region Housing Strategy                                                                2 Draft

         •      Liverpool City Centre - a Regional Centre;

         •      Liverpool John Lennon Airport and the Merseyside Ports, in particular the Port of
                Liverpool - regional and national gateways and generators of economic activity;

         •      The Strategic Investment Areas (SIAs) and Economic Development Zones (EDZs);
                and

         •      The West Cheshire / North East Wales sub-region – with specific reference to
                Chester as a driver of City Region Growth.

2.8      This vision builds on the economic rationale and strategy contained in the Liverpool City
         Region Development Plan. The CRDP aims to provide the type of housing in the range of
         neighbourhoods which will enable realisation of its economic vision. Its vision is set out
         below:

             “Our Vision is to regain our status as a premier European city region by 2025. We will
          secure an internationally competitive economy and cultural offer; and outstanding quality
                of life; and vibrant communities contributing to and sharing in sustainable wealth
                                                    creation.”

2.9      This Housing Strategy represents a long-term approach to creating balanced housing
         markets. At its heart are long-term population and economic forecasts which suggest
         where it is necessary to restructure parts of the City Region’s housing market and the
         type of housing which is required to sustain economic growth

2.10     The Housing Strategy sets out how the authorities and their partners will focus policy,
         resources and partnership activity to secure a mutually reinforcing economy and housing
         markets within the City Region.

         The Make-up of the City Region

2.11     The Liverpool City Region is home to two million people and as such forms a major part
         of the Northwest’s regional labour market, business base, housing stock and culture.

2.12     The City Region consists of thirteen local authorities, inclusive of the New Heartlands
         HMRI Pathfinder area. It incorporates the local authorities of Liverpool, Knowsley, Sefton,

February 2007                                         4
nd
Liverpool City Region Housing Strategy                                                         2 Draft

         St Helens, Wirral, Halton, Ellesmere Port and Neston, West Lancashire, Chester, part of
         Vale Royal, and the Welsh authorities of Wrexham and Flintshire. Warrington is located
         both in the Liverpool and Manchester City Regions, however it forms an integral part of
         the economic and housing offer of the Liverpool City Region and as such is considered
         constituent.

2.13     The City Region has at its core the City of Liverpool, a Regional Centre for retail,
         commercial, tourism and leisure. In the south the West Cheshire / North East Wales sub-
         region, centred on Chester, is also a key area for economic growth and tourism. In the
         east, Warrington has developed a role as a centre for service, logistics and
         manufacturing industries, taking advantage of its strategic location at a major motorway
         intersection and the nexus of the West Coast Mainline and Trans-Pennine rail routes. A

February 2007                                     5
nd
Liverpool City Region Housing Strategy                                                             2 Draft

         number of other settlements across the city region provide employment as well as more
         localised retail, community and leisure facilities.

2.14     All are linked in terms of household movements, travel to work, leisure and shopping
         areas. For the purposes of this Strategy, three functional housing market areas have
         been identified. They are:

         •      The Northern Housing Market Area

         •      The Southern Housing Market Area

         •      The Eastern Housing Market Area

2.15     The Housing Strategy articulates the policy, partnership and resource commitments that
         are required in order for each of these functional market areas to become appropriately
         balanced and sufficiently appealing to underpin economic growth.

         The Overarching Challenges

2.16     The City Region is pursuing an aggressive programme of economic development through
         its City Region Development Plan. Following the delivery of a series of high-impact
         business and transport related projects it is estimated that an additional 48,000 jobs will
         be created. This unprecedented level of economic growth offers a tangible opportunity to
         create sustainable communities, to address social exclusion, worklessness and areas of
         entrenched economic disadvantage. Household demand resulting from this level of
         growth is estimated to be over 115,000 across the City Region.

2.17     However, in order to capture the full benefits of economic and household growth and to
         channel this to drive regeneration, the City Region has to address some fundamental
         issues in relation to its housing stock, neighbourhood quality and affordability. In several
         areas, authorities need to respond jointly to overcome local capacity constraints that
         might cause displacement of demand outside the City Region if left unaddressed. It is this
         level of strategic choices and decisions that the Housing Strategy aims to inform and
         provide policy recommendations to.

2.18     The overarching housing challenges relating to each market area are set out below along
         with reasoned justification for their inclusion in the Strategy:

February 2007                                         6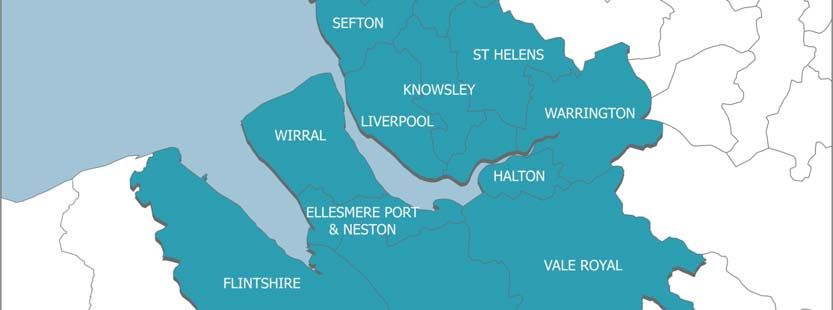
nd
Liverpool City Region Housing Strategy                                                                2 Draft

         •      In the Northern Housing Market Area (Halton, Knowsley, Liverpool, St. Helens,
                Sefton, West Lancashire and Wirral), the key challenges are ones of securing
                economic growth, facilitating physical renewal (particularly housing market renewal
                through the 15 year NewHeartlands programme), and securing social inclusion.

         Justification - The Northern Housing Market Area has the greatest potential for
         economic growth in the City Region, containing a critical mass of economic assets which
         under the CRDP will generate employment and GVA growth. However it also faces the
         most acute market renewal issues and unparalleled concentrations of multiple
         deprivation. Significant areas of its housing stock are fundamentally out of balance with
         current and emerging household needs, demands and aspirations. Many of its
         neighbourhoods are severely blighted by poor environmental quality and even poorer
         quality of life for its residents. The perceptual effects are not just localised but stigmatise
         large areas of the Northern Market Area.

         Without intervention to address these impediments, the full benefits of economic growth
         will not be captured within the Northern Area. The potential to harness growth to address
         socio-economic disparities will be diluted and the gap between affluent and deprived
         neighbourhoods will effectively widen. This Strategy therefore recognises the economic
         driver that the Northern Area has the potential to become, but also the imperative need
         for a prioritisation of measures to address its market renewal issues. These are issues of
         significance for the whole of the City Region.

         •      In the Southern Market Area the challenges are focused on supporting continued
                economic growth in a sustainable manner, and addressing the twin issues of housing
                affordability and choice.

         Justification – The Southern Market Area, focused on Chester, is an important
         economic driver in its own right. It is not only attractive to businesses but also offers a
         good balance of housing types that are likely to appeal to households in sectors of the
         economy which are forecast to grow. The Southern Market Area also appeals due to the
         quality of its neighbourhoods, attractive environment and the unrivalled quality of life that
         it offers.

February 2007                                         7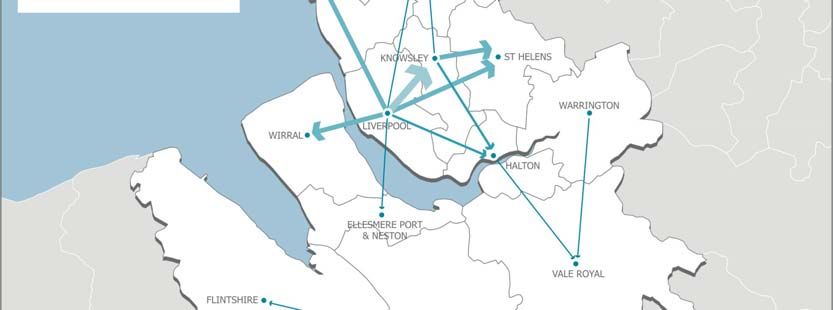
nd
Liverpool City Region Housing Strategy                                                           2 Draft

         This positive role played by the Southern Market Area is counterbalanced by apparent
         and emerging disparities in relation to affordable housing. While the area’s housing stock
         offers a range of house types, its stock of social rented housing is relatively small.
         Average house prices, and lowest quartile prices, have risen to a level which is
         inaccessible to many current and prospective households. Policy interventions have
         started to address the provision of affordable stock as a major component of new
         development, however new units have been focused on single person and small family
         accommodation. The Southern Market Area effectively lacks a ladder of affordable
         accommodation catering for different stages in the household life-cycle.

         Coupled with this imbalance, Chester faces environmental and Green Belt policy issues
         which limit its potential to accommodate its own economic growth in a sustainable
         manner. Increasingly the market has provided housing across the national border and
         travel to work and migration links with the North East Wales authorities have
         strengthened.

         The North East Wales authorities face regeneration issues associated with settlements
         along the Flintshire Coast and Dee Estuary. Affordability is becoming a more urgent issue
         as housing demand has progressively migrated across the border due to property “hot
         spots” in Cheshire.

         In order for the area to continue to contribute to City Region economic growth,
         collaborative working is required between local authorities to plan for an appropriate
         supply of housing and to prioritise supply of a range of affordable accommodation. This
         Strategy is structured to respond to these challenges.

         •      In the Eastern Market Area the challenges are similar to the Southern Area, with an
                emphasis upon local authorities acting collaboratively to sustain and accommodate
                economic growth. However discrete neighbourhoods within the Eastern Area also
                face challenges of urban renewal and social inclusion.

         Justification – Warrington has effectively capitalised on its strategic location at the
         intersection of national road and rail networks and has attracted businesses in logistics,
         distribution and manufacturing industries. It has also developed an “out of town” business
         park economy with major office occupiers present. In the past this has led to levels of

February 2007                                         8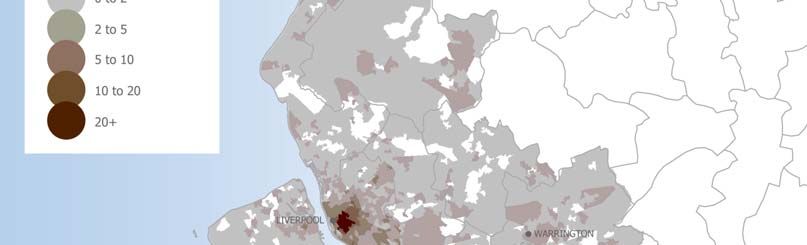
nd
Liverpool City Region Housing Strategy                                                              2 Draft

         economic growth which have reinforced travel to work links with its adjacent authorities
         and spurred population growth. Warrington is functionally linked to St Helens, Halton and
         Vale Royal local authorities in labour market and housing terms, however its economy is
         a clear driving force in the Eastern Market Area.

         Warrington is forecast to post continued economic growth, not least due to major
         (regional level) projects such as the Omega employment site and investment in the town
         centre retail offer.      However it faces land constraints in accommodating associated
         household growth. Joint authority will become increasingly important, in particular with St
         Helens and Halton, in order to accommodate future growth in a sustainable manner.

         The Priorities

2.19     Four priorities have been identified in planning for the City Region’s housing markets.
         These priorities have been confirmed by a strategic Housing Market Assessment
         prepared for each of the three market areas. The priorities at City Regional level are:

         •      To grow critical mass in the economy and population as a sustainable basis for
                housing markets;

         •      To tackle housing market failure - with specific reference to the inner urban areas of
                the City Region covered by NewHeartlands;

         •      To balance housing markets and offer a choice of accommodation in a range of
                tenures

         •      In balancing housing markets, to plan for affordable housing requirements – with
                particular emphasis on developing a range of “move-on” accommodation in the
                Southern Market Area; and

         •      To devise joint strategic approaches sustainable neighbourhoods and communities.

2.20     These priorities have helped to shape the Housing Strategy.

         The Shape of the Strategy

February 2007                                         9
nd
Liverpool City Region Housing Strategy 2 Draft
LIVERPOOL CITY REGION HOUSING STRATEGY
2.21 The Housing
Northern HMA
Strategy has been
1. Vision
informed by three
2. Objectives
strategic Housing Market
Eastern HMA 3. Spatial Framework
4. Strategic Enablers Assessments, an analysis
5. Delivery Framework of BME/ Gypsy and
Southern HMA traveller household needs
and an assessment of
BME Vulnerable Markets vulnerable housing
Analysis
markets.
2.22 The Strategy is made up of the following parts:
• A vision which is consistent with the Liverpool City Region Development Plan.
• A series of objectives that relate to the challenges and opportunities highlighted by
the housing market assessments.;
• A spatial framework provides a settlement hierarchy and guidance in relation to the
location of priority interventions in the housing market;
• A series of 7 “Strategic Enablers” which suggest the ways in which partners should
intervene individually and collectively; and
• A delivery framework which identifies the partnership and policy actions that need to
be pursued.
2.23 Before the Strategy is introduced, the next sections briefly review the policy context and
provide a summary of evidence from the housing market assessments.
February 2007 10nd
Liverpool City Region Housing Strategy 2 Draft
3 Strategic Policy Context
Planning Policy Statement 3 (PPS3)
3.1 PPS3 was launched in November 2006 and represents a key part of the Government’s
guidance on the creation of sustainable communities. Within the strategic housing policy
objectives of PPS3 the Government’s key housing policy goal is stated as,
“…to ensure that everyone has the opportunity of living in a decent home which they can
afford, in a community where they want to live”
3.2 In order to achieve this goal the Government is seeking:
• To achieve a wide choice of quality homes, both affordable and market housing
• To widen opportunities for home ownership and ensure high quality housing for those
who cannot afford market housing, in particular those who are vulnerable or in need
• To improve affordability across the housing market, including by increasing the
supply of housing
• To create sustainable, inclusive, mixed income communities in all areas, both rural
and urban.
3.3 PPS3 sets a requirement for multi-authority working and recommends the preparation of
strategic housing market assessments to cover functional market areas. This Housing
Strategy has been prepared using the terms of reference set by PPS3.
3.4 The Sustainable Communities Plan released in 2003 emphasised the government’s
priorities with regard to regeneration and planning with its primary concerns being;
sustainable development, housing and urban design issues. Importantly, the plan
contained a package of measures to address the undersupply of housing in the south
east and low demand in many other areas, predominantly the north.
3.5 Building on this Plan two complementary 5 year plans were released in 2005 which
together comprise the second phase of the sustainable communities delivery strategy:
Sustainable Communities Homes for All and Sustainable Communities People,
Places and Prosperity.
February 2007 11nd
Liverpool City Region Housing Strategy 2 Draft
3.6 The Northern Way was launched in February 2004 as part of the Sustainable
Communities Plan. It aimed to address the £30 billion productivity gap between the North
and South of England by maximising the opportunities for growth across the three
northern regions (North West, the North East and Yorkshire and the Humber). The three
northern RDAs have been charged with developing a “growth and jobs corridor” between
Newcastle, Hull and Liverpool, complementing existing work being taken forward under
the Sustainable Communities Plan, in order to raise the economic performance of the
north.
3.7 The outcome of this has been the Northern Way Growth Strategy, launched in
September 2004. This identifies 8 city regions, the Liverpool City Region being one, for
which City Regional Development Programmes (CRDP) were subsequently produced
in 2005. The city region concept is embedded in sub-regional working and has helped to
foster greater understanding and collaboration across real economic geographies.
Irrespective of the future development of the Northern Way, its partnership benefits will
be a positive legacy.
3.8 The Northern Way Action Plan produced in 2005 identified the Liverpool City Region
as a distinctive seaboard urban area, with a unique waterfront location which is
undergoing a phase of recovery and re-inventing itself for the 21st century.
3.9 A programme of research has been conducted to support the Northern Way with two key
research papers released: Locating Homes in the Right Places and Quality of Place
and the North’s Residential Offer. These have provided further evidence and
arguments for the need to ensure that investment in housing is targeted to remove
constraints on economic growth potential whilst also raising the importance of the
‘residential offer’ and the range of influences which affect this offer. These papers
reinforce the need to understand the relationship between economic performance, the
residential offer and housing markets. They also call for complementarity between
economic, spatial planning and housing policy and investment frameworks.
The Regional Housing Strategy
3.10 The Regional Housing Strategy (RHS) was produced by the North West Regional
Housing Board in 2005. Its core aim of delivering a housing offer that promotes and
sustains maximum economic growth within the region fits with wider national strategy and
the Northern Way. Emphasis is placed on creating balanced housing markets and
sustainable communities with delivery of affordable housing and tackling areas of poor
quality and low demand housing at its core.
February 2007 12nd
Liverpool City Region Housing Strategy 2 Draft
3.11 The Strategy notes that the housing market in the North West has clearly entered a
phase of change with prices rising rapidly. Significantly, prices have not risen uniformly
across the city region with higher priced areas experiencing the greatest increases
meaning that the gap between higher and lower priced areas have widened.
3.12 In order to differentiate housing markets within the region the Regional Housing Strategy
identifies seven broad housing market typologies. In terms of the Liverpool City Region
designation, central Merseyside is classed as being an “unbalanced market” with much of
the area requiring market renewal, however, a thriving city centre market is also
identified. Warrington forms part of an arc stretching to Bury which is classed along with
West Lancashire (excluding Skelmesdale) as a balanced housing market. Skelmersdale’s
market is deemed one of low value with potential and Chester is classed as a buoyant
area with ‘high value/potential’.
3.13 Within the City Region the Regional Housing Strategy sets priorities which focus on
urban regeneration across much of the sub-region, including stock renewal and
replacement and improved tenure mix. The Strategy acknowledges that more radical
measures may be required in Skelmesdale and that complementary planning polices that
recognise the inter-relationship between the neighbourhoods experiencing low demand
and those with potential growth will be crucial to the success of the NewHeartlands
Pathfinder area.
Summary
3.14 There is strong level of policy support for the development and implementation of this
Housing Strategy. It will deliver under the guidelines of the recent PPS3, will provide an
essential contribution to the City Region’s economic growth agenda and will also help to
create sustainable communities.
3.15 In the next section the evidence base informing the Strategy is summarised.
February 2007 13nd
Liverpool City Region Housing Strategy 2 Draft
4 The Evidence Base
4.1 The Housing Strategy draws its evidence from three strategic Housing Market
Assessments (HMAs). These are documents which profile the population and
demographic trends, the existing stock of housing and how effectively it is meeting
current needs, and also provide a basis for thinking about what kind of stock is required
in the future to meet emerging demands.
4.2 These housing market assessments have been prepared to reflect the boundaries of
“functional housing markets” or areas which share common characteristics and sets of
relationships.
4.3 Information from the Housing Market Assessments and econometric forecasts have been
used within a model which predicts household demand, broad tenure split (open market/
affordable housing) and likely trends in demand for different house types.
4.4 The findings of these HMAs have been verified in consultation with local authorities and
their partners during a programme of consultation spanning November 2006 to March
2007.
4.5 In addition, bespoke research has been undertaken in relation to the following issues of
strategic importance to the City Region:
• Vulnerable Housing Markets – examining and mapping the vulnerability of areas
against an index of housing, quality of place, quality of life and socio-economic
factors; and
• BME/ Gypsy Traveller Housing Needs – a review of the challenges and responses at
the City Region level.
4.6 This provides an unprecedented level of intelligence with regard to the defining
characteristics and future direction of housing markets within the Liverpool City Region.
The research programme is also consistent with the cross boundary approach
recommended by Planning Policy Statement 3 (PPS3). However, while the Housing
Market Assessments serve to provide headline housing demand figures for the City
Region, functional market areas and local authorities, the detail of an appropriate balance
February 2007 14nd
Liverpool City Region Housing Strategy 2 Draft
between tenures and mix of house types is something that has to be determined by
individual local authorities at a lower level.
4.7 The purpose of this section is to outline:
• The Defining Characteristics of each market area;
• The Key Drivers of each market area;
• Future Economic Drivers;
• Future Demographic Drivers;
• A summary of BME and the Gypsy/ Traveller research
Defining Characteristics of the Housing Markets
4.8 The strategic HMAs applied a series of five thematic tests in order to define housing
markets and their relationships to one another. Patterns of movement were examined,
including analysis of travel to work and migration data over time. The role and function of
areas was examined in relation to shopping, employment and educational catchments.
Socio-economic and neighbourhood characteristics were analysed and mapped and
differences in house prices were examined.
4.9 These tests conclusively proved the existence of three functional housing market
areas showing high levels of “functional integrity” or shared characteristics. These are
considered to be the right areas at which to be planning for a balance of house types and
tenures.
4.10 Patterns of net migration between the City Region’s authorities provide an illustration of
the functionality of each housing market as the following diagram illustrates:
February 2007 15nd
Liverpool City Region Housing Strategy 2 Draft
4.11 The migration patterns demonstrate three functional market areas focused upon
Liverpool, Chester and Warrington. This market definition is reinforced in terms of travel
to work patterns. These market areas are illustrated in the diagram overleaf.
February 2007 16nd
Liverpool City Region Housing Strategy 2 Draft
Northern Housing Southern Housing Market Eastern Housing Market
Market
Liverpool Chester Warrington
Knowsley Flintshire Halton
Sefton Wrexham Vale Royal
West Lancashire Ellesmere Port St Helens
Wirral Vale Royal
St Helens Wirral
Halton
Ellesmere Port
4.12 Despite what we consider to be a high level of functional integrity within each of the
three market areas, at the extremities of each area there are observed ‘zones of
February 2007 17nd
Liverpool City Region Housing Strategy 2 Draft
flexibility’. We have characterised such zones as exhibiting connections with one or
more of the major housing market areas. The local authority areas which are considered
to be within the zones of flexibility are highlighted in the above table. These are areas
which effectively show links with more than one housing market and as such will respond
to and influence other housing markets.
4.13 More detail is provided on each of the functional housing markets can be found in the
detailed Housing Market Assessments.
Current Housing Market Drivers
4.14 The Strategic drivers of the Northern, Southern and Eastern market areas are profiled
below before considering their future economic and demographic drivers.
The Northern Housing Market Area
4.15 The Northern Market Area is centred upon Liverpool (The Regional Centre) and
comprises the Merseyside authorities of Wirral, Sefton, Halton and Knowsley plus West
Lancashire. The Northern market as a whole has been characterised in the past by a
significant trend of population decline resulting in lower demand for housing. Recently,
this has shown signs of abating, with several local authorities posting positive growth
figures.
4.16 The Northern Housing Market’s economy has experienced profound structural changes
as it has moved out of the manufacturing economy and developed in the service sector
economy.
4.17 The Northern Market Area is notable for the prevalence of stigmatised markets and in the
late 1990s, the emergence of a severe problem of low demand which led to the formation
of NewHeartlands Pathfinder. Evidence contained within this Strategy suggests that
despite the changes in the economy (and indeed the housing market ), Housing Market
Renewal areas remain the most structurally vulnerable to market change in the City
Region. This suggests that the shadow of low demand and market vulnerability will
continue to exert an influence on performance of the inner areas of Liverpool, Sefton and
Wirral while the Pathfinder programme works through its long-term programme of
transformation.
4.18 Social rented housing continues to feature prominently across the Northern Market Area
constituting approximately a quarter of all stock. Demand for this sector has increased as
February 2007 18nd
Liverpool City Region Housing Strategy 2 Draft
a result of increasing household headship rates and unprecedented levels of house price
growth over the last five years which has started to price many first time buyers out of the
market. Social housing will remain an important tenure projecting into the future and
taking demographic and economic factors into consideration.
4.19 Large parts of the Northern Housing Market continue to be characterised by the
prevalence of smaller terraced properties and comparatively low levels of larger family
housing (for example detached housing represents only 14.9% of properties compared
with 32.7% and 20.3% in the Southern and Eastern markets respectively). This skewed
stock profile is likely to affect the ability of the market area to respond to changing
occupational and household demand in the future.
4.20 Despite above average proportions of smaller stock and lower average house prices than
other areas in the City Region, affordability is still an issue within the Northern market
area. Within a number of areas this is the result of low household incomes relative to
rapidly increasing house prices. This is particularly apparent in relation to Housing Market
Renewal areas where house price growth has outpaced household incomes. In addition
there are also parts of the market, such as South Liverpool and West Wirral where high
pricing is exerting a significant effect upon affordability levels creating pressure and high
demand.
4.21 A review of the Northern Market Areas “quality of place” reveals that
• Extremely poor neighbourhood and environmental quality within the ‘core’ urban
area. The periphery generally performs better not withstanding problems associated
with peripheral and monolithic social housing estates on the edge of settlements; and
• Good access to services, as a result of higher density residential areas and better
infrastructure, makes most of the inner neighbourhoods comparably sustainable
locations for future development. There is more variability in access to services
associated with peripheral estates found at the edges of the towns and cities in the
Northern Market Area.
February 2007 19nd
Liverpool City Region Housing Strategy 2 Draft
Overall there is latent potential within the Northern Market Area. It’s infrastructure,
proximity to employment and quality of service provision make it a sustainable location to
live thus representing potential for facilitating economic growth through the
accommodation of new households. However, the poor environmental conditions within
the core areas are continuing to push those actively moving within the housing market
towards more peripheral areas where the overall quality of place is perceived to be
better, and where larger stock types are more prevalent.
The Southern Housing Market Area
4.22 The Southern Market Area is centred upon Chester and includes Ellesmere Port and
Neston, Vale Royal, and the Welsh Authorities of Wrexham and Flintshire. The Southern
Area is well positioned in terms of its economy, with business sector strengths that
provide competitive advantages and will continue to deliver growth over the forthcoming
period.
4.23 Economic growth in the past has been associated with strong population growth and in –
migration creating pressure on the housing market. House prices have risen to levels
which indicate the desirability of the area and the intense pressures on the housing stock.
4.24 The Southern market on the whole enjoys a very strong positive image and represents an
aspirational housing market for much of Merseyside and Greater Manchester. Demand
for property is therefore very high with the success of Chester displacing demand further
into the North East Wales authorities.
4.25 These market pressures have driven up house prices fuelling affordability issues across
the area. The Southern Market Area records the highest affordability ratios within the City
Region and includes a significant area in which it very difficult to locate affordable
housing.
4.26 The area contains a low proportion of social sector housing and this relative “shortage” of
stock means that the ‘safety net’ offered by this tenure could be considered deficient.
Combined with relatively high average prices this has an effect on the accessibility of the
market to new entrants.
February 2007 20nd
Liverpool City Region Housing Strategy 2 Draft
4.27 Affordable properties are largely limited to flatted accommodation with developers
continuing to increase this stock type (terraces constitute only 19.1% of stock),
suggesting a lack of choice in the ‘entry level’ market.
4.28 The long-term prospects for continued growth of the area could be affected by a
shortage of brownfield development sites, particularly around Chester. The tight supply of
sites is due to policy based restrictions, issues of flooding and environmental
designations. In response to these limitations the North East Wales Authorities have
witnessed considerable levels of development to meet demand.
4.29 A review of Quality of Place across the Southern market area illustrates that:
• Quality of neighbourhoods and the resultant quality of life enjoyed by residents is a
key factor distinguishing the Southern Market Area and is lasting appeal to
households; however
• It is a largely rural area and many areas have poor access to essential services. This
raises questions about the future capacity of small settlements to absorb higher
levels of new development.
Overall the Southern Market Area offers unrivalled quality in its neighbourhoods and
quality of life. This has fuelled high demand for property in the area, although as noted
capacity issues regarding available land and the location of services and infrastructure
limit the options for continued growth. Joint working between authorities will be
increasingly important in the future if the Southern Market is going to effectively supply
the level of housing required to sustain its economic development and wider contribution
to the City Region.
The Eastern Housing Market Area
4.30 The Eastern Market Area is projected to experience marked differences in population
growth with Warrington expected to continue growing whilst St Helens and Halton
stagnate. Reflecting the demographic split the Eastern Market shows a concomitant split
in terms of its economic structure. Warrington and Vale Royal have labour force capacity
to participate in and support the development of higher value industry. This directly
February 2007 21nd
Liverpool City Region Housing Strategy 2 Draft
contrasts within Halton and St Helens where the labour force is skewed towards lower
value and skilled occupations. The labour force structure acts as both an economic
enabler and constraint on future growth potential in different areas of the Eastern Market.
4.31 Localised concentrations of deprivation are identifiable within the market area, in
particular within St. Helens and smaller concentrations in North Warrington.
4.32 Housing choice across the Eastern Market Area is generally balanced. The southern
areas (parts of Warrington and Vale Royal) are distinguished by higher than average
levels of detached properties with smaller terraced and semi-detached properties
represented in North Warrington and St. Helens.
4.33 Significant house price rises within the Eastern market area coupled with a number of
localised areas of low household income mean that affordability is becoming an
increasing problem within this housing market area. This has particular relevance to the
southern part of the market area.
4.34 Overall the area offers good a good quality of place, quality of life and access to essential
services. However the “dual” nature of the area serves to mask extremes in areas of
multiple deprivation.
The Eastern Market Area is diverse. As a result of the contrasting housing stock
characteristics of the authorities within the market area it provides a generally ‘balanced’
housing offer. Warrington would appear likely to continue to benefit from its close
proximity to both Liverpool and Manchester and its relatively strong ‘residential offer’.
There are regeneration challenges and the need to build balanced housing markets in St
Helens and Halton.
Future Economic Drivers
4.35 The CRDP sets out a number of priorities and interventions considered necessary to
deliver an accelerated pace of economic development. The ultimate aim is for the City
Region to contribute to the growth of the North of England economy and help reduce the
economic gap with the rest of the UK.
February 2007 22nd
Liverpool City Region Housing Strategy 2 Draft
4.36 Major projects included within the CRDP are summarised below:
• Revitalised Liverpool City Centre with the Paradise Street retail development and the
World Heritage Status for the Waterfront;
• Mersey Waterfront Regional Park
• Projects associated with Liverpool European Capital of Culture 2008
• Further development of Daresbury Science and Research Park
• National Biomanufacturing Centre
• Liverpool Science Park
• Knowsley Innovation and Technology Centre
• Growth of Omega and the Deeside Hub
4.37 This is not a comprehensive list and it is limited to major physical projects. However, it
illustrates the planned scale of economic intervention and the need to factor in the
potential impacts of these projects on the surrounding housing market areas.
4.38 Significant investment in improving and creating new elements of the transport
infrastructure will be delivered in tandem. Improved links between settlements will impact
on the ability of people to travel greater sustainable distances to work. The major
transport interventions anticipated within the City Region are listed within the CRDP.
These include:
• Improving access to the Port of Liverpool by rail and road, including the expansion of
Ditton and Knowsley Rail Freight Terminals and the reinstatement of the Olive Mount
Chord rail link.
• Expansion of Liverpool John Lennon Airport, the intention being to service up to 12
million people by 2030 (current estimates are 6.3 million for 2006).
February 2007 23nd
Liverpool City Region Housing Strategy 2 Draft
• A new Mersey Gateway – proposed new bridge across the Mersey to ease current
congestion issues and open up wider connections through to North Wales1.
• Up-grading of Liverpool Lime Street Station and the opening up of a new station –
Liverpool South Parkway Interchange - to serve Liverpool John Lennon Airport
(project now completed and open)
• On-going West Coast Main Line improvements – journey times between Liverpool
and London have already been dramatically reduced.
• Expansion of the existing Knowsley Rail Freight Terminal
4.39 The employment generated by CRDP project delivery has been considered and modelled
using an extrapolated forecast covering the period 2006-2021. Employment growth by
market area is detailed below.
CRDP Project Delivery: Absolute Change in Employment: 2006-2021
Northern Housing Market Area 30,400
Southern Housing Market Area 13,800
Eastern Housing Market Area 19,400
City Region 48,800
4.40 Employment is likely to grow by 48,800 jobs due to the implementation of CRDP projects.
This is some 23,300 more than that might be expected under normal conditions in the
economy. This illustrates the scale of the CRDP programme and its ability to shift
economic performance onto a new trajectory.
4.41 The CRDP projects will continue the trend of movement from manufacturing to service
sector activity across the Northern and Eastern Market Areas. The heaviest losses in
1
Note: It is suggested within the CRDP that the proposed Mersey Gateway will realise over £1.4 billion in
net present value. With an estimated annual GVA increase of £80m based on a narrow estimate of the value
of the 3350 directly produced jobs.
February 2007 24nd
Liverpool City Region Housing Strategy 2 Draft
manufacturing will be those in the Northern HMA, however this will be counterbalanced
by significant increases in Public Sector Services and Business Services.
4.42 Looking at each of the housing market areas in turn:
• Growth is forecast to be highest in the Northern HMA, where many of the key
business service sectors are located and major interventions are planned. This
improved outlook for the Northern HMA is based upon a halting of the trend towards
population decline that has been in effect for much of the past 2 decades. Recent
evidence suggests an emerging trend of stabilisation and reversal of the long-term
trend.
• As the smallest of the HMAs, the Southern HMA sees lower absolute change in
most sectors, although it is expected to have the fastest growing Retail and
Wholesale sectors by some margin.
• The Eastern HMA is forecast to post high employment growth in Business
Services and Retail and Wholesale sectores, although this is countered by
significant job losses in manufacturing sectors.
4.43 In summary, the economic context for the City Region’s housing markets is expected to
change significantly and positively in the period to 2021. This, coupled with emerging
demographic trends will lead to a transformation in the demand for housing and will re-
iterate the need for investment in quality neighbourhoods and services in order to capture
demand effectively.
Future Economic Drivers: Distribution of Growth
4.44 Economic Growth under the CRDP Project Delivery Scenario will lead to different rates of
economic growth at local authority level. These differences have important consequences
in planning for a supply of housing which is well related to economic drivers.
4.45 The local authority distribution of job growth under the CRDP Project Delivery Scenario is
presented below:
February 2007 25nd
Liverpool City Region Housing Strategy 2 Draft
Local Authority Net Additional % Total Rank of
Employment (000) Employment Employment
Generation
Halton 6.9 14% 2
Vale Royal 1.4 3% 8
Warrington 7 14% 2
Chester 5.6 11% 4
Ellesmere Port 1 2% 9
West Lancashire -0.5 -1% 11
Knowsley 0.4 1% 10
Liverpool 10.7 21% 1
St Helens 4.8 10% 5
Sefton 4.1 8% 6
Wirral 2.6 5% 7
Flintshire 5.8 12% 3
Total 49.82 100%
Source: Cambridge Econometrics/ Interpretation GVA Grimley
4.46 The results demonstrate that the highest levels of employment growth are forecast to
occur in Liverpool (21% City Region growth), Warrington and Halton (14% respectively).
Within the Southern housing market area the major growth drivers are forecast to be
Flintshire (12%) and Chester (11%).
4.47 The Strategy aims to reinforce these economic growth nodes through the provision of an
appropriate level of new housing.
Future Demographic Drivers
4.48 2004-based sub-national population projections suggest population increases in each
Housing Market Area, with migration and longevity both influencing demand for housing.
The diagram below illustrates 2004 based projections by Housing Market Area.
2
Due to rounding within the CE data, the proportional shares of employment growth should be consulted
February 2007 26nd
Liverpool City Region Housing Strategy 2 Draft
Figure 7.11 – 2004 based sub-national population projections, HMAs
Source: ONS, GAD, Deloitte Analysis
4.49 Household projections for the period 2006-2021 are provided at local authority level
below. The results illustrate that household numbers are projected to grow across all
authorities with notable rates of increase in Vale Royal (21%), Warrington (13%) and
Wirral (12%).
Local Authority 2006 2011 2016 2021 Absolute % Change
Change (000)
Knowsley 62 64 65 66 4 6%
Liverpool 195 202 209 215 20 10%
St. Helens 74 76 77 79 5 7%
Sefton 119 122 125 128 9 8%
Wirral 138 144 149 154 16 12%
West Lancashire 46 47 49 51 5 11%
Chester 51 53 54 56 5 10%
Ellesmere Port and 34 34 35 36 2 6%
Neston
Vale Royal 53 57 61 64 11 21%
Halton UA 49 51 53 54 5 10%
Warrington UA 82 86 90 93 11 13%
Source: ONS (2003)
February 2007 27nd
Liverpool City Region Housing Strategy 2 Draft
4.50 Household formation rates are also expected to rise significantly over the next decade,
with a falling average household size (from approximately 2.3 to 2.1 at City Region level
over the period 2006-2021) and with it greater demand for housing. This reduction in
household size will be driven by changing headship trends. Headship rates are projected
to grow for all age-bands below 70 and fall for the over 70 cohort. This is a national
phenomenon and is attributable to an increasing incidence of single person households
amongst younger cohorts coupled with increasing longevity and associated co-habitation
amongst older population cohorts. The effect is an increase in headship rates.
4.51 As a result of this trend more people are likely to form their own households in the future.
Therefore both population change and increasing headship rates are forecast to increase
household demand across the City Region and each of the three housing market areas.
Implications for the Level of Housing Required
4.52 All HMAs will require more housing due to a combination of higher headship rates,
reduced household size and increasing population. Demographic projections
underpinning this Strategy suggest an inflow into the Northern HMA, bucking the trend
seen over the last 2 decades. However, the ability of the Northern HMA to absorb higher
levels of household demand will be determined in relation to its ability to modify its
housing offer and tenure choice to meet the needs and aspirations of newly forming and
incoming households.
4.53 Housing demand under the CRDP Project Delivery Scenario is projected to be:
CRDP Project Delivery – Estimated Household Demand (2006-2021)
• Northern HMA: 74,700
• Southern HMA: 14,900
• Eastern HMA: 25,900
February 2007 28nd
Liverpool City Region Housing Strategy 2 Draft
Implications for Tenure
4.54 Patterns of demographic change, employment change and income profiles have been
used to assess the likely tenure requirements. Two tenure categories have been
investigated:
• open market housing; and
• affordable non-market housing (defined as a combination of social rented housing
and intermediate tenure options)
4.55 Taking into consideration the planned employment growth to be delivered by the
realisation of the CRDP projects plus demographic and headship trends, the following
estimates of demand for affordable non-market housing have been produced.
CRDP Project Delivery – Household Demand for Affordable Housing (2006-21)
• Northern Market Area: 17,600
• Southern Market Area: 3,300
• Eastern Market Area: 5,600
4.56 While the average household is less likely to require affordable housing, the fact that
absolute household numbers will increase significantly effectively offsets any reduction in
the demand for affordable housing.
4.57 Clearly, this is a change from past trends associated with decreasing demand for social
housing in certain areas of the City Region, alongside a falling overall demand for
housing. However, it should be noted that demographic changes will cause this
“structural break” from previous trends and lead to higher levels of need.
4.58 In terms of the overall split between market and non-market housing the following table
illustrates the results for each housing market area:
February 2007 29nd
Liverpool City Region Housing Strategy 2 Draft
Housing Total Market % Market Non-Market % Non-Market
Market Area Household Demand Demand (Affordable)
Demand
Northern 74,700 57,100 76% 17,600 24%
Southern 14,900 11,600 78% 3,300 22%
Eastern 25,900 20,300 78% 5,600 22%
Total 115,500 89,000 26,500
4.59 The implication for developing a City Region Housing Strategy is that intermediate
housing, comprising social and hybrid models of ownership, will form a significant
component of household demand over the period to 2021. Local Housing Needs Studies
are required to articulate the appropriate split in demand between social rented and
intermediate options.
4.60 It is important to note that the social rented sector will continue to play an important role
for a significant number of households. These include households with specific
requirements, for example sheltered housing as well as households affected by
unemployment and employment in low paid occupations.
4.61 It is recognised that local authorities within the City Region are aiming to create a more
balanced tenure profile through increasing levels of owner-occupation and addressing
areas of unpopular social stock. This is particularly relevant in the Northern Market Area
where stock is currently skewed towards social rented property. Given the funding
constraints associated with the provision of new social housing, partners across the City
Region are considering the wider role that intermediate housing can play in meeting
identified household needs.
4.62 In addition to the trends noted above, the rising value of housing on the open market has
effectively priced some households out of owner occupation. There is latent demand
across the City Region for an affordable and aspirational housing product. Intermediate
housing therefore has a potentially important role to play in bridging the gap between
social and open-market housing where households have sufficient resources to sustain
an equity stake in a property.
The Potential Role of Intermediate Housing
4.63 Analysis within the Housing Market Assessments helps to establish the potential role of
intermediate products within the City Region. The following conclusions have been
reached:
February 2007 30nd
Liverpool City Region Housing Strategy 2 Draft
• Across the City Region the current pattern of household income support the need to
develop a wider range of options to assist households that are unable to access open
market housing. The CACI household income profiles consulted suggest a significant
proportion of households with income levels falling relatively close to that required to
purchase entry-level housing. Intermediate housing might therefore offer an option for
these households in bridging the affordability gap.
• To a lesser extent the analysis has highlighted that intermediate housing might be a
viable proposition for some households that are able to afford a smaller proportional
share of equity in a shared ownership product. This could partially address demand
pressures in the social rented sector however is unlikely to be a mainstream
response to addressing housing need at lower levels of household income. There are
greater risks associated with households sustaining rental and mortgage repayments
that may render intermediate housing options unsustainable for lower income groups.
• There may be a role for “Homebuy” models in which social rented housing tenants
can acquire an equity stake in their existing home or a new property. Development of
this type of tenure option might serve to break up large monolithic social housing
estates in the Northern Market Area and ease pressures on social housing within the
Southern Market Area.
4.64 Analysis at the local level, through detailed Housing Needs Surveys, is required to
distinguish this finer level of detail and provide clearer indication of the products required
and changing levels of households with a propensity to take-up housing within this
tenure.
4.65 It is also important in the context of the strategy to recognise the need to create
balanced, mixed income communities in monolithic, single tenure housing estates.
Therefore, intermediate products might form one component, alongside housing for sale
and private rent.
Implication for the Type of Housing Demanded
4.66 Within the Housing Market Assessments, analysis has been undertaken to relate the
existing stock profile to that which is likely to be demanded in the future. This exercise
serves to illustrate the ways in which local authorities will need to influence the supply of
new housing to ensure it meets economic demand.
February 2007 31nd
Liverpool City Region Housing Strategy 2 Draft
Current Mix
4.67 The Census 2001 provides information on the mix of housing types across the national
(England and Wales) housing market. This has been used as a proxy for a “balanced”
housing market against which comparisons with the City Region housing market area can
be drawn. A breakdown of the national housing market is provided below by stock type.
1.1 The chart below relates the size of the HMA to the City Region (horizontal axis), and the
proportion of houses in each HMA (vertical axis). The size of each ‘block’ in the chart is
representative of the size of that type of housing relative to the City Region as a whole.
February 2007 32nd
Liverpool City Region Housing Strategy 2 Draft
Total Share of City Region Housing Stock, 2006
Housing Market Mix
565,985 165,353 204,064
Share 100
Flat (17,255) Flat (18,662)
within Flat (101,827)
Area Terrace
80 (37,247) Terrace (65,858)
Terrace (221,435)
60
Semi-Detached
(69,725)
Semi-Detached
40 (93,171)
Semi-Detached (254,126)
20 Detached
(58,381) Detached (45,035)
Detached (90,424)
0
0 20 40 60 80 100
NHM SHM EHM
Share of City Region %
Source: ONS, DCLG, Deloitte Analysis
4.68 This shows that:
• The housing mix is very different between housing market areas. The Southern HMA
has relatively few flats and terraces, whilst the Northern HMA has relatively few
detached houses. The proportion of semi-detached housing is very similar in all 3
areas.
• Based upon the prevailing mix in England and Wales, the Northern HMA would seem
to have a surplus of terraced housing and a shortfall of detached housing. This is
equally applicable to the housing mix in the Eastern HMA.
• The Southern HMA is broadly in line with national mix.
Future Housing Mix
4.69 The “direction of growth” for each type of housing is shown in the diagram below. Where
the growth rate is not significantly different no shading is applied. If relative growth is
anticipated the cell is shaded green and if the model implies the mix type will be subject
to a relative lowering of demand the cell is shaded blue in colour.
February 2007 33You can also read