NYC's Nightlife Economy - Impact, Assets, and Opportunities Commissioned by The Mayor's Office of Media and Entertainment - NYC.gov
←
→
Page content transcription
If your browser does not render page correctly, please read the page content below
NYC’s Nightlife Economy
Impact, Assets, and Opportunities

Commissioned by The Mayor’s Office of Media and Entertainment

About the Mayor’s Office of Media and Entertainment

The Mayor’s Office of Media and Entertainment encompasses the key economic and creative sectors of film,
TV, theater, music, advertising, publishing, digital content and real estate as it relates to these industries. The
office promotes New York City as a thriving center of creativity, issuing permits for productions filming on public
property, and facilitating production throughout the five boroughs. In June 2017, Mayor Bill de Blasio announced
that the Mayor’s Office of Media and Entertainment (MOME), led by Commissioner Julie Menin, would support
NYC’s diverse nightlife community with a department dedicated to its management. The Office of Nightlife
cements New York’s position as a leader in this growing global movement that recognizes nightlife’s value to
cities, and represents the first time a NYC agency has been tasked with promoting an economically and culturally
vibrant nightlife industry.

About the Consulting Team

The NYC Nightlife Economy report was conducted by a three-firm consulting team: The North Highland
Company, Econsult Solutions, Inc. (ESI), and Urbane Development.

The North Highland Company

The North Highland Company is a global consulting organization serving multiple industries and functional areas.
The Firm’s Consumer, Media and Entertainment, Public Sector and Strategy practices contributed to this study.

Econsult Solutions, Inc.

Econsult Solutions, Inc. (ESI) provides businesses and public policy makers with economic consulting services
in urban economics, real estate economics, transportation, public infrastructure, development, public policy and
finance, community and neighborhood development, planning, as well as litigation support.

Urbane Development

Urbane Development (Urbane) is a community development venture and certified M/WBE based in New York
City. Founded in 2008, Urbane cultivates innovative solutions to build dynamic neighborhoods and positively
impact underserved communities.

                                                         2
Executive Summary

Throughout its long history, nightlife has been central to
New York City’s identity. The “city that never sleeps” is
a destination for dreamers and doers and an epicenter
of creativity. It boasts something for everyone once the           New York City
sun sets, including opportunities for dining, dancing,
performing, socializing, or building a career. Over many         nightlife is world-
                                                                  renowned, and
decades, New York nightlife has launched cultural and
social movements that resonated far beyond the city’s
shores: from the social consciousness of beat poetry,
folk music, and hip-hop, to the rhythms of jazz, salsa,          has a $35 billion
disco, punk rock, and many more. New York nightlife
has inspired artists and entertainers to push boundaries,        economic impact.
and provided places for people to come together to
find community, all of which contributes to the city’s
distinctive energy.

Not surprisingly, nightlife is a major economic, as well as cultural driver for New York City, with more than 25,000
nightlife establishments citywide. In 2016 (the most recent year where standardized data sets were available), the
nightlife industry supported 299,000 jobs with $13.1 billion in employee compensation and $35.1 billion in total
economic output. This annual economic impact also yielded $697 million in tax revenue for New York City.

The popularity of nightlife is reflected in economic activity that has outpaced New York City’s overall economy,
driven by a 2 percent annual growth rate in nightlife establishments between 2011 and 2016. The five-year
annualized growth rate1 for jobs in the nightlife industry was 5 percent, compared to the city’s overall job growth
of 3 percent. Nightlife wages have been rising at double the annual rate for the city, at 8 percent as compared to
4 percent citywide.

Defining the Nightlife Economy

NYC’s nightlife comprises five subsectors, and the economic activity that occurs within those subsectors between
the hours of 6PM and 6AM:

Food Service: Food Service, a subsector that encompasses full- and partial-service restaurants, cafes, and food
trucks, is the backbone of NYC’s nightlife industry, with 19,400 establishments across the five boroughs. The
Food Service subsector directly supported 141,000 jobs, $4.2 billion in wages, and $12 billion in direct economic
output. Fine dining is a notable contributor to this subsector; NYC is home to 72 Michelin-starred restaurants,
more than any other U.S. city.

Bars: The Bars subsector, which includes drinking establishments that primarily serve alcoholic beverages, and
nightclubs, comprises 2,100 establishments, and boasts a five-year annualized growth rate that outpaced the
nightlife industry as a whole. The Bars subsector generated 13,400 direct jobs, $492 million in wages, and $2
billion in direct economic output.

                                                          3
EXECUTIVE SUMMARY

Arts: The Arts subsector, which includes galleries,                                        Nightlife’s Economic Impact
museums, live performing arts spaces, movie
                                                                                           In total, the five subsectors that comprise NYC
theaters, and Broadway, has 1,800 establishments.
                                                                                           nightlife—Food Service, Bars, Arts, Venues, and
Most of the subsector’s jobs and wages—75 percent
                                                                                           Sports and Recreation—were responsible for a
and 90 percent—are clustered in Manhattan.
                                                                                           direct economic impact of 196,000 jobs, $6.2 billion in
However, Brooklyn has seen robust job and wage
                                                                                           wages (or $7.4 billion in employee compensation), and
growth in this subsector (10 and 12 percent,
                                                                                           $19.1 billion in economic output.
respectively). Nightlife in the Arts subsector supported
18,300 direct jobs, $804 million in wages, and $3.1                                        Beyond the economic impact of nightlife businesses
billion in direct economic output.                                                         themselves, the nightlife sector yields additional
                                                                                           benefits for NYC’s economy. The goods and services
Venues: The Venues subsector includes concert and
                                                                                           locally purchased by nightlife establishments have an
entertainment venues, independent venues, informal
                                                                                           indirect impact in the NYC economy of 25,000 jobs,
cultural and performance spaces—commonly referred
                                                                                           $1.8 billion in employee compensation, and $5.1 billion
to as “do-it-yourself,” or DIY venues. As of 2016,
                                                                                           in economic output. The induced economic impact of
there were 2,400 establishments in this subsector
                                                                                           nightlife is the result of spending by those employed
throughout NYC. Notably, Queens’ venues have grown
                                                                                           directly in the nightlife industry. In 2016, this amounted
by 10 percent in the last 5 years, in comparison to
                                                                                           to more than 29,000 jobs with $1.7 billion in employee
citywide growth of 4 percent. Venues operating at
                                                                                           compensation and $4.9 billion in economic output.
night generated 19,900 direct jobs, $373 million in
wages, and $1.2 billion in direct economic output.2                                        There is also an ancillary impact on NYC’s economy
                                                                                           from additional spending on retail, transportation,
Sports and Recreation: New York City offers no
                                                                                           lodging, and other services that happens only
shortage of family-friendly nightlife, including arcades,
                                                                                           because of people enjoying New York City’s nightlife.
amusement venues, billiards, bowling alleys, and
                                                                                           This ancillary spending supports 48,000 jobs, $2.3
spectator and participatory sports. The Sports
                                                                                           billion in wages and $6.0 billion in economic output.
and Recreation subsector represents the smallest
component of NYC’s nightlife industry, with 100 total                                      Finally, the nightlife industry generates a fiscal impact
establishments as of 2016. Nightlife’s total impact in                                     of $1.8 billion in tax revenues to New York City and
this subsector included 3,900 direct jobs, $352 million                                    New York State. This includes taxes from nightlife
in wages, and $735 million in economic output.                                             employees, sales, liquor and hotel taxes, totaling $697
                                                                                           million to the City and $1.1 billion to the State.

                               Exhibit 1.1: NYC Nightlife’s Direct Economic Impact by Subsector

              Subsector                             Establishments                              Jobs                      Wages                       Output
              Food Service                                          19,400                 141,000                          $4.2B                     $12.0B
              Bars                                                    2,100                  13,400                        $492M                        $2.0B
              Arts                                                    1,800                  18,300                        $804M                        $3.1B
              Venues                                                  2,400                  19,900                        $373M                        $1.2B
              Sports & Recreation                                        100                   3,900                       $352M                      $735M
              Total                                                 25,800                 196,000                          $6.2B                     $19.1B
                            Source: Bureau of Labor Statistics (2016), U.S. Census Bureau (2012), IMPLAN (2015), Econsult Solutions (2018)
                                                                   Columns may not sum due to rounding.

Direct economic impact was modeled using direct wages from the Bureau of Labor Statistics. IMPLAN then estimates the employee compensation of these direct wages and calculates
the portion of indirect and induced impacts’, employee compensation and total output.

                                                                                       4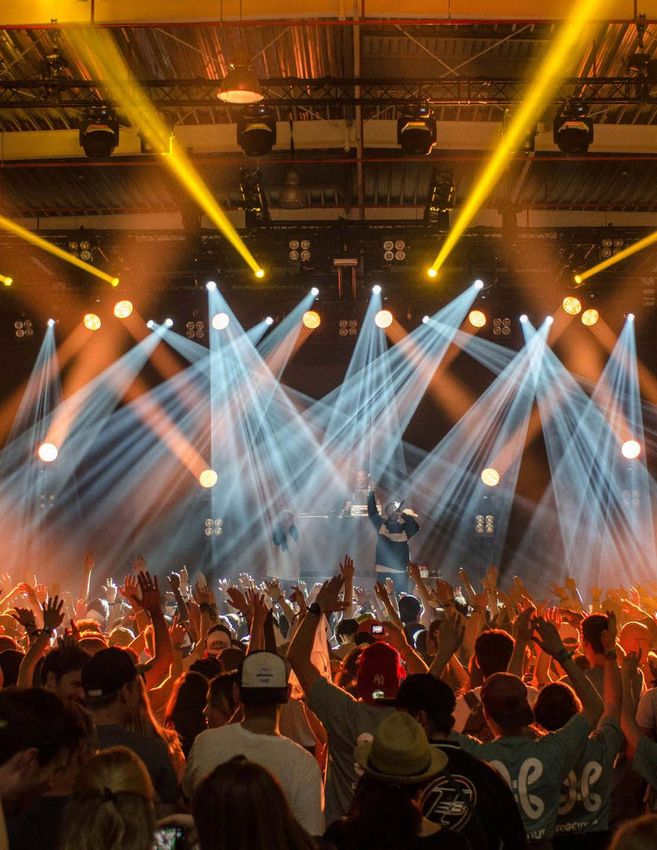
EXECUTIVE SUMMARY

          Exhibit 1.2: Direct, Ancillary, Induced, and Indirect Impact of NYC’s Nightlife Economy

                            299,000                                $13.1B                               $35.1B
       % 100
                             25,000                                 $1.8B                                $5.1B        Indirect Impact
                             29,000
            80                                                      $1.7B
                                                                                                         $4.9B        Induced Impact
                             48,000

                                                                    $2.3B                                $6.0B        Ancillary Impact
            60

            40
                            196,000                                 $7.4B                              $19.1B
                                                                                                                      Direct Impact
            20

             0
                              Jobs                             Employee                               Economic
                                                             Compensation                              Output
                   Source: Bureau of Labor Statistics (2016), U.S. Census Bureau (2012), IMPLAN (2015), Econsult Solutions (2018)
                                                        Columns may not sum due to rounding.

Nightlife’s Citywide Reach                                                   Brooklyn has witnessed the highest growth in
                                                                             nightlife, with 5,500 total establishments as of 2016,
One of New York’s many strengths is that every
                                                                             growing at an annual rate of 5 percent. There were
neighborhood has something different to offer, and
                                                                             31,100 direct nightlife jobs supporting $608 million
New Yorkers’ nightlife choices reflect this. Nightlife
                                                                             in wages, with annualized growth rates of 10 and 15
establishments are distributed throughout the city,
                                                                             percent, respectively–double the citywide rate. Total
generating economic activity and providing local jobs
                                                                             liquor licenses have grown at an annualized rate of 4
in all five boroughs:
                                                                             percent since 2000, with 2,586 active licenses in 2018.
The Bronx experienced a steady growth in nightlife
                                                                             Manhattan had 13,000 nightlife establishments
establishments until 2015, when the growth reversed.
                                                                             as of 2016, the highest across all five boroughs.
As of 2016, there were 1,700 nightlife establishments
                                                                             Manhattan’s nightlife establishments have seen
in the Bronx, and the borough matched the city’s
                                                                             modest growth of 2 percent annually, leveling
overall annual growth rate of 2 percent. There were
                                                                             off between 2015 and 2016. Manhattan nightlife
7,600 direct nightlife jobs supporting $129 million
                                                                             supported 128,900 direct jobs with $4.8 billion in
in wages, with annualized growth rates of 7 and 9
                                                                             wages, with annualized growth of 4 and 7 percent,
percent, respectively. The Bronx experienced the
                                                                             respectively. Total liquor licenses have grown at an
highest growth in the Venues subsector (3 percent),
                                                                             annualized rate of 1.6 percent since 2000, with 6,011
but a decline in the Bars subsector (-2 percent). This
                                                                             active licenses across the borough as of 2018.
data from the New York State Liquor Authority (SLA)
shows an annualized growth rate for liquor licenses of                       Queens had 4,800 nightlife establishments in 2016,
0.2 percent since 2000.                                                      and experienced annualized growth of about 3 percent

                                                                         5
EXECUTIVE SUMMARY

since 2011. Queens’ venues spaces have grown by                                            license serial numbers over time demonstrated that 44
10 percent in the last five years in comparison to                                         percent of licenses were still active after six years, 22
NYC’s venue growth of 4 percent. There were 24,900                                         percent were still active after 12 years, and roughly 20
direct nightlife jobs supporting $622 million in wages.                                    percent were still active after 18 years.
The annualized growth rate for jobs and wages were
                                                                                           Data from the NYC Taxi and Limousine Commission
7 and 9 percent, respectively, outpacing nightlife
                                                                                           (TLC) show that approximately 32 percent of all taxi
growth citywide. Until the mid-2000s, Queens had
                                                                                           and FHV trips are nightlife related. The rise of FHVs
more nightlife establishments and liquor licenses than
                                                                                           has contributed to increased activity across NYC,
Brooklyn—making it second to Manhattan. According
                                                                                           with an annualized growth rate for total taxi and FHV
to 2018 SLA data, the borough has 2,332 active
                                                                                           pick-ups during prime nightlife hours (12AM to 4AM)
licenses, which represents 1.7 percent annualized
                                                                                           of 12 percent each year between 2013 and 2017. The
growth since 2000.
                                                                                           growth of taxi and FHV trips is especially pronounced
Staten Island had 800 nightlife establishments, down                                       outside Manhattan:
from 815 in 2015—the fewest establishments of any
                                                                                             •   Brooklyn has seen an increase in the volume
borough. It has experienced a decline in nightlife
                                                                                                 of taxi/FHV activity in Bushwick (92 percent
establishments across all subsectors over the last 5
                                                                                                 annualized growth in 12AM to 4AM trips) and
years. There are 3,900 direct nightlife jobs supporting
                                                                                                 Williamsburg (33 percent annualized growth).
$64 million in wages, with annualized growth rates of 5
and 6 percent, respectively. SLA data show 404 active                                        •   In the Bronx, the greatest increase in taxi/FHV
liquor licenses in the borough in 2018, an annualized                                            pick-ups were in: West Concourse (133 percent
growth of 0.6 percent since 2000.                                                                annualized growth), East Concourse (175 percent
                                                                                                 annualized growth), Co-op City (389 percent
Two additional historical analyses were completed to
                                                                                                 annualized growth), and Mott Haven (90 percent
contextualize nightlife’s economic impact—examining
                                                                                                 annualized growth).
the retention rate of establishments with liquor
licenses and the growth of taxi and For-Hire Vehicles                                        •   In Queens, neighborhoods with the greatest increase
(FHV) across NYC.                                                                                in the volume of taxi and FHV pick-ups include
                                                                                                 Jackson Heights (68 percent annualized growth in
Data provided by SLA show that NYC had 11,961
                                                                                                 trips) and Astoria (34 percent annualized growth).
active on-premises liquor licenses in 2018, a total
that has grown at an annual rate of 2 percent since
2000, despite significant turnover. Tracking liquor

                                  Exhibit 1.3: NYC Nightlife’s Direct Economic Impact by Borough
                                  Establishment                   Growth                     Jobs               Growth                    Wages              Growth
       Bronx                                     1,700                   2%                 7,600                      7%                  $129M                    9%
       Brooklyn                                  5,500                   5%                31,100                    10%                   $608M                  15%
       Manhattan                               13,000                    2%              128,900                       4%                   $4.8B                   7%
       Queens                                    4,800                   3%                24,900                      7%                  $622M                    9%
       Staten Island                                800                  1%                 3,900                      4%                   $64M                    6%
       Total                                   25,800                    2%              196,000                       5%                   $6.2B                   8%
                            Source: Bureau of Labor Statistics (2016), U.S. Census Bureau (2012), IMPLAN (2015), Econsult Solutions (2018)

Direct economic impact was modeled using direct wages from the Bureau of Labor Statistics. IMPLAN then estimates the employee compensation of these direct wages and calculates
the portion of indirect and induced impacts’, employee compensation and total output.

                                                                                       6
EXECUTIVE SUMMARY

Nightlife Stakeholder Perspectives                             Where they work and live: A large majority of
                                                               artists (80 percent) reported that they primarily
To complement the economic impact analysis, more
                                                               perform in Manhattan, followed by 18 percent who
than 1,300 nightlife stakeholders—consumers/residents,
                                                               focus on Brooklyn for their performances. Manhattan
owners/operators, artists/entertainers, and employees—
                                                               and Brooklyn were the most popular boroughs for
participated in a survey about their experiences.
                                                               residence, with 39 percent and 23 percent of artists
Owners/Operators: Of the 83 owners and operators               living in these boroughs, respectively. Of the 22
surveyed, respondents operated restaurants (69                 percent who commute from outside New York City, the
percent), bars (60 percent), and dance clubs (24               overwhelming majority live in New Jersey and other
percent), among other types of establishments.                 parts of New York.
 •   Revenue and profits: Over the last 3 years,               •   Challenges: Eighty percent of artists and
     respondents reported modest revenue growth, with              entertainers cited lack of income stability as a
     35 percent stating that revenues had increased, 31            moderate or major challenge. The lack of benefits
     percent stating that revenues had stayed flat, and            and low wages were also cited as challenges.
     24 percent reporting declining revenues over the              Competition for gigs remains a significant hurdle for
     last 3 years (the remainder were either unsure or             performers, with 80 percent citing it as a moderate
     preferred not to answer). Furthermore, 47 percent             or major challenge. Sixty-eight percent of surveyed
     reported a decrease in profit over the same period,           artists pointed out that establishment closures and
     with 17 percent experiencing a decrease that                  reduced hours adversely impacted them.
     exceeded 10 percent.
                                                               •   Outlook: Despite challenges, over three-fourths
 •   Outlook: Sixty percent of respondents believe                 of respondents (79 percent) indicated they will still
     their businesses will be open in three years.                 work in the NYC nightlife industry in three years.
     Nearly 40 percent were either unsure or indicated
     that their businesses would not be open in three
     years. Thirty-five percent of owners anticipate
     expanding their business within New York City,
     while 41 percent plan to expand into other cities.

 •   Challenges: Eighty-seven percent of respondents
     indicated the rise of commercial rent prices is a
     challenge to varying degrees. For 68 percent of
     owners, regulations or red tape were cited as a
     challenge and 67 percent reported staffing their
     establishments as challenging.
                                                                     Despite challenges, over
Artists/Entertainers: Among the 187 artists and
entertainers surveyed, respondents had an average                     three -fourths of artists
tenure in their role exceeding 23 years. Over half                  and entertainers believed
of nightlife artists and entertainers (60 percent) are               they will still work in the
employed full-time in their craft; the balance (40
percent) work part-time in other non-related industries.
                                                                     NYC nightlife industry in
Of artists surveyed, 28 percent reported performing at                      three years.
three to five establishments at the time they took the
survey. Another 23 percent were performing at six or
more establishments.

                                                           7
EXECUTIVE SUMMARY

Nightlife Employees: Nightlife is a source of                       to experience art and culture (64 percent).
employment across many roles: establishment                         Non-residents also have a higher propensity
managers, security, chefs and other food preparation                for sightseeing at night (more than 50 percent
roles, bartenders, hosts, service staff, and more.                  compared to 22 percent for residents).
Among 106 survey respondents spanning these roles,
                                                                •   Influences shaping their choices: Besides their
the average tenure exceeded 18 years in the nightlife
                                                                    personal preferences and tastes, the top factors
industry. The majority work full-time in their role (77
                                                                    that shape consumers’ nightlife decisions are the
percent). Forty-two percent of employees surveyed
                                                                    opportunity to attend a unique experience or event
indicated that they worked at one establishment,
                                                                    (93 percent), price or affordability (89 percent),
23 percent worked in two locations and another 22
                                                                    minimal wait time (84 percent), and accessibility
percent worked in three to five locations (the remainder
                                                                    via public transportation (83 percent).
indicated that they work in six or more establishments).
                                                                •   Challenges: Cost was a top consumer concern,
 •   Where they work and live: Those surveyed
                                                                    with 66 percent of respondents agreeing that
     work predominantly in Manhattan (74 percent)
                                                                    affordability is a challenge to participating in
     and Brooklyn (21 percent). Employees reported
                                                                    nightlife. For residents living in neighborhoods
     living in Manhattan (39 percent) and Brooklyn (34
                                                                    dense with nightlife establishments, quality of life
     percent) most frequently. Twelve percent reported
                                                                    concerns relating to noise, sanitation, and lack of
     residence outside New York City.
                                                                    retail diversity were major challenges cited.
 •   Challenges: Fifty-four percent of survey
                                                               New York City’s nightlife is thriving, outpacing growth
     respondents cited the lack of benefits as a
                                                               in the citywide economy, supporting 299,000 jobs
     moderate or major obstacle of working in the
                                                               and $35 billion in economic activity, and providing
     nightlife industry. Close to half of employees
                                                               spaces for New Yorkers of all stripes to gather.
     surveyed (49 percent) indicated that income
                                                               However, the New Yorkers who rely on nightlife for
     volatility is a challenge.
                                                               their livelihood do face challenges, as do residents
 •   Outlook: Despite challenges, a majority                   living in neighborhoods dense with nightlife
     of employee respondents (65 percent) see                  establishments. The City’s new Office of Nightlife is
     themselves continuing to work in the nightlife            uniquely positioned to help mitigate these pressures
     industry within the next three years.                     and to ensure that the City’s services and support
                                                               systems that are available during the day are equally
Consumers/Residents: Of the 864 nightlife
                                                               coordinated at night.
consumers surveyed, 73 percent were NYC residents,
while the balance (27 percent) were non-residents              As the Office of Nightlife sets its policy agenda, it
(commuters, day-trippers, tourists, business travelers).       can improve the nightlife ecosystem by working
Most fell between the ages of 21-40 (66 percent), with         across City agencies to reduce red tape; increase
32 percent age 41 or older.                                    regulatory transparency; address quality of life
                                                               concerns; and identify opportunities for investment in
 •   Where they go: NYC’s nightlife consumers most
                                                               economic development and cultural retention, through
     commonly enjoy restaurants (85 percent), bars
                                                               partnerships with both City and non-City entities.
     and nightclubs (73 percent), and live music and
                                                               These efforts will help not only those who work in New
     concerts (56 percent).
                                                               York City’s nightlife, but also the millions of people
 •   Reasons they go out: Consumers engage                     who venture out, from near and far, to enjoy all the city
     in nightlife to connect with friends/family (77           offers when the sun goes down, as well as those who
     percent), to relax and unwind (69 percent) and            prefer the comforts of staying in.

                                                           8
03   Executive Summary
CONTENTS

           10   Introduction
           16   Economic Impact of NYC’s Nightlife
           42   NYC’s Nightlife Assets
           46   Nightlife Perspectives
           62   Opportunities for the Future
           66   Appendix

                            9
NYC’S NIGHTLIFE ECONOMY: IMPACT, ASSETS, AND OPPORTUNITIES

Introduction

                                                             10
                                                             10
Introduction
The City that never sleeps. New York City’s famous nickname recognizes that nightlife is part of NYC’s
identity and history. NYC’s nightlife is known globally for its diversity and innovation, which are a function of its
defining characteristics:
• Long immigrant history drawing from cultures across the world;
• Diverse population and economic base;
• Destination for commuters and tourists;
• Epicenter for artists and creatives seeking to develop their craft and be discovered; and
• Cultural appetite that values history alongside the new, innovative, and unusual.
Throughout its long history, NYC’s nightlife has incubated cultural and social trends with impact well beyond its
five boroughs: beat poetry, pop art, disco, hip-hop, punk rock, jazz—the list goes on. From world-famous venues
and concert halls such as Harlem’s Apollo Theater, Staten Island’s St. George Theater, Broadway theaters and
Madison Square Garden, and underground venues at the cutting edge of culture—New York City’s nightlife
is second to none. New York attracts, and is home to, artists across all genres, who develop their talents and
draw inspiration from across NYC’s nightlife venues. Experience in New York City nightlife provides musicians,
entertainers, and performing artists the chance to hone their craft and build demand for their talent. Throughout
its history, New York City nightlife’s contributions to economic, artistic, and cultural trends have been fueled by
businesses, artists, employees, and nightlife patrons.
Across the globe, many cities have planned primarily for the daytime economy, with nightlife managed in a less
formal manner. In recent years, many have now started to take a proactive approach to managing nightlife,
including not only its economic effects, but also its social and cultural impacts.3 These efforts have resulted in
reductions in noise complaints, improved quality of life, and stronger nighttime economies. There are many case
studies and ideas for proactive management, City agency cooperation, and creative solutions that New York can
benefit from.
New York has now joined more than 40 cities around the world with so-called “nightlife leaders,” such as
Amsterdam, Berlin, London, and Paris as well as in American cities like Orlando, Pittsburgh, and San Francisco.
In June 2017, Mayor Bill de Blasio announced that the Mayor’s Office of Media and Entertainment (MOME),
NYC Nightlife: Economic Indicators
5% 8%
job growth wage growth
11INTRODUCTION
led by Commissioner Julie Menin, would support Methodology Overview4
NYC’s diverse nightlife community with a department
This study used the following steps to assess the
dedicated to its management. In August 2017, the City
economic impact of NYC’s nightlife:
Council passed Local Law 178, and in September,
Mayor de Blasio signed the bill, officially creating New • Reviewed nightlife trends and studies from cities
York City’s Office of Nightlife. across the world, as well as literature on NYC’s
nightlife, past and present.
The Office of Nightlife cements New York’s position
as a leader in this growing global movement that • Analyzed economic indicators and metrics across
recognizes nightlife’s value to cities, and represents relevant subsectors in NYC’s five boroughs,
the first time a City agency has been tasked with including, but not limited to:
promoting an economically and culturally vibrant
nightlife industry. Employment and wages calculated by the
Bureau of Labor Statistics;
To inform the work of the Office of Nightlife, and
following the 2017 study Economic Impact, Trends Establishments data recorded by the Bureau
and Opportunities: Music in New York City, MOME of Labor Statistics;
commissioned this study of the current economic and The portion of economic activity attributable to
cultural dynamics of the nightlife industry, to provide nightlife, focusing on the hours between 6PM
recommendations to support and strengthen the and 6AM.
nightlife community. The study summarizes its findings
in the following sections: • Quantified the economic impact of nightlife using
IMPLAN, an industry-standard input-output
• Methodology Overview: The approach, tools, economic modeling software.
and techniques used to analyze multiple data
sources and draw insights from nightlife’s many • Surveyed 864 consumers who patronize NYC
stakeholders; nightlife including NYC residents from all five
boroughs, commuters, and tourists. The survey
• Economic Impact of NYC’s Nightlife: The value was designed to understand their nightlife
of NYC’s nightlife to the city’s economy based on preferences, economic activities, perceptions,
five categories of impact with summary views for and challenges.
each borough;
• Surveyed 376 NYC nightlife professionals, including
• NYC’s Nightlife Assets: An understanding of owners and operators of establishments, artists and
NYC’s nightlife assets beyond the economic performers, and employees of nightlife industries.
impact numbers;
• Interviewed 65 people including including owners
• Nightlife Perspectives: Perspectives of nightlife and operators of establishments, artists and
stakeholders, and the challenges they face, based performers, consumers (residents, tourists,
on more than 1,300 surveys and interviews of commuters), public officials, policymakers,
consumers (NYC residents and non-residents), developers, activists, academics, and employees of
owners or operators of nightlife establishments, nightlife industries.
artists, and employees; and
• Opportunities for the Future: Opportunity areas
for NYC’s local government to address some of
the challenges facing nightlife.
12INTRODUCTION
The Nightlife Ecosystem
Urban nightlife ecosystems are complex—there
are many moving parts and participants, including
people who enjoy the night, who work at night, and
who manage nighttime activities. These categories
are not mutually exclusive; a student may be a
frequent bar patron as well as a hospitality worker,
or an emergency services worker may be a taxi
passenger returning from an overnight shift managing
public safety.
To specifically identify key trends and to examine the
impact of the nightlife economy in New York City—
defined as activity occurring between the hours of 6PM
and 6AM—this study defines the nightlife ecosystem as
five key subsectors with several sub-categories.5
Arts: Galleries, museums, live performing Exhibit 2.1: Nightlife Economy Sub-Categories
arts spaces, and movie theaters
Subsector Industry Sub-Category
Live theatres and motion picture theatres
Arts Art galleries
Bars: Drinking establishments that Other live performing arts
primarily serve alcoholic beverages (and
not food), as well as nightclubs Bars
Bars
Nightclubs
Food Service: Full- and partial-service Full-service and partial-service restaurants
restaurants, cafes, fast food and
fast casual restaurants, venue food Food Service Fast food or fast casual restaurants
concessions, food trucks, and other food- Concessions and other food
related establishments establishments
Spectator sports
Sports and Recreation: Spectator sports Sports &
and other recreational activities such as Recreation Experiential activities (bowling, arcades,
participatory sports, bowling, billiards, billiards, etc.)
amusement arcades, other recreation
Music venues
Venues
Independent spaces
Venues: Music venues as well as
independent and DIY spaces Source: Econsult Solutions (2018)
13INTRODUCTION
Exhibit 2.2: The Nightlife Ecosystem – Any/All Cities (Not Exhaustive)
Influencers Other
Taxi,
Service
For-Hire
Promoters Staff
Galleries/ Cleaning Drivers
Museums Staff Creative
Restaurants Industries Other
Late-
& Food Svc Workers EMS
Other Night Police
Businesses Workers
Licensed Waiters Public Security
DIY Bartenders Transit
Premises Health Guards
Operators Owners Hospitality Service Workers
Sector
Workers
Fire
Safety Overseers
Late-night Night-time
Gyms Sports
City
Councils
Students WORK
Developers
Residents AT NIGHT
Environ-
mental
Health
Concert-
goers ENJOY MANAGE Data/Insight
Commuters Analysts
THE NIGHT THE NIGHT Social
Service
Workers
Clubbers
Policy
Makers
Cab Mayor’s
Passengers Office
Tourists
Streets
Licensing
Diners
Athletes Officials
Off-Duty Community
Workers/ Neighbor-
Reps
Spectators Artists hoods
Urban Schools
Drinkers
Theatre- Designers &
Goers Planners
Universities Local
Daters Economies
Public
Families Squares
Homeless
Source: North Highland Nightlife Archives, Research and Analysis
14“Nightlife is indistinguishable
from my craft as a DJ. Nightlife
is not optional to my long-term
profession and not separate
from the art itself. Nightlife is
the medium.”
- NYC Nightlife Performer
15The Economic Impact
of NYC’s Nightlife
16The Economic Impact of NYC’s Nightlife
The overall economic impact of New York City’s nightlife has five components:
• Direct Impact: The jobs and economic output generated by the five nightlife subsectors;
• Indirect Impact: The jobs and economic output generated by local businesses that supply goods and
services to the five nightlife subsectors;
• Induced Impact: The jobs and economic output generated as a result of nightlife employees spending their
wages in New York City;
• Ancillary Impact: The jobs and economic output generated from spillover spending related to nightlife
activities. Examples include taxi and For-Hire Vehicles (FHV) taken to or from a nightlife destination and the
non-nightlife spending of tourists visiting NYC specifically for nightlife purposes; and
• Fiscal Impact: The tax revenues generated for New York City and New York State from income, sales, and
business taxes, as well as additional taxes.
• Note: As a key economic metric, employee compensation is isolated and presented as its own
indicator throughout this report
In addition to these types of economic impact, there is another unquantifiable category: nightlife as an economic
catalyst. Major cities such as New York City compete for talent and jobs—and nightlife and cultural opportunities
are two of the differentiating urban amenities that make NYC globally competitive. In a 21st century economy
connected by communications and ease of travel, highly-skilled workers have many choices based on job
opportunities and quality of life. The variety and depth of New York City’s nightlife continues to drive interest and
demand for the city as a place to live, learn, work, and socialize.
Exhibit 3.1: Types of Economic Impact From New York City Nightlife
Nightlife
Consumption
Business-
to-business Indirect Impact
Consumer Direct Impact spend Generated by local
Generated by the businesses that
five subsectors. supply goods and
Consumption
services by the five
Wage Spend subsectors.
Related
Ancillary Spending Induced Impact
Generated from Generated as a result
spillover related to of nightlife employees
nightlife activities. spending their wages
in NYC
Source: Econsult Solutions (2018)
17ECONOMIC IMPACT
Total Economic Impact used to describe the direct impact from the nightlife
industry, while employee compensation is used in
The nightlife industry makes a significant contribution describing the total economic impact of nightlife on the
to employment and economic growth in New York New York City economy.
City. The total economic impact of this industry is
the sum of its direct, indirect, and induced economic The nightlife industry has shown significant growth
impacts, as well as the ancillary spending impacts in jobs and wages over the last five years, outpacing
that are adjacent to nightlife activity. In 2016 (the New York City’s baseline economic growth. The five-
most recent year where standardized datasets were year annualized growth rate (CAGR)7 for jobs in the
available), the nightlife industry supported 299,000 nightlife industry was 5 percent, compared to NYC’s
jobs with $13.1 billion in employee compensation overall job growth rate of 3 percent. At the same time,
and $35.1 billion in economic output. This nightlife wages rose at an annual rate of 8 percent,
economic impact also yielded $697 million in tax compared to the citywide rate of 4 percent.
revenue for New York City.
The average annual wage in the nightlife industry
Direct Economic Impact by Sector was $32,000, with notable disparities among the five
subsectors (explored in the following sections). While
The five subsectors that make up New York City’s
the industry overall has shown growth in total wages,
nightlife industry directly generate economic output
the typical nightlife employee’s salary may not grow at
through revenues from nightlife consumers, and
the same rate as the total.
spending by nightlife establishments on goods and
services. In 2016, the five subsectors directly New York City’s nightlife establishment count exceeds
supported 196,000 jobs, $6.2 billion in wages (or 25,000 and has grown at a rate of approximately 2
$7.4 billion in employee compensation), and $19.1 percent annually between 2011 and 2016. Growth in
billion in economic output.6 Throughout the report, Brooklyn and Queens over that time period has been
wage reported by the Bureau of Labor Statistics is notable, at 5 percent and 3 percent, respectively.
Exhibit 3.2: Direct, Ancillary, Induced, Indirect Impact of NYC’s Nightlife Economy
299,000 $13.1B $35.1B
% 100
25,000
$1.8B $5.1B Indirect Impact
29,000
80 $1.7B
$4.9B Induced Impact
48,000
$2.3B $6.0B Ancillary Impact
60
40
196,000 $7.4B $19.1B
Direct Impact
20
0
Jobs Employee Economic
Compensation Output
Source: Bureau of Labor Statistics (2016), U.S. Census Bureau (2012), IMPLAN (2015), Econsult Solutions (2018)
Columns may not sum due to rounding.
18ECONOMIC IMPACT
Exhibit 3.3: Total Direct Nightlife Jobs and Wage
200,000 196,000 $7
Direct Nightlife Wages ($B)
$6
Direct Nightlife Jobs
150,000 $6.2B $5
$4
100,000
$3
50,000 $2
$1
0 $0
2002
2003
2004
2005
2006
2007
2008
2009
2010
2011
2012
2013
2014
2015
2016
Jobs Wages
Source: Bureau of Labor Statistics (2016), U.S. Census Bureau (2012), IMPLAN (2015), Econsult Solutions (2018)
Exhibit 3.4: Total Nightlife Establishments
5-Year
CAGR
30,000 2011-16
Number of Establishments
25,000 +2%
20,000 2%
15,000
10,000 5%
5,000 3%
2%
0 1%
2002
2003
2004
2005
2006
2007
2008
2009
2010
2011
2012
2013
2014
2015
2016
Staten Island Bronx Queens Brooklyn Manhattan
Source: Bureau of Labor Statistics (2016), U.S. Census Bureau (2012), IMPLAN (2015), Econsult Solutions (2018)
19ECONOMIC IMPACT
The following subsections examine each subsector Job and wage growth were especially significant
and their contributions to NYC’s nightlife economy. in Brooklyn and Queens, where Food Service
establishments have proliferated in recent years.
Food Service Queens showed annualized job growth of 8 percent
Food service—a sector that encompasses full- and and wage growth of 11 percent between 2011 and
partial-service restaurants, cafes, and food trucks—is 2016. Over the same period, Brooklyn’s Food Service
the backbone of NYC’s nightlife industry. Whether establishments grew at an annualized rate of 4 percent;
going out for a long meal with friends, grabbing a
wages grew at an annualized rate of 15 percent.
quick bite before a show, or stopping for pizza in
the late hours, a night out is nearly guaranteed to The average wage was one of the lowest within the
touch Food Service in some way. NYC is home to 72 nightlife industry at $29,700.9 While part of that deficit
Michelin-starred restaurants (all star tiers), more than can be explained by underreported wages and the
any other U.S. city.8 part-time nature of some Food Service jobs, this low
average annual salary represents a real challenge for
In 2016, Food Service supported 141,000 jobs,
the industry.
$4.2 billion in wages, and $12 billion in direct
economic output. The largest portion of NYC’s
nightlife economy is captured by the Food Service
sector, representing 72 percent of jobs and 67 percent
of direct output. With the rising popularity of “dining as
entertainment” and changes to eating habits, from fast
casual to on-demand delivery service to food trucks,
this industry continues to grow. The five-year annual Direct Economic Impact of Food Service
growth rate of this subsector outpaced the nightlife
industry as a whole, with 6 percent job growth and 9
percent wage growth as compared to the industry’s 141,000 $12B
annualized job growth of 5 percent and wage growth jobs economic
of 8 percent. As of 2016 there were 19,400 food output
service establishments across NYC.
Exhibit 3.5: Direct Nightlife Jobs and Wages–Food Service
160,000 $4.5
$4.2B
140,000 $4.0
141,000
Direct Nightlife Wages ($B)
$3.5
120,000
Direct Nightlife Jobs
$3.0
100,000
$2.5
80,000
$2.0
60,000
$1.5
40,000
$1.0
20,000
$0.5
0 $0.0
2007
2008
2009
2010
2011
2012
2013
2014
2015
2016
Jobs Wages
Source: Bureau of Labor Statistics (2016), U.S. Census Bureau (2012), IMPLAN (2015), Econsult Solutions (2018)
20ECONOMIC IMPACT
Bars
Globally, nightlife is synonymous with drinking
establishments such as bars and nightclubs—and
NYC is no different. In total, there were 2,100 bars
and clubs in NYC in 2016. The Bars subsector
generated 13,400 jobs, $492 million in wages,
and $2.0 billion in direct economic output. The
subsector’s five-year annual growth rate also outpaced
the nightlife industry as a whole with 7 percent growth
in jobs and 9 percent growth in wages.
The growth in this subsector has been largely driven
by growth in Brooklyn. Between 2011 and 2016, Direct Economic Impact of Bars
the annualized growth rate for the Bars subsector’s
jobs and wages in Brooklyn were 16 percent and 21
percent, respectively. The typical employee in the 13,400 $2B
Bars subsector earns on average $36,800, a 24 jobs economic
percent higher wage than employees in the Food
output
Service subsector.
Exhibit 3.6 Direct Nightlife Jobs and Wages–Bars
15,000 $600
13,400
Direct Nightlife Wages ($M)
12,500 $500
Direct Nightlife Jobs
$492M
10,000 $400
7,500 $300
5,000 $200
2,500 $100
0 $0
2007
2008
2009
2010
2011
2012
2013
2014
2015
2016
Jobs Wages
Source: Bureau of Labor Statistics (2016), U.S. Census Bureau (2012), IMPLAN (2015), Econsult Solutions (2018)
21Understanding Turnover: Analysis of NYC’s Liquor Licenses
To contextualize the economic analysis the volume of active on-premises (i.e. not takeout) liquor licenses in
NYC was examined, tracking borough and establishment trends. Data were provided by the New York State
Liquor Authority (SLA) in six year increments—2000, 2006, 2012, and 2018.10,11 The City’s total liquor license
count stands at 11,961, with an annualized growth rate of 2 percent.12 Exhibit 3.7 shows the distribution of liquor
licenses by borough and the annualized rate of growth. Further analysis at a license-by-license level showed
interesting trends in turnover over the last two decades. In each six-year period, roughly half of the active licenses
are new. Tracking liquor license serial numbers over time revealed an average retention rate of 44 percent for
licenses after six years and of 22 percent after 12 years. In 2018, the data show a retention rate of roughly 20
percent for all licenses that were active in 2000.
Exhibit 3.7: Number of On-Premise Liquor Licenses in NYC
Annual
Growth
Borough 2000 2006 2012 2018 (2000-2018)
Bronx 610 779 660 628 0.2%
Brooklyn 1,236 1,780 2,119 2,586 4.2%
Manhattan 4,498 5,205 5,621 6,011 1.6%
Queens 1,707 2,137 2,150 2,332 1.8%
Staten Island 361 392 406 404 0.6%
Total 8,412 10,293 10,956 11,961 2.0%
Source: New York State Liquor Authority (2018)
This data takes into account openings and closures over time.
11,961
liquor licenses
2%
annualized
in 2018 growth rate
22While the dataset does not show the age of the 8,412 • 5,856 new licenses were issued since 2006,
active liquor licenses that were active in 2000, it is slightly less than in the previous six year period,
possible to trace the typical success or closure of representing 53 percent of all new licenses in 2012
establishments (using active liquor licenses as a
By 2018
proxy) for those licenses added to the dataset in 2006
and 2012. Exhibit 3.8 illustrates the turnover of liquor • 1,575 of the licenses active in 2000 were active,
licenses across these time periods, with the following a 19 percent retention rate
retention rates:
• 1,312 of the licenses new in 2006 were active,
By 2006 a 22 percent retention rate
• 4,341 of the licenses from the 2000 were active, a • 2,601 of the licenses new in 2012 were still active,
52 percent retention rate a 44 percent retention rate (the same retention
• 5,952 new licenses were issued, representing 58 rate for licenses in the six-year period from 2006
percent of all active licenses in 2006 to 2012)
By 2012 • 6,473 new licenses were issued since 2012—
the most in any of the six-year periods from
• 2,480 of the licenses active in 2000 were active, 2000—representing 54 percent of all licenses
a 29 percent retention rate active in 2018
• 2,620 of the licenses new in 2006 were active,
For further detail on liquor license data at a borough
a 44 percent retention rate
level, refer to the following subsection on “The
Nightlife Economy across New York City.”
Exhibit 3.8: NYC Active Liquor Licenses by Year
11,961
10,956
6,473
10,293 new
5,856
new licenses
8,412 5,952
licenses
new
licenses
2,601
4,341 2,620
1,312
2,480
1,575
2000 2006 2012 2018
Licenses Active in 2000 Licenses Active in 2006 Licenses Active in 2012 Licenses Active in 2018
Source: New York State Liquor Authority (2018), Econsult Solutions (2018)
23ECONOMIC IMPACT
Arts Manhattan’s arts-based nightlife activity accounts for
NYC is a global leader in arts and culture, with 75 percent and 90 percent of the subsector’s jobs and
numerous art galleries, museums, Broadway wages, respectively. That said, Arts establishments
theaters, performing arts spaces, and a historic role remain an essential component of the nightlife industry
as a welcoming center for artists and entertainers. across the city, and have grown at a faster rate outside
Today, many of the city’s storied cultural institutions of Manhattan. In Brooklyn, jobs in the Arts account
incorporate nightlife into their operations by offering for 15 percent of NYC’s total, and have seen an
evening programming, hosting live bands or DJs, annualized growth rate of approximately 10 percent
or providing cocktail and bar services for guests. In between 2011 and 2016. Wages in the Brooklyn Arts
total, the Arts subsector had 1,800 establishments subsector have seen an annualized growth rate of
throughout NYC in 2016. This subsector generated 12 percent. Queens has also seen significant growth
18,300 jobs, $804 million in wages, and $3.1 billion in this subsector with annualized growth rates of 6
in direct economic output. percent for jobs and 7 percent for wages.
Direct Economic Impact of Arts
18,300 $3.1B
jobs economic
output
Exhibit 3.9: Direct Nightlife Jobs and Wages–Arts
18,000 18,300 $1,000
Direct Nightlife Wages ($M)
15,000
Direct Nightlife Jobs
$800
$804M
12,000
$600
9,000
$400
6,000
$200
3,000
0 $0
2007
2008
2009
2010
2011
2012
2013
2014
2015
2016
Jobs Wages
Source: Bureau of Labor Statistics (2016), U.S. Census Bureau (2012), IMPLAN (2015), Econsult Solutions (2018)
24ECONOMIC IMPACT
Venues13 Sports and Recreation
The vibrancy of New York City’s nightlife is fueled New York City offers no shortage of family-friendly
by concert and entertainment venues, independent nightlife, including arcades, amusement venues,
venues, and DIY spaces. As of 2016, there were 2,400 billiards, bowling alleys, and spectator and participatory
establishments in this subsector throughout NYC. sports. This subsector represents the smallest
Venues generated 19,900 jobs, $373 million in component of NYC’s nightlife industry, with 100 total
employee compensation, and $1.2 billion in direct establishments as of 2016. Sports and Recreation
economic output.14 generated 3,900 jobs, $352 million in wages, and
$735 million in direct economic output.
While this is one of the smallest nightlife subsectors in
terms of job volume, the total number of jobs related to Sports and Recreation represents the highest average
Venues has grown at an annualized rate of 3 percent paying jobs within the nightlife sector, averaging
since 2011. While reported wages have grown at a $90,000 in wages in 2016.15 While these jobs
more rapid rate, 9 percent over the same time period, represented slightly less than 2 percent of all nightlife
the average annual wage for workers in this subsector jobs in NYC, their wages represent nearly 6 percent
is just $18,700. As in the case of Food Service, the of the industry’s wage base. Sports and Recreation
low salaries are due (in part) to the part-time nature of wages grew at an annual rate of 5 percent between
several jobs in this sector. 2011 and 2016, which is a slightly lower rate than the
industry (8 percent) but still faster than the citywide
average. Queens has the largest share of Sports and
Recreation-related nightlife jobs (44 percent) and total
wages (50 percent).
Direct Economic Impact of Venues
New York City is home to some of the best sports
19,900 $1.2B teams in the country with world-renowned franchises
and stadiums. In addition to major stadiums and
jobs economic
output
Exhibit 3.10: Direct Nightlife Jobs and Wages–Venues
24,000 $400
$373M
Direct Nightlife Wages ($M)
20,000
19,900
Direct Nightlife Jobs
$300
16,000
12,000 $200
8,000
$100
4,000
0 $0
2007
2008
2009
2010
2011
2012
2013
2014
2015
2016
Jobs Wages
Source: Bureau of Labor Statistics (2016), U.S. Census Bureau (2012), IMPLAN (2015), Econsult Solutions (2018)
25ECONOMIC IMPACT
arenas such as Yankee Stadium, Madison Square
Garden, and Citi Field, NYC is also home to numerous
secondary sports venues (e.g. Heritage Field in the
Bronx, Staten Island’s St. George Stadium, Coney
Direct Economic Impact of
Island’s MCU Park) supporting spectator and nighttime
Sports & Recreation
play across all types of popular sports. In multiple
cases, these sports venues anchor nightlife in the
immediate vicinity, including dining, bars, amusement 3,900 $735M
venues, retail, and exhibits that derive income from the jobs economic
output
crowds attending events.
In addition to traditional recreational activity, electronic
sports or eSports are becoming increasingly Indirect Impact
popular. Several establishments provide playing and
The nightlife industry has an indirect economic impact
viewing amenities for eSports tournaments, such as
on other industries. The core nightlife subsectors
Community Gaming NYC, Waypoint Café, and Alien
engage with suppliers and contractors from other
Gang NYC. In August 2015, Madison Square Garden
industries to procure goods and services. As a result,
was sold out for two straight nights hosting the North
to the extent these transactions happen with local
American League of Legends Championship Series
businesses, these transactions generate jobs, wages,
Finals, the highest level of professional eSports
and output in NYC for the industries that support
league play. Global demand for eSports is expected
nightlife activities. The indirect impact of New York
to grow in the coming years, with 2018 revenues in
City’s nightlife amounts to 25,000 jobs, $1.8 billion
the subsector estimated at $345 million across North
in employee compensation, and $5.1 billion in
America and growing at an annual rate of 27 percent
economic output. The amount of indirect impact and
over the next 5 years.16
the top jobs impacted (as shown in Exhibit 3.12) are
Exhibit 3.11: Direct Nightlife Jobs and Wages–Sports and Recreation
4,500 3,900 $400
4,000 $350
3,500 $352M
Direct Nightlife Wages ($M)
$300
3,000
$250
Direct Nightlife Jobs
2,500
$200
2,000
$150
1,500
1,000 $100
500 $50
0 $0
2007
2008
2009
2010
2011
2012
2013
2014
2015
2016
Jobs Wages
Source: Bureau of Labor Statistics (2016), U.S. Census Bureau (2012), IMPLAN (2015), Econsult Solutions (2018)
26ECONOMIC IMPACT
particular to NYC. The indirect impact on industries the calculated induced value and the distribution of
highly interconnected with hospitality that have greater jobs (Exhibit 3.13) represent the impact of the nightlife
leakage outside of NYC, such as wholesale trade (i.e. industry specifically on the NYC economy.
food distribution) and transportation and logistics, are
Ancillary Impact
not analyzed in this study.
Ancillary impact is derived from additional spending
Induced Impact
on retail, transportation, lodging, and other
Induced impact is generated when people employed expenditures resulting from participation in nightlife
directly within the five subsectors, or people in activities. This spending then translates into
industries impacted by nightlife, spend their wages significant revenues for business owners in New
on local vendors in New York City. When direct and York City. The influx of ancillary spending by nightlife
indirect nightlife employees spend their wages in NYC, consumers has a multiplier effect throughout New
this spending further generates jobs, wages, and York City, supporting 48,000 jobs with $2.3 billion
output within the five boroughs. The induced impact in employee compensation and $6.0 billion in
of New York City’s nightlife amounts to more economic output.
than 29,000 jobs with $1.7 billion in employee
compensation, and $4.9 billion in economic
output. Similar to the indirect nightlife economics,
Exhibit 3.12: Industries Supported by Exhibit 3.13: Industries Supported by
Indirect Spending, by Share of Jobs Induced Spending, by Share of Jobs
Top Industries Percentage Top Industries Percentage
Arts, Entertainment, Health Care and
and Recreation 27% Social Assistance 28%
Administrative and Retail Trade 14%
Support Services 11% Other Services
Professional, Scientific, (Except Public
and Technical Services 11% Administration) 12%
Real Estate and Rental Accommodation and
and Leasing 9% Food Service 12%
Management of Educational Services 5%
Companies and Finance and
Enterprises 7% Insurance 5%
Other Services (except Administrative and
public administration) 4% Support Services 4%
Wholesale Trader 4% Professional,
Accommodation and Scientific, and
Food Service 3% Technical Services 4%
Transportation and Real Estate and
Warehousing 3% Rental and Leasing 3%
Information 3% All other Industries 13%
All other Industries 17% Source: IMPLAN (2015), Econsult Solutions (2018)
Source: IMPLAN (2015), Econsult Solutions (2018)
27ECONOMIC IMPACT
Fiscal Impact and hotel taxes), specifically related to their activities
and spending patterns. In 2016 the total annual
The nightlife industry generates substantial tax
fiscal impact of New York City’s nightlife summed
revenues for New York City and New York State.
to nearly $1.8 billion—approximately $697 million
Nightlife activities increase the local tax base directly
for the City and $1.1 billion for New York State.
by employing workers who pay taxes, and indirectly
via spending by nightlife vendors and employees.
In addition to these taxes, nightlife contributes a
significant portion of other taxes and fees (e.g. liquor
Exhibit 3.15: Fiscal Impact for New York City and New York State
Tax Type New York City ($M) New York State ($M)
Income Tax $268.2 $741.0
Sales Tax $198.6 $232.1
Business Tax $107.9 $105.6
Alcohol Tax $12.8 -
Hotel Tax $109.8 -
Total Tax Revenue $697.3 $1,078.6
Source: IMPLAN (2015), Econsult Solutions (2018)
*Columns may not sum due to rounding.
28“The extended hours of operation
in NYC still make it one of the best
places to go out.“
- NYC Nightlife Consumer
29Driving Nightlife: Calculating the Impact of Nightlife Taxi and FHV Trips
The nightlife and transportation sectors have A comparative analysis of TLC data in 2013 and 2017
complemented each other’s development in recent shows how concentrations of taxi and FHV pick-up
years. Nightlife is instrumental to this sector’s locations at key nightlife times has changed over
profitability and its ability to attract drivers. For-Hire time.17 The maps in Exhibit 3.14 show concentrations
Vehicles (FHVs, which include Uber, Lyft, and others) of increased taxi/FHV activity in areas of Bushwick
have enabled greater access to and within the and Williamsburg in Brooklyn, and Jackson Heights
five boroughs. Therefore, this report includes trips and Astoria in Queens. The proliferation of FHVs has,
taken via taxi and FHV to travel to or from nightlife in part, enabled the above-average nightlife growth in
destinations as part of NYC’s ancillary nightlife. The Brooklyn and Queens. Borough-specific trends in taxi
NYC Taxi and Limousine Commission (TLC) records and FHV use are discussed in greater detail in The
the time and location of all pick-ups for taxis and Nightlife Economy Across New York City section.
FHVs; trips to and from nightlife destinations can be
Looking forward, FHV services will continue to shape
counted by aggregating all trips in a year, subtracting
where future nightlife establishments choose to locate,
airport trips and evening commutes. Approximately 32
and consequently the opportunities for nightlife workers
percent of all taxi and FHV trips are nightlife related.
and consumers. On the other hand, constraints on FHV
The value of those trips was included in the ancillary
services may also limit the potential growth in some
impact of NYC’s nightlife economy.
areas, particularly those neighborhoods with limited
public transportation alternatives.
Of the 317 million taxi and
For-Hire Vehicle rides in New
York City in 2017, an estimated
101 million (32 percent) are
attributable to nightlife.
30You can also read