Tomorrow Together City of Manning Comprehensive Plan 2017-2027 - Santee-Lynches Regional Council of ...
←
→
Page content transcription
If your browser does not render page correctly, please read the page content below

Tomorrow Together
City of Manning Comprehensive Plan
2017-2027
A C K N OW L E D G M E N T S

                              CITY COUNCIL
                                   Julia Nelson, Mayor
                         Clayton Pack, Mayor Pro-tem, District 1
                       Diane D. Georgia, Councilmember, District 2
                        Ervin Davis, Sr., Councilmember, District 3
                       Johnny E. Gordon, Councilmember, District 4
                        Julius Dukes Jr., Councilmember, District 5
                        Sherry A. Welle, Councilmember, District 6

                       PLANNING COMMISSION
                                      William Blair
                                 Louise Gamble-Murray
                                       Peggy Knox
                                      Monica Reed
                                 Pamela Clavon-Brunson
                                       Effie Hilton

                        CITY ADMINISTRATION
                             City Administrator: Scott Tanner
                            Zoning Administrator: Mary Adger
                                  City Clerk: Daun Davis
Prepared for the City of Manning by the Santee-Lynches Regional Council of Governments

                                                    Economic and Community Sustainability Director: Kyle Kelly
                                                               Regional Planner: Susan Landfried
                                                               Community Planner: Jenna Brown

             With assistance of directors and staff from City Departments, the Clarendon County Library, Clarendon School District 2, the
                                          Clarendon County Government, and the Clarendon County Archives

          Thanks also to Charlotte Johnston, Manning Junior High School, Clarendon County Council on Aging, Maree’s Beauty Shop, Merle
          Norman, Clarendon County Chamber of Commerce, Sugar and Spice Fair, Cissy’s at the Studio, Fabulous Nails and Spa, Calla Lily
                    Cafe, Brooks Street Barber, The Shoppe, D&H Bar B Que, Anderson Pharmacy, and the Manning Restaurant.

                                                     Thank you to the citizens of Manning for your participation.

 This document was prepared with the assistance of numerous parties and is intended to be as accurate as possible. Any errors or omissions are unintentional. The data reflected in
this document was selected to be the most accurate representation of the community. If you have corrections or additional information relevant to this document, please submit by
                                                                email to Susan Landfried at slandfried@slcog.org

                                                                                        3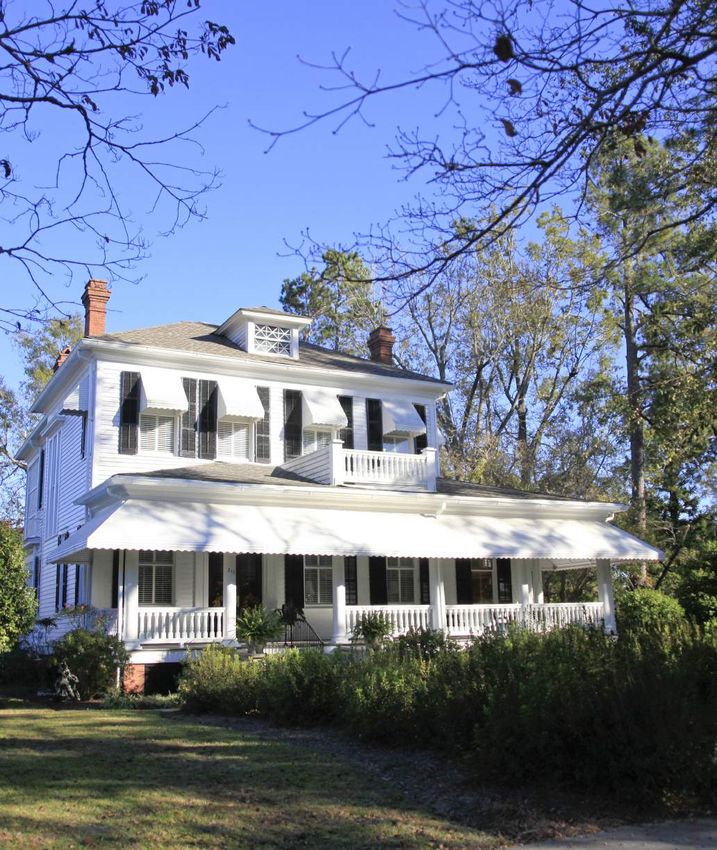
TABLE OF CONTENTS
             Comprehensive Planning Process						1

             Current Conditions Inventory							3
                Regional Planning Influences						5
                A Brief Timeline of Manning’s History					8
                Local Planning Factors								10
                City Governance								13
                Community Character								17
                Demographics									19
                Economic Conditions								24
                Education										25
                Community Assets								28
                Community and Economic Initiatives					31
                Parks and Recreation								33
                Infrastructure and Public Services					36

             Strategic Plan										42
                Vibrant downtown, corridors, and neighborhoods			  45
                Services, opportunities, and amenities for all				 55
                A healthy and safe community						64
                Job opportunities and economic vitality				        72

             Appendix A: Redevelopment Tools						79
             Appendix B: Comprehensive Plan Survey					 80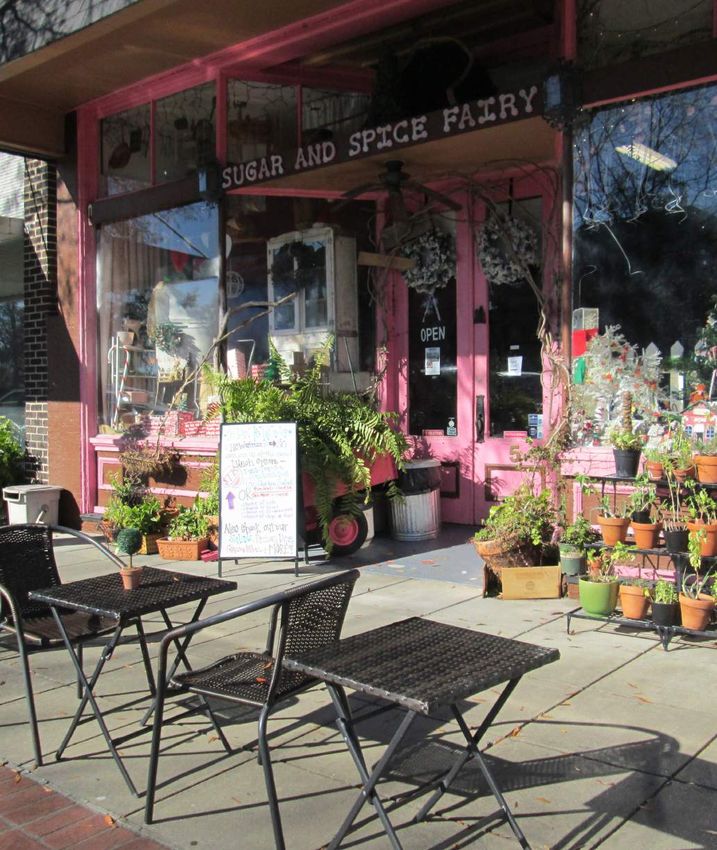
COMPREHENSIVE PLANNING PROCESS
Introduction
The Tomorrow Together Comprehensive Plan is an advisory document that outlines aspirations for Manning's future. The Comprehensive Plan is
a combination of the Current Conditions Inventory, a document that provides an inventory and assessment of various aspects of Manning, and the
Strategic Plan which lays out a series of goals and objectives that will help make Manning a more vibrant and livable place. The Comprehensive Plan
will provide policy guidance, facilitate and coordinate local decision-making, inform residents, land-owners, business-owners, and developers about
Manning and its priorities, and serve as an overall guide for Manning's future development.

This Plan is meant to be flexible and adaptable to changing conditions. The goals and strategies should be reviewed periodically and revised to reflect
any changes in state and federal laws, funding sources, or local governance, as well as the impacts of past decisions, the effectiveness of current
policies, and any changes in the community's vision.

What is a Comprehensive Plan?
A comprehensive plan is a document adopted by a local government’s legislative body that guides an area’s future development. The comprehensive
plan provides the basis for a zoning ordinance which is the legal mechanism used to guide and enforce land use decisions. A comprehensive plan
documents current physical, social, and economic characteristics of a community and provides a vision and series of goals and objectives to guide
community development in the future.

Why do communities develop Comprehensive Plans?
§§ obtain an over-arching view of the community

§§ facilitate and coordinate local decision-making

§§ inform residents about the community

§§ involve residents and stakeholders in local decision making

§§ guide landowners and developers about the community and its goals

§§ comply with the South Carolina Local Government Comprehensive Planning Enabling Act of 1994

                                                                            1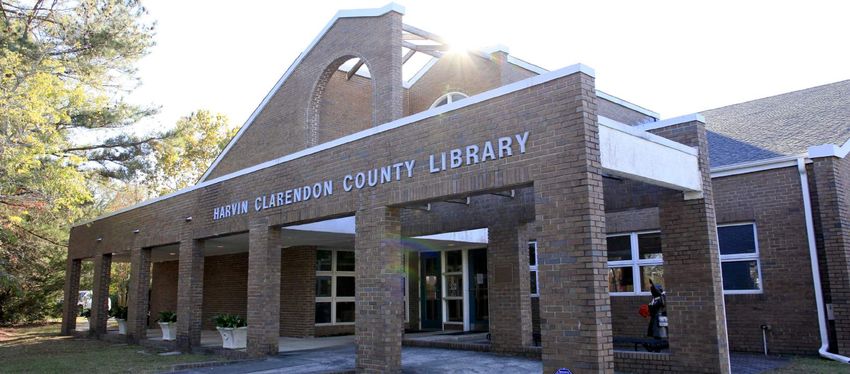
Planning Process
                The Foundation phase involves a Kick-Off Meeting, interviews with city officials and community stakeholders, and
  Foundation    data collection regarding the City’s current conditions. This phase provides the majority of information for the Current
                Conditions Inventory which serves as foundation for the remaining phases of the plan.

  Visioning,    Visioning, Goals, and Objectives uses the Current Conditions Inventory to inform residents about the community and
  Goals, and    propel the visioning and goal-creation process. Throughout this stage, residents offer their ideas for goals and objectives
  Objectives    that guide the development of the Strategic Plan.

                The Synthesis phase brings together all of the information obtained from the public into several themes. These themes
   Synthesis    and their accompanying goals and objectives are developed in collaboration with local officials and published in the
                Strategic Plan.

                The Draft Plan phase is the review of the complete Comprehensive Plan: the Current Conditions Inventory and Strategic
   Draft Plan
                Plan. This phase will also include the development of an implementation strategy for the identified goals and objectives.
                The plan is reviewed by the City’s Planning Commission eventually leading to a recommendation to City Council.

   Final Plan   The Final Plan includes any changes recommended during the feedback session on the Draft Plan and adoption by City
                Council.

                                                          Community Engagement
                                                          One of the primary goals of the Tomorrow Together community engagement
                                                          process was to capture diverse input about Manning's future. An array of
                                                          residents and community actors including youth, seniors, businesses, City
                                                          officials, partner organizations and agencies, and various other stakeholders
                                                          participate at different venues in the City. In addition to hearing from residents
                                                          and stakeholders at listening sessions at the Harvin Clarendon Public Library,
                                                          staff hosted planning activities at Manning Junior High School with a group
                                                          of more than 20 students and met with seniors at Manning Senior Center.
                                                          Additionally, surveys were distributed to local businesses, churches, schools,
                                                          and civic institutions and were available online on the Planning Manning
                                                          Facebook page, the City of Manning website, Main Street Manning's Facebook
                                                          page, City officials' social media accounts, the Santee-Lynches Regional
                                                          Council of Governments website, among various other outlets.

                                                              2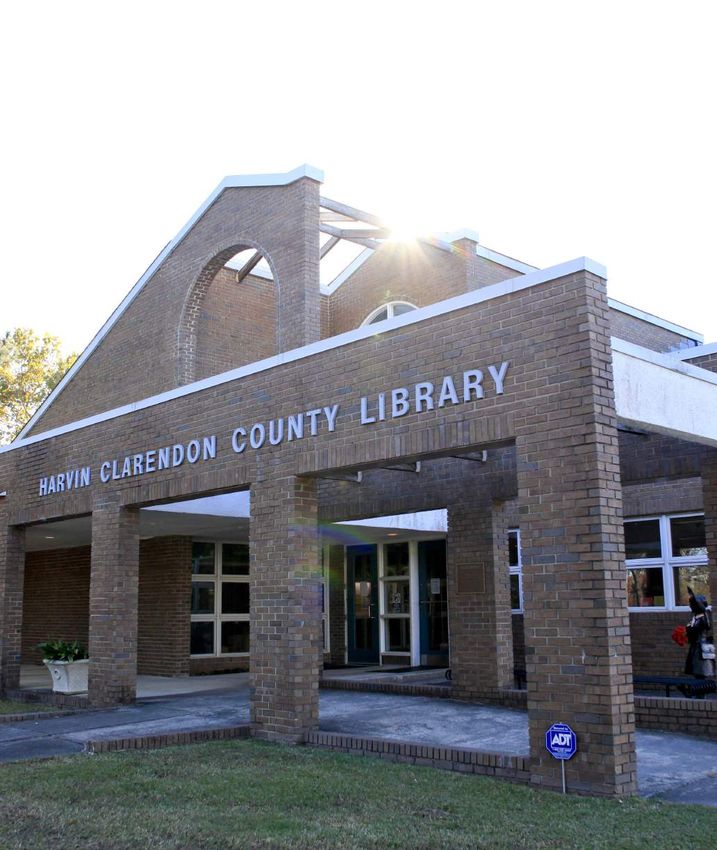
Current Conditions Inventory

           3
Introduction
The Current Conditions Inventory provides readers with information about the City of Manning’s current conditions on a wide variety of topics.
The information presented in the document came from a variety of sources including representatives from different city and county departments,
community stakeholders, and data sources such as the U.S. Census Bureau.

The Current Conditions Inventory was published and distributed during the Community Engagement portion of the planning process. The document
offers readers a comprehensive overview of the City of Manning and gives an objective account of current conditions that informed creation of goals
and objectives for the future. This Inventory was the first stage in the Comprehensive Planning process.

                                                                         4
REGIONAL PLANNING INFLUENCES
SANTEE-LYNCHES LONG RANGE TRANSPORTATION PLAN
The Santee-Lynches Long Range Transportation Plan identifies ways to invest resources to enhance the transportation system in Clarendon,
Lee, Kershaw, and Sumter Counties. The plan focuses on four major components of transportation: (1) Roadways and Automobile Travel, (2)
Active Transportation, (3) Transit, and (4) Freight, Emergency Response, and Aviation. Within each component, fiscally constrained projects
fall under the following categories: (1) Intersection Improvements and System Preservation, (2) System Improvements (including Freight System
Improvements), (3) Safety, (4) Planning, (5) Active Transportation (Bike and Pedestrian), and (6) Public Transit (Capital Improvements). The
Long Range Transportation Plan is updated every five years and refreshed regularly.

SANTEE-LYNCHES GREEN INFRASTRUCTURE PLAN
The Green Infrastructure Plan for the Santee-Lynches region will be completed in 2017. The plan will provide local governments with an overview of
the existing green infrastructure network in the Santee-Lynches region and an array of strategies that would preserve the intact habitats, improve water
quality, enhance outdoor recreational spaces, among various other strategies that align with local stakeholders’ interests and concerns. For more detailed
information about the Green Infrastructure Plan, refer to the Santee-Lynches Green Infrastructure Plan.

SANTEE-LYNCHES HAZARD MITIGATION PLAN
The Hazard Mitigation Plan, developed by local mitigation committees and the Santee-Lynches planning staff, details mitigation initiatives and actions
that the area jurisdictions intend to perform to reduce the impacts of future disasters. As part of this process, the different jurisdictions identified
potential hazards. Manning’s most likely hazards include (1) flooding, (2) hurricane/tropical/coastal storm, (3) tornadoes, (4) winter storms/freezing/
ice/snow, (5) severe storms/wind/hail/lightning, and (6) drought/heat. Moreover, Manning has a number of critical facilities that are essential for
evacuation, electric utilities, water and sewer, and fire. For more specific information about hazards and action plans, refer to the Santee-Lynches
Hazard Mitigation Plan.

SANTEE-LYNCHES COMPREHENSIVE ECONOMIC DEVELOPMENT STRATEGIES
The Comprehensive Economic Development Strategy (CEDS) contributes to effective economic development in communities and regions through
a locally-based economic development planning process. Economic development serves as a means to engage community leaders, leverage the
involvement of the private sector, and establish a strategic blueprint for regional collaboration. The CEDS provides a foundation by which the public
sector, working in conjunction with other economic actors (individuals, firms, industries), creates an environment for regional economic prosperity.
As an Economic Development District designated by the U.S. Economic Development Administration (EDA), every five years, Santee-Lynches must
review the strengths and weaknesses of our region, identify opportunities to advance economic vitality, and encourage the development of new
strategies through public and private partnerships. The scope of this strategy includes economic development needs and objectives for Clarendon,
Kershaw, Lee, and Sumter Counties.

                                                                              5
CLARENDON COUNTY COMPREHENSIVE PLAN
The Clarendon County Comprehensive Plan, last updated in 2008, has the goal of encouraging economic development, job creation, agricultural
land preservation, compact development, and natural resource protection through proactive planning. The plan highlights a need to improve area
water and sewer systems and to shift away from the reliance of septic tanks as they are a potential threat to Lake Marion. Additionally, the plan
highlights several aspects related to housing noting that there is (1) an excess of land zoned residential in the county for the current and projected
population, (2) a need to develop more unique land use policies for resort areas along Lake Marion, and (3) a need to ensure that there are sites for
manufactured housing. Manning’s Comprehensive Plan is being developed with Clarendon County’s plan in mind to ensure the goals and objectives
are complimentary and beneficial to both the City and County.

SANTEE-LYNCHES WATER QUALITY MANAGEMENT PLAN
The Santee-Lynches Regional Council of Governments is responsible for maintaining a Regional Water Quality Management Plan to encourage and
facilitate development and implementation of region-wide wastewater management plans. Authorized under Section 208 of the U.S. Clean Water
Act, these requirements are carried out by 1) documenting current and future wastewater infrastructure needs; 2) identifying regional policies that
guide the wastewater infrastructure permitting process; and 3) tracking plan modifications to allow for transparency and public involvement. A
Environmental Planning Advisory Committee meets regularly to review the plan and recommend adjustments and improvements to preserve and
enhance the region’s water quality.

                                                                           6
City of Manning, Clarendon County
Sumter
Sumter County Manning
Bl
Clarendon
ac
k
County
Ri
ve
r
301
521
Manchester
State Forest
15
Po Alcolu
cot
Pinewood al
Paxville ig
o
Ri
ve
r
Manning
Manchester
State Forest
Sparkleberry
Swamp
521
301
Clarendon County
Bennett’s Bay Kingstree
Heritage Preserve County
15
La
Summerton
ke
Davis Station
521
M
ar
io
n
Kingstree
Wyboo
Santee National
Wildlife Refuge Santee River
0 2.5 5 Miles
Lake Marion
7A BRIEF TIMELINE OF MANNING’S HISTORY
1855 1856 1861 1865 1890s 1895 1911
The plat for Moses Levi built A South Carolina Union soldiers, Railroad access, A fire destroys A building boom
Manning was the first store in legislative act led by General lumber, and multiple stores began with the
filed at the Manning on the established the Edward Potter, agriculture along Boyce construction of
Sumter County corner of Boyce City of Manning. set fire to much contributed Street. An many buildings
Courthouse and Brooks Street of Manning’s to Manning ordinance including
downtown becoming a requiring new the current
prosperous town. buildings near Clarendon
the courthouse County
be constructed Courthouse and
of fireproof the Old Manning
materials is Library.
established
1915 1928 1940s 1989 2007 2009 2015
A tornado struck The slogan Manning Hurricane Hugo Manning began Downtown During the
the downtown “Matchless for rebounded struck Manning a downtown Manning was historic flooding
district resulting Beauty and after the Great damaging many revitalization designated as a of October
in the loss of Hospitality” was Depression with buildings and process which National Historic 2015, Manning
three lives and selected in a the expansion leaving the city included burying District. experienced
$150,000 in slogan contest for of existing without water power lines, significant
damage. Manning. businesses and and electricity for establishing residential and
creation of new several days. historic street commercial
businesses. lights, and damage.
widening
sidewalks.
89
Manning Asset Map
Brooks St
Church St
Boyce
St
Bondary St
Mill St
ins St
Hugg
Legend
r
tD
nse
Su
Park
Park
Park
Park
Park
Park
Park
Park
Library
Park
Library
Park
Library
Library
Library
Library
Library
Library
Library
Civic Institution
Civic
Civic Institution
Library
Civic
Civic
Civic
Civic
Civic
Civic
Institution
Institution
Institution
Institution
Institution
Institution
Institution
Cultural
Civic Facility
Institution
Cultural Facility
Cultural
Cultural
Cultural
Cultural
Cultural
Facility
Facility
Facility
Facility
Cultural Facility
Cultural
Fire
Facility
Facility
Department
Cultural Facility
Fire Department
Department
Fire Department
Fire
Fire
Fire
Fire
Department
Fire Department
Fire Department
Fire Department
Department
Grocery Store
Department
Grocery Store
Grocery Store
Grocery Store
Grocery
Grocery Store
Regional Comparisons
Grocery Store
Store
Grocery Store
Walk Score
Grocery
Grocery
Health Store
Health Facility
Facility
Store
Health
Health Facility
Health Facility
Medical Facility
Health Facility
Health Facility
Health Facility
Facility
Post Office
Health
Post
Post
Post
Office
Facility
Office
Post Office
Office
Post Office
Post
Post
Post
School
Post
School
School
School
Office
Office
Office
Office
School
School
School
School
School
School
Somewhat Livability
AARP City
Score
Walk Score
Livability
Index 44 Walkable
Some errands can be
accomplished on foot
Sumter
Camden
50
52
26
65
60 26 Bishopville
Summerton
43
40
60
46
Housing Health Hartsville 48 69
Affordability and access Prevention, access, and quality
41 20 Lake City 56 71
Kingstree 47 62
Neighborhood Opportunity
Access to life, work, play Inclusion and possibilities
60 57 *The AARP Livability Index is a way to measure community livability based on seven different categories.
The score is out of 100 points and is an average of the seven categories. The data used in the calculation
Environment Engagement comes from over 50 different sources of data including 40 metrics that measure the current livability of a
Clean air and water Civic and social involvement community and 20 policies that account of steps communities are taking to become more livable.
44
*
The highest livability
**Walk Score measures how walkable a neighborhood is by analyzing walking routes to nearby amenities
score for small cities
and looking at population density, block length, and intersection density. Points are based on the distance
Transportation in the U.S. is 70 is La
to amenities in categories such as retail and dining. If it takes longer than 30 minutes to walk to a place in
Safe and convenient options Crosse, Wisconsin.
a category, no points are given.
10L O C A L P L A N N I N G FA C T O R S
EXISTING LAND USE
One of the first steps in the planning process is to understand the existing land uses of an area. This not only conveys
information about past and current planning and development, but serves as the framework to guide future planning
decisions.
Existing Land Use
Churc h St
Brooks St
Boyce
4%
St
Boundary St
Mill St
ins St
Hugg
35%
set
Dr 59%
Sun
2%
Residential
Commercial/Office
Industrial
Open Space
111996 City of Manning Comprehensive Plan
Manning’s current Comprehensive Plan was adopted in April 1996 to guide the city’s decision making process and to comply with South
Carolina’s State Enabling Comprehensive Planning Act. As part of this plan, a Comprehensive Land Development Plan was developed in addition
to a zoning ordinance that would enable the implementation of the Comprehensive Land Development Plan. The plan noted that many facets
of the existing environment seem to have come about in a random manner and therefore established objectives and standards related to land use,
housing, residential development, commercial development, industrial development, recreation and open space, and natural resources that would
help guide land development. The plan also addressed sewer and water infrastructure, transportation infrastructure, neighborhood beautification,
and economic development.
City of Manning Zoning Ordinance
Following the 1996 Comprehensive Plan, Manning adopted a Zoning Ordinance. The Zoning Ordinance was revised in 2002 and updated in 2006.
Other changes have been made in the years since as a result of zoning amendments and annexations.
Current Zoning Map
Church St
Brooks St
Boyce
St
Boundary St
Mill St
ins St
Hugg
Dr
set
Sun
Legend
Core Commercial
Development District
General Commercial
General Residential
Heavy Industrial
Light Industrial
Neighborhood Commercial
Office Commercial
Planned Unit Development
Single Family Residential
12Wetlands Environmental Considerations
The City is bordered to the northwest by the Pocataligo Swamp and
to the southwest by the Ox Swamp. The location of the wetlands
and the 100-year floodplain is critical when considering land use
regulations and potential development projects.
Churc h St
Brooks St
Boyce
St
Boundary St
17
Mill St
ins St
Hugg
Dr
set
% of Manning
Sun
covered by
wetlands
Legend
Wetlands
Manning Boundary
Floodplains
9.7
Church St
Brooks St
Boyce
St
% of Manning
Boundary St
Mill St
Hugg
ins St
in the
100-year
r
se tD
Sun
floodplain
Legend
Inside 100-year floodplain
Outside 100-year floodplain
Manning Boundary
13C I T Y G OV E R N A N C E
CITY GOVERNMENT
§§ Manning has a Mayor-Council form of government comprised of six council members representing the city’s six
districts and a mayor who is elected at large.
§§ The council members and mayor serve four-year terms and are not subject to any term limits.
§§ The City Administrator oversees the day to day operations of all departments (Administration, Public Works,
Police, Fire, and Judicial) and administers the policy and budget set by City Council.
§§ There are 60 full time employees and approximately 15 part-time employees.
Manning Voting Districts City Organizational Structure
Manning City Council
3 City Administrator
4
Police Fire
1 5
2
Administration Public Works Judicial
6 Finance Planning Human Resources
14BUDGET
§§ The City’s total budget for Fiscal Year 2017 is $7.7 million.
§§ General Fund: $4.5 million
§§ Utility Fund: $3.2 million
§§ The city’s property tax millage rate is 187.9 mills.
§§ The City currently has approximately $28 million in outstanding debt. The overwhelming majority of this debt is related to the recent construction
of a new wastewater treatment plan, financed by a United States Department of Agriculture Loan.
§§ Manning’s revenues come from local property tax, a local option sales tax, a solid waste fee, a business license tax, and franchise fees.
GENERAL FUND
Revenues Expenditures
where the General Fund money comes from how the General Fund in spent
Interest (1%)
Transfers (2%) Legislative (3%)
Judicial (4%)
Other (1%)
Taxes and Fees
for Other Services (12%) Administrative (15%) Streets and
Sanitation (29%)
Taxes (45%)
Fines/Forfeitures (1%)
Non-Departmental
Operations (3%)
Downtown
Development (1%)
License Fees (18%)
Fire (14%)
Police (31%)
Intergovernmental 13%)
Franchise Fees (7%)
15Taxable and Tax-Exempt Properties
Church St
Brooks St
Boyce
St
Boundary St
ins St
Mill St
Hugg
Dr
set
Sun
33%
67%
Legend
Tax-Exempt
Taxable
Tax-Exempt properties include all government properties (municipal, county, state, and federal), non-government properties such as the hospital, and properties for disabled
veterans. This data is based on the most recent tax assessments and may not include parcels that have been recently annexed by the City.
16Annexed Properties Since 2003
§§ Between 2003 and December 2016,
Manning annexed 369.76 acres.
72.1% (266.76 acres) of the annexed
land is not taxable.
§§ Annexed properties include:
§§ Manning Wastewater Treatment
Plant
§§ Lawrence Manning Academy
§§ Manning High School
§§ Manning Junior High School
Brooks St
Church St
Boyce
§§ Manning Early Childhood Center
St
§§ Walmart
Bondary St
Mill St
§§ Since 2014, development that is
in s St
Hugg
adjacent to the city must be annexed
if Manning is providing water and
tD
r sewer service.
nse
Su
Legend
Annexed Parcels
17COMMUNITY CHARACTER
TREE CITY USA
§§ Manning has a been a “Tree City USA” city for 16 years.
§§ The “Tree City USA” program encourages sound urban forestry management through organizing around four
standards: having a tree board or department, having a tree ordinance, spending at least $2 per capita on urban
trees, and celebrating Arbor Day.
HISTORIC ASSETS
§§ Manning has two historic structures and one historic district listed in the National Historic Register.
§§ Hannah Levi Memorial Library: This structure was completed in 1910 and is an interpretation of the Classical
Revival style. It was the first public library in the county. The library was added to the National Register in 1979
and is now home to the Clarendon County Archives.
§§ Alderman’s 20 Stores in One: This two-story red brick building was built in 1919 and is an example of early
twentieth-century commercial architecture. It was Clarendon County’s first mall. It was added to the Register in
1994 and still serves as a commercial building.
§§ Manning Commercial Historic District: Listed in the National Register in 2010, the Manning Commercial
District is a mostly intact collection of buildings built between 1890 and 1958. Anchored by a 1909 Neo-Classical
courthouse, 46 of the buildings maintain the architectural integrity that contribute to the historic district’s
character.
18DEMOGRAPHICS
POPULATION Population Change, 1980-2010
34,971
§§ M
anning is the largest urbanized area in Clarendon County serving as home to 32,502
4,108 people. The City has a population density of 1,487 people per square mile. 28,450
27,464
§§ M
anning’s population was as its highest population in 1980 with 4,746 people
residing in the City.
§§ S ince 1980, Manning’s population has declined by 13.4% with a loss of 638 people.
The city’s population has fluctuated growing modestly between 2000 and 2010
gaining nearly 100 residents.
4,746 4,428 4,025 4,108
§§ W
hile Manning has declined in population since 1980, Clarendon County has had a 1980 1990 2000 2010
27.3% growth rate, growing by 7,507 people between 1980 and 2010.
Clarendon County Manning
§§ F
or the same 1980-2010 period, the state of South Carolina had a 48.2% growth rate
adding over 1.5 million people to the state’s population.
DIVERSITY
§§ M
anning is mainly comprised of two racial groups. 62.4% of residents identify as
Black/African-American and 32.5% identify as White. In Clarendon County, 46.2%
of residents identify as white while 49.7% of residents identify as Black/African-
American
§§ 1.9% of the population in Manning identify as Hispanic/Latino. In Clarendon
County, 2.6% of the population identifies at Hispanic/Latino.
§§ M
ost of Manning’s population is native born with only 3.5% of the population being
foreign born.
The majority of the demographic figures are from the 2010 Census. Figures that are not from the 2010 Census are from the 2006-2010 U.S. American Community Survey 5-Year Estimates. This survey combines 60 months
of collected data, has a large sample size, and is considered reliable. However, there is still a margin of error for the data because it is an estimate that does not count every individual or household. The figures stated in this
document are intended to be accurate and any errors are unintentional.
19AGE
§§ P
eople over the age of 65 comprise 16.7% of the city’s population. This is similar to the surrounding county
where 16.8% of the population is over 65, but higher than the state where 13.7% of the population is over 65.
39.2 §§ M
anning, with a median age of 39.2, is younger than the rest of Clarendon County which has a median age of
41.4 but is older than the State of South Carolina which has a median age of 37.9.
Manning Population, 2010
Median Males - 1,861
90 and over
Females - 2,247
Age 85 to 89
80 to 84
75 to 79
70 to 74
65 to 69
60 to 64
55 to 59
50 to 54
45 to 49
40 to 44
35 to 39
30 to 34
25 to 29
20 to 24
15 to 19
10 to 14
5 to 9
Under 5
150 100 50 0 0 50 100 150
HOUSEHOLDS
54.7 §§ There are 1,538 household in Manning. A household is defined as an occupied housing unit that includes all
persons who occupy that unit. Occupants do not have to be related to form a household.
§§ Th
e average household size for Manning is 2.6, which is comparable to Clarendon County (2.5), and South
% of the Carolina (2.6).
population is
female §§ 2 7.8% of Manning’s households are single-person households compared to 24.1% for county-wide and 28.0%
statewide.
§§ 3 3.7% of Manning households have children under 18 years which is higher than Clarendon County (27.1%)
and South Carolina (26.9%).
The majority of the demographic figures are from the 2010 Census. Figures that are not from the 2010 Census are from the 2006-2010 U.S. American Community Survey 5-Year Estimates. This survey combines 60 months
of collected data, has a large sample size, and is considered reliable. However, there is still a margin of error for the data because it is an estimate that does not count every individual or household. The figures stated in this
document are intended to be accurate and any errors are unintentional.
20INCOME
§§ The median income for the residents in Manning is $26,176, which is approximately $7,000 lower than
Clarendon County’s median income of $33,066 and significantly lower than South Carolina’s median income of
$43,939 (ACS 2010 5-Year Estimates).
§§ Manning’s Gini index score is 0.48, compared to 0.44 and 0.46 for the county and state respectively. The
$26,176 Gini index is a measurement of income distribution between 0 and 1. A score of 0 represents perfect income
equality while a score of 1 represents perfect income inequality (ACS 2010 5-Year Estimates).
Median
Income EDUCATION
§§ 31.3% of Manning’s population over the age of 25 has less than a high school diploma which is higher than
Clarendon County where 24.6% of the population has less than a high school diploma (ACS 2010 5-Year
Estimates).
§§ 19.9% of Manning’s population over the age of 25 has an Associate’s Degree or higher while 19.0% of
Clarendon County’s population has an Associate’s degree or higher (ACS 2010 5-Year Estimates).
Educational Attainment, 2010
0 500 1000 1500 2000 2500 3000
Legend
Less than 9th grade Some high school, High school Some college, no
no diploma graduate degree
Associate’s degree Bachelor’s degree Graduate or
professional degree
The majority of the demographic figures are from the 2010 Census. Figures that are not from the 2010 Census are from the 2006-2010 U.S. American Community Survey 5-Year Estimates. This survey combines 60 months
of collected data, has a large sample size, and is considered reliable. However, there is still a margin of error for the data because it is an estimate that does not count every individual or household. The figures stated in this
document are intended to be accurate and any errors are unintentional.
21HOUSING
1,902 §§ Th
ere are 1,902 housing units in Manning, a
increase of 175 units from 2010.
housing units
in Manning §§ 8 8.5% (1,684) of the units are occupied, which is
similar to 89.8% of occupied units in 2000.
§§ 53.7% of those occupied units are owner-
occupied which is significantly lower than the
61.7% of units being owner-occupied in 2000.
§§ 8 1.9% of the housing units are single-family
housing structures, including both attached
and detached structures (ACS 2010 5-Year
88.5% Estimates)
§§ The median house value in 2010 was $96,900 which is higher than the median house value in Clarendon
of all housing County at $89,100. However, both are significantly lower than the median house value for South Carolina at
units are $134,100 (ACS 2010 5-Year Estimates).
occupied §§ Manning is slightly more affordable for renters compared to Clarendon County and the state. The median gross
rent in Manning is $561, which is nearly 29.6% of the median household income for Manning. For the county,
the median rent is $533 (28.2% of median household income) and $701 for state (29.6% of median household
income) (ACS 2010 5-Year Estimates).
§§ F
or housing units with a mortgage, 20.2% of household income goes to housing costs. This is higher than the
County and the State respectively, where the median monthly owner costs are 23.9% and 23.0% of household
income (ACS 2010 5-Year Estimates).
Median gross rent §§ Since 2011, the Clarendon County has issued 11 residential building permits and 10 commercial building
permits in the City of Manning.
$561
The majority of the demographic figures are from the 2010 Census. Figures that are not from the 2010 Census are from the 2006-2010 U.S. American Community Survey 5-Year Estimates. This survey combines 60 months
of collected data, has a large sample size, and is considered reliable. However, there is still a margin of error for the data because it is an estimate that does not count every individual or household. The figures stated in this
document are intended to be accurate and any errors are unintentional.
22City of Manning Building Permits, 2011-2016
Legend
1 mile approximate buffer
Commercial Building Permits
Residential Building Permits
City of Manning
Clarendon County Building Permits, 2011-2016
Legend
Commercial Building Permits
Residential Building Permits
City of Manning
Clarendon County
23ECONOMIC CONDITIONS
§§ There are 2,525 primary jobs in Manning. A primary job is defined as the highest paying job for individual
workers for that year.
§§ Healthcare and Social Services organizations are the largest employers in Manning employing over 870 people
in 2014, accounting for nearly 35% of all primary jobs in Manning.
§§ Public Administration and Education Services are the second and third largest sectors employing 292 people
and 204 people, respectively.
§§ Nearly half of the primary jobs earn between $1,251 and $3,333 per month.
§§ Nearly 30% of primary jobs earn $1,250 per month or less and only 22% of job bring in more than $3,333 per
month.
§§ There is a significant difference between male and female workers with female workers making up 66% of the
workforce. A similar differences exists in the county where females comprise 59% of the workforce.
§§ McLeod Health Clarendon is the largest employer in Manning employing approximately 500 people.
Clarendon County Disabilities is the second largest employer with 160 employees.
§§ 39.9% of the jobs in held by Manning residents are within 10 miles of the
city. 20.2% of workers travel more than 50 miles for work, mostly to the
northwest towards Sumter and Columbia.
Employed in Live in and
§§ The majority of people who work in Manning live outside the city’s Manning, employed in
but live Manning
35% boundaries. outside
§§ 2,282 people are employed in Manning, but live outside the city.
of primary §§ 243 people are both employed in and live in Manning.
Live in Manning,
but employed
jobs in outside
healthcare §§ 891 people live in Manning but are employed outside the city.
and social
services
Source: U.S. Census Bureau, Center for Economic Studies, 2014. http://onthemap.ces.census.gov
24E D U C AT I O N
PRE-K - 12 EDUCATION
Bla
Clarendon School District 2 Wh
§§ Children in Manning are primarily served by Clarendon School District 2. His
Tw
§§ Approximately 3,000 students make up the racially diverse student body of Asi
Clarendon School District 2 schools Am
Na
§§ The district employs 353 total staff members, 163 of which are teachers. 57% of
Un
the district’s teachers have their master’s degrees.
Black or African American White
§§ Since the 2015-16 school year, the district has spent nearly $1.7 million on Hispanic/Latino Two or more races
American Indian or Alaskan Native
Asian
Unclassified
technology in addition to the $25 million Race to the Top grant the district Native Hawaiian or other Pacific Islander
received in 2013. This investment provided each student with a personal device.
79.1 §§ The district recently invested in a new Field House at Manning High School and spent $400,000 on front office
renovations at the high school to improve safety and accessibility for students and visitors.
Manning High
School 2016 §§ The district offers an array of unique opportunities:
graduation rate §§ An Associate of Arts Degree program in partnership with Central Carolina Technical College
There has been an §§ Montessori program at Manning Early Childhood Center
overall increase in §§ Science, Technology, Engineering, and Mathematics (STEM) programs at all schools
the graduation rate §§ Project Lead the World Engineering curriculum
§§ Advanced Placement courses in Art and Geography
since 2012.
Laurence Manning Academy
§§ Laurence Manning Academy is an independent PreK-12 Christian school that serves over 1,000 students.
§§ Tuition for students in grades 1-12 is $3,252 plus additional fees for materials, technology, etc.
§§ The school employs over 80 teachers and has a 13:1 student-teacher ratio.
§§ The school offers multiple diploma tracks: Basic Diploma, College Prep Diploma, and Honors Diploma
25Public Schools in Manning, 2016
PRE-KINDERGARTEN Manning Early Childhood Center
- 1ST GRADE 2759 Raccoon Road
Manning, SC 29102
2ND GRADE - Manning Primary School
Manning Primary School 3RD GRADE 125 North Boundary Street
Church St
Manning, SC 29102
Brooks St
Manning High School
Boyce St
Manning Elementary School
Manning Elementary School
Manning Early Childhood Center
4TH GRADE -
Mill St
St
311 West Boyce Street
Boundary
Manning Junior High School
s St
6TH GRADE
Hu
ggin
Manning, SC 29102
Dr
et
ns
Su
7TH GRADE - Manning Junior High School
8TH GRADE 1101 W. L. Hamilton Road
Manning, SC 29102
Manning High School
9TH GRADE -
2155 Paxville Highway
12TH GRADE
Manning, SC 29102
HIGHER AND CONTINUING EDUCATION
F.E. DuBose Career Center
§§ The F.E. DuBose Career Center, located just north of Manning, provides educational opportunities for high
school and college students as well as students attending Clarendon County’s Adult Education program.
§§ The campus is managed by Central Carolina Technical College.
§§ The campus offers a variety of programs including Cosmetology, Culinary Arts, Health Science, and Early
Childhood Education.
§§ Approximately 420 students are currently enrolled
§§ F.E. DuBose has an annual budget of $1.1 million.
2627
COMMUNITY ASSETS
                         CLARENDON COUNTY PUBLIC LIBRARY
45,000                   §§ Manning hosts the sole branch of the Clarendon Public Library – the Harvin Clarendon County Library.

on-site materials        §§ Th
                             e Library is home to 45,000 items which include books, audiobooks, and movies, but the library has access
                            to over three million items as a member of the South Carolina Library Evergreen Network Delivery System (SC
                            LENDS).

                         §§ Th
                             e Library also uses Hoopla, a digital service that allows library patrons to check out up to 10 digital materials
                            (movies, TV shows, music, audiobooks, e-books, and comics).

                         §§ Th
                             e Library sponsors programs including a weekly story time, monthly book club, summer reading programs,

3 million                   and other events. The library also participates in sponsoring guest speakers, exhibits, and other informational
                            events.

materials accessible     §§ O
                             n an average day, approximately 200 to 250 people visit the library. One-third of those visitors come to use
to the library has          the available computers while 2/3 of visitors check out materials, ask questions, use the free WiFi, or take
through SC Lends            advantage of other library services.

                         §§ Nearly 50% of library patrons are children and teens.

                         §§ The library receives $640,000 annually as part of Clarendon County’s budget.

                         §§ Th
                             e library circulates at least 45,000 materials annually in the community or as a member in the SC LENDS
                            partnership.

50%                      §§ There are eight full-time staff members and four full-time staff members.

                         §§ Th
                             e Clarendon Bookmobile is operated out of the Harvin Clarendon Library and travels to different locations
of library patrons are      in Manning and around Clarendon County throughout the week.
children and teens
                         §§ Th
                             e library is open six days a week including two evenings until 8:00pm. They facility is open for a total of 51
                            hours weekly.

                                                               28
CLARENDON COUNTY ARCHIVES
The Clarendon County Archives are located in the former Manning Library and hold papers, newspapers, photos, books, maps, and other artifacts
that tell the history of Clarendon County.
CLARENDON COUNTY HISTORICAL MUSEUM
The Clarendon County Historical Society Museum is located in Manning and celebrates the long history of Clarendon County. There are exhibits
about Francis Marion, Clarendon’s sports history, and other local history.
WELDON CENTER
The Weldon Center is part of the old Manning High School and hosts numerous events throughout the year for the residents of Clarendon County.
Also, the Clarendon County’s Sports Hall of Fame and an art gallery are at the center
MANNING COMMERCIAL HISTORIC DISTRICT
Manning’s historic district dates to 1855 when the city was initially laid out. The area consists of 63 commercial buildings which together form
an example of a small-town commercial district of an agricultural center. The architecture including unique entrances and decorative ornamental
molding is found throughout the district. Some of the most valuable buildings include the Levi Building, Alderman’s 20 in One Store, the Clarendon
County Courthouse, and the People’s Bank and Trust Building.
29Pond Bluff to St Stephen’s Church Marion Militia Needs Swamp Fox at Ox Swamp
SWAMP FOX MURALS - MANNING, SC
Bronze Marion Statue The Swamp Fox Battle of Wyboo Swamp Citizen Soldier
Ambush at Half-Way Swamp Welded Marion Statue
Francis Marion Reflections
30COMMUNITY AND ECONOMIC INITIATIVES
RETAIL ACADEMY 101
In 2016, the City of Manning announced an initiative to attract new retail establishments to the City and to
Clarendon County which would help enhance the quality of live, expand the tax base, and improve job growth
in the area. As part of this initiative, the City partnered with a consultant that helped provide the tools and
knowledge necessary to contact and recruit sustainable retailers. Services provided by the consultant included
educational sessions on commercial real estate industries and marketing strategies, custom demographic
research, a retail gap analysis, a marketing guide, and a list of the top prospects for the area. This effort also
included an annual conference where Manning was able to market itself to potential investors.
RETAIL ACADEMY 102
At the end of 2016, the City of Manning was awarded a grant allowing them to continue pursuing a retail
recruitment initiative. Retail Academy 102 will provide additional training that will better prepare City staff and
representatives to recruit businesses and conduct tailored meetings with potential businesses. The training will be
accompanied by updated marketing and retail information for the area and at a regional and national level. Staff
will also participate in several conferences and retailer networking events where they can use the strategies and
information gained during the training.
MAIN STREET MANNING
Manning belongs to Main Street South Carolina, a program that promotes downtown and commercial district
revitalization. Manning’s Main Street program takes a different approach and focuses on the entire city, rather
than just downtown. The program which is part of the city government, promotes city-wide revitalization,
supports local businesses, and builds community.
In order to promote revitalization, Main Street Manning has helped organize a number of events and promotions:
§§ Band and BBQ on Brooks Street §§ Ice Cream Socials
§§ Women of Main Street §§ Movie in the Park
§§ Trick or Street §§ Scarecrows on Main
§§ Merry Elves of Manning §§ Check Manning First retail campaign
§§ Popsicle Socials
Main Street Manning also sponsors a façade grant program in which the selected applicant receives up to $4000
per year to improve a building’s façade. Since its inception in 2008, there have been 20 applications and nine
completed projects. The City has awarded $18,000 in grant money for these projects.
3132
PA R K S A N D R E C R E A T I O N
Local       Acres                    PARKS
Cities      per 1000                     §§ There are approximately nine acres of parkland in Manning (not including the Pocataligo Nature Walk area)
            residents                       across six parks.
Camden         34.17
Bishopville     23.9                     §§ The City also owns Pocataligo Park, located just north of the city limits. The park is 63 acres. The park features
Hartsville     18.66                        a 1,296 foot boardwalk that traverses through the swamp. However, parts of the boardwalk have collapsed or
                                            fallen into disrepair making it inaccessible.
Manning        17.87
Sumter          11.5               §§ There are 17.87 acres of parkland per 1000 residents. Without including Pocataligo Park, there are 2.3 acres of
Lake City       4.69                  parkland per 1000 residents.
                          Gibbons Street Park             Bellwood Park                    Church Street Park

                          240 Gibbons Street 		                     770 Lawson Street                		    Intersection of North Church Street
                          Manning SC 29102                          Manning SC 29102                       and East Rigby Street
                          Facilities: playground, picnic shelter,   Facilities: playground                 Facilities: gazebo
                          open fields
    Memorial Street Park                      Rex Josey Park and Will                 Lula Clark Gardens                        Pocataligo Park
                                              Harvin Tennis Courts                                                              (partially closed)

    130 Memorial Street        		             309 North Lee Street		                  309 North Lee Street 		                   US-301 just north of Manning
    Manning SC 29102                          Manning SC 29102                        Manning SC 29102                          Facilities: picnic tables
    Facilities: playground, basketball        Facilities: playground, tennis courts   Facilities: benches, walking path
    courts
                                                                                      33
Manning Parks
Manning Cemetery
Rex Josey Park
Pocataligo Park
Brooks St
Churc h St
Boyce
St
City of Manning Forest
Boundary St
J.C. Britton Park
Mill St
(Clarendon County Park) ins St
Hugg
Dr
set
Sun
Lula Clark Gardens
Bellwood Park Gibbons Street Park Church Street Park Memorial Street Park
34Proximity to Parks in Manning
Cost Distance Map
Rex Josey Park
Memorial Street Park
Church St
Brooks St
Boyce Church Street Park
St
Boundary St
Mill St
ins St
J.C. Britton Park Hugg
Bellwood Park
Dr
set
Sun
Legend
Parks
Green Spaces
Manning Boundary
Gibbons Street Park Proximity to Parks
< 500ft
500 - 1,000ft
1,000 - 1,500ft
1,500 - 2,000ft
2,000 - 2,500ft
2,500 - 3,000ft
3,000 - 4,000ft
4,000 - 5,000ft
This map used a simplified park accessibility analysis to show the access to parks based on park points of entry based and potentially walkable paths (roads). This map can help identify areas where it is difficult to walk to a park.
35INFRASTRUCTURE AND PUBLIC SERVICES
TRANSPORTATION
§§ There are approximately 47 miles of roadway in Manning, all of which are managed by the South Carolina
Department of Transportation (SCDOT) or Clarendon County.
§§ Street Classification
Street Classification §§ Principal Arterials: These roads provide long-distance, continuous routes between urban areas. They typically
have higher speeds and high traffic volumes.
3% Principal
Arterials
§§ Minor Arterials: These are continuous routes within urban areas that are usually home to commercial and
institutional land uses.
§§ Collectors: Collectors are shorter roads that gather traffic from smaller streets and deliver it to and from
3% Minor
Arterials
arterials.
§§ Local: These are usually short in length, have low speeds, and have traffic control tools like stop signs or
signals. Residential land use is mostly along local roads.
13% Collectors
§§ The City has two bridges, one that crosses a tributary to the Ox Swamp and one that crosses a tributary to the
81% Local
Roads
Pocataligo Swamp. Both bridges are in good condition.
§§ While Interstate 95 does not run through Manning, it is a major access point for the city as there are three
interchanges within four miles to the city.
§§ The Santee-Wateree Regional Transit Authority has one route that connects Manning, Summerton, Paxville,
Pinewood, and Sumter. The route runs once in the morning and a return route in the afternoon.
Santee-Lynches Long Range Transportation Plan Projects Affecting Manning
Safety (i.e. enhanced signing, marking, widening Widening
shoulder) §§ US-521 from SR-30 to Williamsburg County Line
§§ SR 261 from US-301 to SC- 260
Intersections
System (i.e. bridge replacement, resurfacing) §§ US-521 at SC-261
§§ SC 261 from SR-63 to US-301 §§ I-95 at SC-261
§§ US 521 from SR-81 to SR -141 §§ US-521 at Bloomville Rd
§§ SC-260 at Haseldon Rd
36Pavement Quality(of roads evaluated) 2015 Traffic Crash Map
N Church St
N Brooks St
Brooks St
Churc h St
Boyce
St W. Boyce St
Boundary St
Mill St
S. Boundary St
ins St St
Hugg ggins
W Hu
S Church St
Dr
set
Sun
Dr
se t
Sun
Good Roads 8.3 miles (23%)
Fair Roads 12.3 miles (33%) Legend
Car Crash
Pedestrian or
Poor Roads 16.1 miles (44%) Bicycle Crash
Source: SC Department of Transportation Source: SC Department of Transportation
3738
WATER,                      Manning Water and Sewer Lines
                                    SEWER, AND
                                    UTILITIES                                                               301

                                    §§ The City of Manning
                                    manages nearly 600 miles
                                    of sewer lines and almost
                                    2200 miles of water
                                    lines that extend into                                            521

                                    Clarendon County.
                                                                                         261

§§ In addition to residents in Manning, the City provides
   water to Paxville and Alcolu. The city can also serve
   Summerton in emergency situations.

§§ Manning currently pumps 1.1 million gallons of
   water per day to serve the City’s residents and parts of
   Clarendon County.

§§ The City has invested $23 million dollars in a new
   Wastewater Treatment Plant in Manning with the goal of
   becoming a regional wastewater provider.
                                                                                                260

                                                                                                  Legend
§§ Manning currently treats between 700,000 and two                                301

                                                                                                      Water System
   millions gallons of wastewater per day depending on the                                            Sewer System
   season. They have a capacity under the current permit to                                           Manning Boundary

   treat 2.5 million gallons per day. When the expansion of
   the Wastewater Treatment Plan is complete, the City will
   have a capacity of five million gallons per day.

§§ Water and Sewer services employ 11 people. Sanitation
   services employ 5 people.

§§ Manning previously had a recycling program, but due
   to lack of participation, there is no longer a recycling
   program.

                                                                    39
FIRE
Manning Fire Department First Responder
§§ There are six full time fire Calls, 2012-2016
fighters in Manning including
the Chief of Fire. There are Call Amounts
eight part-time fire fighters 69
and 45 volunteer fire fighters,
44
the majority of whom live 41 40 36
within a five-mile radius of
Manning.
§§ The Department currently has an Insurance Service Office
(ISO) rating of 4. (ISO is on a scale of 1-10 with 1 being the
2012 2013 2014 2015 2016
best possible score.) The ISO rating represents the overall
effectiveness of a department and can help determine fire Call Locations
insurance premiums for property owners in Manning.
§§ In order to improve the rating, the City would need to
improve staffing and build a better training ground.
§§ Medical calls in the city were relatively stable between 2012
and 2015, but rose dramatically in 2016.
§§ Structure fires have been consistent or decreased since 2005.
Brooks St
Churc h St
Boyce
St
§§ The average time it takes for a fire engine to arrive at a
Boundary St
structure fire is three minutes. Hugg
ins St
Mill St
§§ The Fire Department has five emergency equipment
Dr
vehicles: Sun
set Legend
First Responder
§§ A 2000 1000-gallon pump fire engine Call Locations
§§ A 1996 1000-gallon pump fire engine Concentration of calls
High
§§ A 2006 100-foot ladder truck
§§ A 1986 reserve engine
§§ A 1998 first responder vehicle
Low
40POLICE
§§ The Manning Police Department current employs 16 full-time police officers including the Chief of Police, two
investigators, and 13 patrol officers.
§§ There are three reserve officers who serve between 60 and 90 hours every three months.
§§ Manning’s crime rates have declined by 15% since 2013.
§§ The Police Department currently has 21 vehicles including patrol cars, investigators’ cars, the Chief ’s vehicle,
and equipment trucks. The fleet allows for every officer to have a take-home car. These vehicles usually need to
be replaced every five to six years.
§§ The Department’s goal is to purchase two new patrol cars annually in order to consistently replace older
vehicles.
41Strategic Plan 42
Introduction
The Strategic Plan is the synthesis of the goals and objectives that were identified during the “Foundation” and “Visioning, Goals, and Objectives”
phases of the planning process. Using information from the Current Conditions Inventory and the community feedback, this section offers four goals
and a series of objectives and strategies that can will help make Manning a more vibrant and livable community.

Plan Organization
The Strategic Plan is organized around four goals:
1. Vibrant downtown, corridors, and neighborhoods
2. Services, opportunities, and amenities for all
3. A healthy and safe community
4. Job opportunities and economic vitality

Under each of those goals is a series of interconnected objectives and strategies that address the priorities established throughout the planning process.
The objectives identify the specific areas of focus or targets that support the implementation of the over-arching goal. Each of the objectives contains
multiple action-oriented strategies that support the successful implementation of Tomorrow Together. At the end of each goal section is a series of
indicators that the City can use to track progress on the strategies. Additionally, there is an Implementation Matrix at the end of each goal section
which specifies the time-frame for each strategy. There are four time-frames: Short-term (1-3 years), Medium-term (4-7 years), Long-term (7-10
years), and Ongoing.

Using the Indicators
Accompanying each of the goals is a set of indicators that can be used to track progress on each of the strategies. These indicators are not
comprehensive and do not necessarily align to a specific strategy, but are still useful in tracking overall progress.

The indicator tables include the following columns:

   •   Indicator: the topic that the indicator will measure
   •   Geography: the geographic area that the indicator is assessing
   •   Method: how the indicators will be measure
   •   Baseline: Baseline data for the most recent year available (when available)
   •   Target: the general trend that will help Manning accomplish the goals set forth in Tomorrow Together

Supporting data accompanies each Indicator group and can be used as a way to track how Manning is changing over time, it but does not have a
baseline from which to change or general desired direction or trend.

                                                                            43
SC Comprehensive
Goals Topics Addressed
Plan Elements
• Growth management • Economic Development
• Land use • Housing
1
• Neighborhoods • Land Use
Vibrant downtown, corridors, • Downtown • Priority Investment
and neighborhoods • Economic development
• Infrastructure
• Cultural resources
• Parks and recreation
• Housing • Cultural Resources
2
• Community resources • Community Facilities
• Cultural resources • Transportation
Services, opportunities, and • Community services • Priority Investment
amenities for all • Government
• Transportation
• Community health and wellness • Natural Resources
3
• Community facilities • Community Facilities
• Resilience and hazard mitigation • Priority Investment
A healthy and safe community • Transportation
• Environmental quality
• Sustainability
• Government
• Economic development • Economic Development
4
• Jobs and employment • Transportation
• Education and workforce training • Priority Investment
Job opportunities and • Transportation
economic vitality
*The Population element is addressed in
the Current Conditions Inventory.
44You can also read