ISSUES PAPER 14 | JANUARY 2017
←
→
Page content transcription
If your browser does not render page correctly, please read the page content below
ADDING TO
THE DIVIDEND,
ENDING THE
DIVIDE #3
ISSUES PAPER 14 | JANUARY 2017
CONTENTS
OVERVIEW                                                                         4
    A CITY OF 8M IN 2056: BUSINESS AS USUAL WON’T DO                             4
    ADDING TO THE SYDNEY DIVIDEND                                                5
    ENDING THE DIVIDE IN A REBALANCED SYDNEY                                     6
    SYDNEY AND THE NEW NATIONAL NARRATIVE ON CITIES                              7
PART 1: ADDING TO THE DIVIDEND                                                   8
    THE NATIONAL ECONOMIC IMPORTANCE OF SYDNEY                                   8
    SYDNEY’S MOMENTUM CONTINUES                                                  11
    SYDNEY STANDS OUT – AND HAS COME A LONG WAY SINCE 2012/13                    11
PART 2: ENDING THE DIVIDE                                                       12
    WESTERN SYDNEY ON THE MOVE….                                                12
    BUT THE JOBS GAP REMAINS                                                    12
    MEASURING SYDNEY’S DIVIDE WITH EFFECTIVE JOB DENSITY                        14
    GROSS VALUE ADDED                                                           15
    LABOUR PRODUCTIVITY                                                         16
    INCOME DIVIDE                                                               17
    EDUCATION DIVIDE                                                            17
    HEALTH DIVIDE                                                               18
    KEEP ON KEEPING ON …                                                        19
PART 3: KEY CITY TRENDS                                                         20
    COMPACT SYDNEY AND SPRAWLED SYDNEY                                          20
    THE RE-URBANISATION OF THE ECONOMY AND THE RISE OF INNOVATION DISTRICTS     21
PART 4: A DUAL DEVELOPMENT STRATEGY FOR THE TWO SYDNEYS                         22
OUTCOMES TO ADDRESS THE DIVIDE                                                  23
    INNOVATION DISTRICTS                                                        23
    A MORE WALKABLE SYDNEY IS AN ECONOMIC STRATEGY                              23
    A MORE WALKABLE SYDNEY IS A HEALTH STRATEGY                                 24
    MODAL SHIFT TO COUNTERACT SPRAWL AND SPATIAL INEQUITY                       26
    POOR MOBILITY MEANS POOR SOCIAL MOBILITY                                    27
    EXPAND THE RAIL NETWORK                                                     28
    INCREASING EFFECTIVE JOB DENSITY                                            30
    THE ‘30-MINUTE SYDNEY’: FROM MOBILITY TO ACCESSIBILITY                      30
    TOWN-CENTRE RENEWAL AND THE BENEFITS OF ‘DENSITY DONE WELL’                 32
POLICY INITATIVES TO REDUCE THE DIVIDE                                          33
    THE VERTICAL FISCAL IMBALANCE                                               33
    LEARNING FROM THE US?                                                       33
    ENTER THE CITY DEAL                                                         33
    CITY DEALS AND CITY SHAPING INFRASTRUCTURE                                  34
    VALUE CAPTURE, USER CHARGES AND FUNDING ‘CITY FOLLOWING’ INFRASTRUCTURE     35
    CITY GOVERNANCE                                                             36
CONCLUSION                                                                      37

2                                                                       COMMITTEE FOR SYDNEY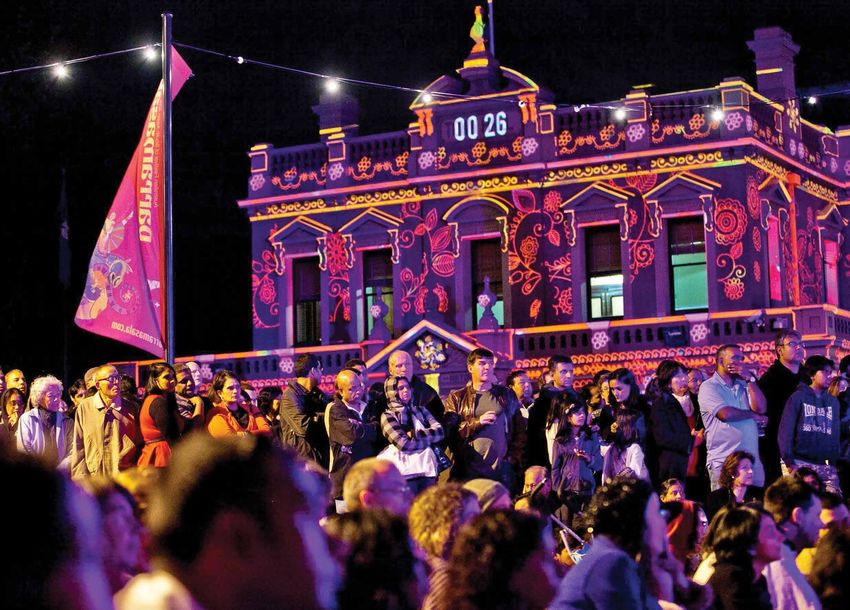
TABLE OF FIGURES
 FIGURE 1.   PERCENTAGE OF AUSTRALIAN JOBS GENERATED IN NSW AND SYDNEY            8
 FIGURE 2. SYDNEY’S GDP GROWTH                                                     9
 FIGURE 3. SYDNEY’S SHARE OF AUSTRALIAN GDP                                        9
 FIGURE 4. SYDNEY’S GROWTH INDUSTRIES                                             10
 FIGURE 5. LABOUR PRODUCTIVITY                                                    11
 FIGURE 6. ACCESS TO KNOWLEDGE JOBS                                               13
 FIGURE 7. NUMBER OF RESIDENTS THAT CAN BE REACHED
           WITHIN 30-MINUTES BY PUBLIC TRANSPORT                                  14
 FIGURE 8. MAPPING SYDNEY’S EFFECTIVE JOB DENSITY                                 15
 FIGURE 9. MAPPING SYDNEY’S GROSS VALUE ADDED (GVA)                               16
 FIGURE 10. MAPPING SYDNEY’S LABOUR PRODUCTIVITY                                  16
 FIGURE 11. INCOME BY POSTCODE 2013/14                                            17
 FIGURE 12. AVERAGE NAPLAN YEAR 9 READING SCORE BY SYDNEY LGA                     17
 FIGURE 13. OCCURRENCE OF HIGH BODY MASS ATTRIBUTABLE DEATHS BY SYDNEY LGA        18
 FIGURE 14. OCCURRENCE OF DEATHS ATTRIBUTABLE TO
            CARDIOVASCULAR DISEASE BY SYDNEY LGA                                  18
 FIGURE 15. AMOUNT OF HOSPITALISATIONS CAUSED BY TYPE II DIABETES BY SYDNEY LGA   19
 FIGURE 16. DIFFERENT STREET PATTERNS AFFECT HEALTH OUTCOMES                      25
 FIGURE 17. URBAN DENSITY VERSUS ROAD SUPPLY                                      26
 FIGURE 18. LAND USE IMPACTS ON TRANSPORT EMISSIONS                               28
 FIGURE 19. THE COMMITTEE’S VISION FOR AN INTEGRATED
            WESTERN SYDNEY RAIL NETWORK                                           29
 FIGURE 20. TOTAL LAND AREA BY EFFECTIVE JOB DENSITY (PERCENTILE)                 31

ADDING TO THE DIVIDEND, ENDING THE DIVIDE 3                                            3
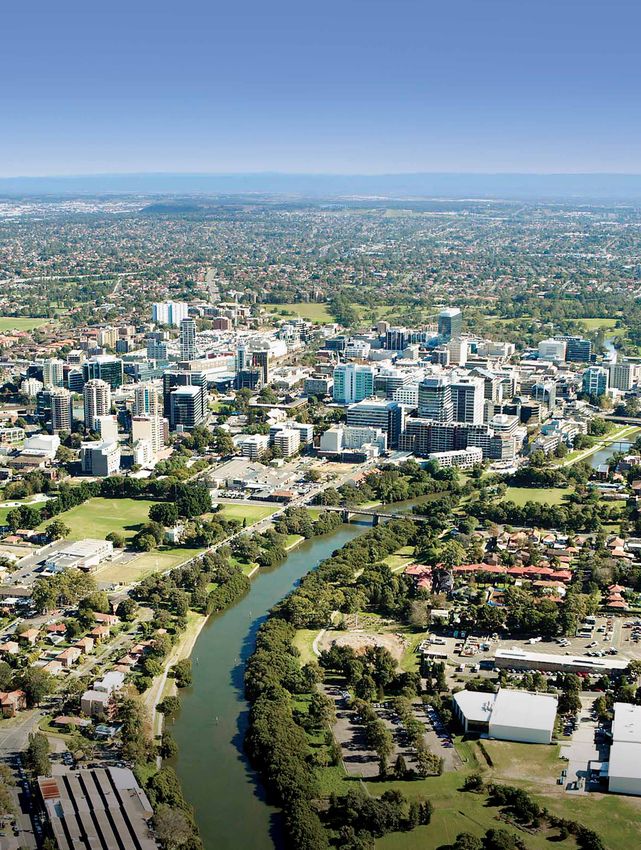
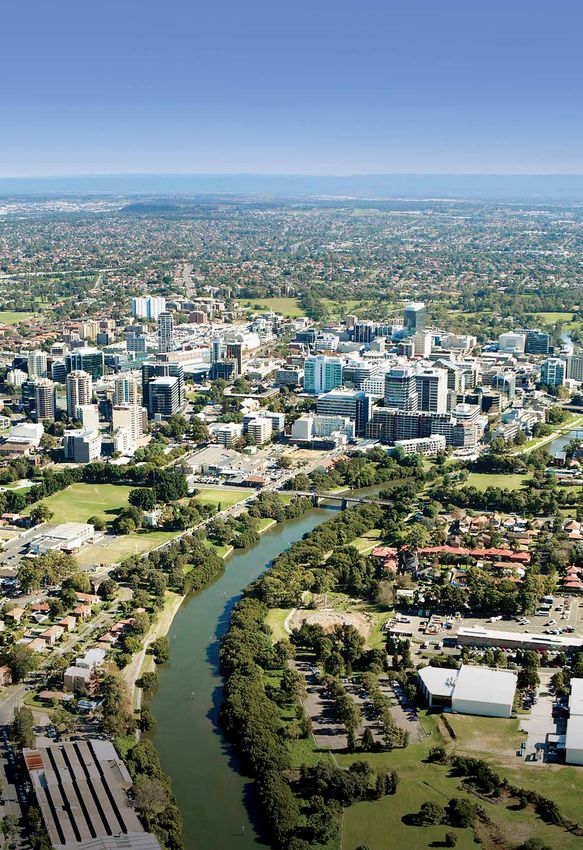
OVERVIEW

Image provided by Parramatta City Council

This is the third edition of ‘Adding to the                   A CITY OF 8M IN 2056: BUSINESS
Dividend, Ending the Divide’ published by                     AS USUAL WON’T DO
the Committee for Sydney. Two underlying                      By 2056 Sydney’s population is forecast to reach reach 8
factors inform this series:                                   million – the same as London’s population today. In that
Sydney is adding to Australia’s dividend.                     context, the Committee for Sydney asks: what opportunities
Sydney’s economic contribution to Australian wealth and       should we look to exploit and what interventions should
productivity has increased significantly in the last five     we pursue that might help realise not just a bigger Sydney,
years and remains vital to the nation as it shifts from a     but a better Sydney? How do we use the wealth coming
resources-based growth model to one based on services         from growth to invest in the infrastructure, especially public
and centred in cities.                                        transport, which will better integrate all parts of Sydney?
                                                              In particular, how do we overcome the great structural
To succeed, Sydney must reduce the divides within             divide in Sydney, namely the economic performance of, and
our city. At the same time, there are serious challenges of   community outcomes in, Western Sydney?
inclusive growth and spatial and intergenerational equity
in the Sydney model of development.                           ‘Adding to the Dividend, Ending the Divide’ both analyses
                                                              the current performance of Greater Sydney and suggests
Sydney’s growth and momentum are integral to the              practical ways to improve the city’s productivity, liveability
success of the state and its communities. With over 60%       and equity. Sydney will not stop growing, so the challenge
of the state’s population and 70% of its GDP, Sydney’s        is to ensure a city for all in which growth is inclusive and the
‘dividend’ is not confined to Sydneysiders. What happens      benefits are shared both spatially and inter-generationally.
here matters to all.                                          A business as usual approach to Sydney will not do.

4                                                                                                  COMMITTEE FOR SYDNEY
ADDING TO THE SYDNEY                                                         Sydney’s strength in these sectors is increasingly of regional
 DIVIDEND                                                                     significance, making it a powerful attractor of global talent
                                                                              and investment, and a major hub in the Asia Pacific region.
 The ‘dividend’ is the contribution of Sydney’s high                          Sydney is regularly ranked in the top 20 cities globally for
 productivity to national economic well-being. Adding to                      commercial real estate investment2, is ranked 8th globally in
 this dividend via effective Government policy, investment                    terms of its current momentum3 and currently has a high
 in urban infrastructure and civic reform is a matter of                      overall benchmarked position in relation to a wide range of
 national importance.                                                         key urban performance indicators and comparable global
 The evidence presented in this Issues Paper shows that                       cities. As global cities expert Greg Clark said in a recent
 Sydney’s economic momentum, trending strongly since                          report for the Committee: Sydney is “Australia’s financial
 2011, increased in the 12 months to the end of 2016, as                      and corporate centre” and, crucially, “the only city in the
 did its contribution to national wealth. Although some                       Southern Hemisphere that combines the business and
 predictions suggested a possible peak of the growth cycle                    intellectual prowess of an established global city with world
 in 2015/16 – with uncertainties in the international economy                 class liveability – the features of a new world city”.4
 and a possible reduction in housing production – Sydney
 has remained on its impressive growth path in terms of
 GDP, population and housing construction. Although a
 correction or a slow-down in the next 12 months is possible,
 Sydney is not predicted to return to the low growth
 pattern experienced in the first decade of this century.
 This economic expansion will be matched by a growing
 population that will see Greater Sydney almost double in
 number of residents over the next 40-50 years.
 While all Australian capital cities are wealth-generators,
 Sydney remains ‘first amongst equals’. It is Australia’s
 number one city in terms of labour productivity and
 contribution to national GDP.1 As the nation transitions
 away from resources to a more urban and services-based
 knowledge economy, Sydney will play an increasingly
 crucial role as the engine of national success. It is already
 the national hub of key sectors including financial services,
 professional and business services, ICT/digital services,
 media, education and the creative and cultural industries –
 and continues to be the tourism gateway for the nation.

                                                                              2   JLL Australia, Investment Intensity Index, March 2016, 2016, http://www.jll.com/
                                                                                  Research/Investment%20Index%202016%20FINAL.pdf?d263a005-e006-
                                                                                  4ae8-a289-fd8735754219
                                                                              3   JLL, City Momentum Index 2016, 2016, http://www.jll.com/research/165/city-
                                                                                  momentum-index-2016
                                                                              4   Committee for Sydney, Issues Paper 13: First Amongst Equals? Benchmarking
 1   Rawnsley, T., Sydney Productivity Performance, 2016, SGS Economics,          Sydney’s Performance, August 2016, http://www.sydney.org.au/wp-content/
     https://www.sgsep.com.au/publications/sydneys-productivity-performance       uploads/2015/10/CfS-Issues-Paper-13-First-Amongst-Equals.pdf

ADDING TO THE DIVIDEND, ENDING THE DIVIDE 3                                                                                                                      5
ENDING THE DIVIDE IN A                                                                Clearly there have been significant investments and policy
REBALANCED SYDNEY                                                                     innovations for Western Sydney since the first ‘Adding to
                                                                                      the Dividend, Ending the Divide’. But this Paper reinforces
While we draw attention to Sydney’s economic                                          the fact that the jobs gap in Western Sydney remains a
dynamism and contribution, we also highlight the need                                 fundamental challenge. On current trends, most of the new
to understand that the city has problems of affordability                             housing in Sydney will be west of Parramatta while most of
and intergenerational equity. Of course, these are the                                the jobs growth will be east of it, particularly those higher
kinds of challenges that attend growth and economic                                   value jobs in the knowledge and innovation economy7. This
success in most global cities. However, Sydney is now                                 economic divide must be redressed, along with the different
one of the least affordable cities in the world. The average                          health and educational outcomes between Western and
home price in Sydney now exceeds $1 million, which is                                 Eastern Sydney.
12.2 times the median household income of the city. This
ratio has been rising; dwellings in Sydney are becoming                               Of course what we mean by ‘Western Sydney’ is, in a
less affordable over time as growth in wages slows – it took                          sense, on the move. The GSC has designated Parramatta
9.8 times the median household income to buy a home in                                as the new ‘Central City’ of Sydney’s metropolitan area
2014 and 6.0 times in 20015. Using another measure, the                               and identified its special role for both Western Sydney and
Rental Affordability Index, many parts of Sydney are not                              Sydney as a whole8. While Parramatta has clearly shifted
considered affordable for rental properties. For key service                          from being the ‘next big thing in Sydney’ to ‘happening now’
workers, such as teachers, nurses and retail workers, to                              it is by no means ‘done’ – nor is its contribution to moving
rent anywhere within 15 to 20 kilometres of the jobs-rich                             the economic fulcrum of Sydney westward anywhere near
Sydney CBD requires more than 50% of their incomes.                                   fully realised. For the good of the West, this new ‘Central
Similarly, Sydney has almost no affordable renting stock                              City’ of Sydney needs to continue to be a focus of policy
for low-income earners located east of Blacktown6. This is                            innovation and investment, until the job is completed.
a spatial challenge of a city divided East to West in terms                           A London analogy might be relevant here: the growth of
of economic productivity and social outcomes. We are                                  Canary Wharf in East London did not prevent development
pleased that the Greater Sydney Commission has picked                                 at Stratford or Woolwich in the wider region, and indeed
up this theme and we will maintain our emphasis on the                                was the basis of further investment and new transport links
need to rebalance Sydney and improve outcomes in its                                  going eastwards to those places. The additional benefit
less socio-economically advantaged regions as part of the                             of the new Western Sydney airport means that over time
overall strategy to raise the performance and productivity of                         the Badgerys-Penrith-Blacktown-Parramatta -Liverpool-
Greater Sydney as a whole.                                                            Campbelltown segment of Sydney will experience
                                                                                      economic uplift from an accumulation of significant public
                                                                                      and private investments and initiatives – and from more
                                                                                      than one direction. There is a critical mass of policies,
                                                                                      projects and investments building there.

5   Janda, M, Housing costs in Australia second only to Hong Kong, ABC Online,
    25 January 2016, http://www.abc.net.au/news/2016-01-25/housing-costs-in-          7   O’Neill, P, Addressing Western Sydney’s jobs slide, The Centre for Western
    australia-second-only-to-hong-kong/7111490                                            Sydney, Western Sydney University, 2016, p.16.
6   ABC, 40% of households locked out of rental affordability; housing stress worst   8   Greater Sydney Commission, Greater Parramatta and the Olympic
    in Sydney, 24 November 2015, http://www.abc.net.au/news/2015-11-24/sydney-            Peninsula: Our True Centre, the Connected Unifying Heart, October 2016,
    rents-most-unaffordable-in-australia/6967664                                          greatersydneycommission.nsw.gov.au/~/media/GPOP-Vision-311016.ashx

6                                                                                                                                     COMMITTEE FOR SYDNEY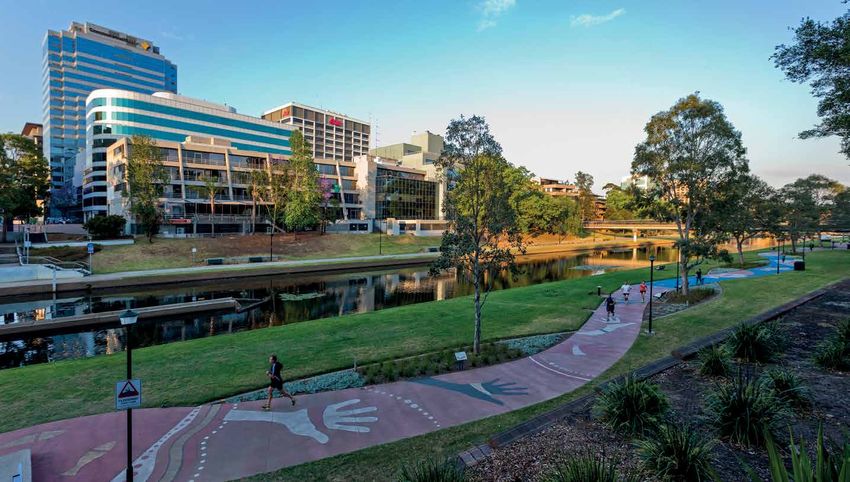
REAL Festival: Image provided by Penrith City Council

 SYDNEY AND THE NEW NATIONAL                                            represents the first step on the path to an even stronger and
 NARRATIVE ON CITIES                                                    more accountable model of metropolitan governance.

 This Paper comes at a time when the contribution of                    We have also strongly supported – and again played
 Australian cities to the nation’s wealth and well-being is             our part in nurturing – the new federal approach to City
 finally being recognised at the federal level. The national            Deals. This new approach to aligning federal and state
 discourse is now catching up with the national reality:                governments’ policies and investments in our cities
 Australian cities are the economic powerhouses of the                  represents a real opportunity to ensure Sydney receives the
 nation and our gateway to the global economy. Cities                   right policy settings, benefits from a collaboration between
 bring together the most competitive enterprises and                    all levels of government and gets the right investment
 talent, reinforcing and greatly adding to their value through          in infrastructure. They will result in a better link between
 agglomeration and knowledge spill-overs.                               federal infrastructure investment and agreed city priorities.
                                                                        They also offer the potential for a greatly improved transport
 This is why the Prime Minister stressed that although                  infrastructure appraisal process.
 “historically the federal government has had a limited
 engagement with cities in fact that is where most                      So Sydney’s dividend continues, but so do its divides. There
 Australians live. It is where the bulk of our economic growth          are some promising opportunities arising – but we must
 can be found.”9                                                        not be complacent. In this report, we review the evidence,
                                                                        analyse some of the key trends shaping Sydney and then
 Similarly, we have also welcomed – indeed played a part in             recommend some interventions of strategic significance.
 creating – the new Greater Sydney Commission. This is a
 strategically important initiative of the NSW government to
 provide the kind of cross-governmental coordination that
 Sydney has historically lacked. Although in its early days,
 the GSC’s integrated approach to infrastructure planning
 for a growing city is very much on the right path and bodes
 well for the future. The Committee believes that the GSC

 9   Malcolm Turnbull MP, Changes to the Ministry, 20 September 2015,
     http://www.malcolmturnbull.com.au/media/Ministry

ADDING TO THE DIVIDEND, ENDING THE DIVIDE 3                                                                                         7
PART 1: ADDING
  TO THE DIVIDEND
  Sydney’s momentum is now decisively impacting on the                    THE NATIONAL ECONOMIC
  national economy. A combination of big infrastructure
  projects, radically increased housing delivery and fast-
                                                                          IMPORTANCE OF SYDNEY
  growth in forward-looking sectors such as financial services,           Sydney now generates almost a quarter of Australia’s
  ICT, health and tertiary education has transformed Sydney’s             Gross Domestic Product (GDP) and is home to much of the
  performance and thus its contribution to Australia.                     economic infrastructure critical to the prosperity of Australia.

  Of all the jobs created in Australia since 2011, around 40%             As Australia’s largest city, Sydney has always made a
  of them were created in NSW and around 30% in Sydney                    significant contribution to national growth. Figure 2 shows
  alone. This level of job creation far exceeds Sydney’s share            the long-term GDP growth for Sydney and Australia. It
  of Australia’s population. Sydney has added to the national             illustrates the high levels of growth that Sydney experienced
  dividend, and then some.                                                in the lead up to the 2000 Olympics, the subsequent drop-
                                                                          off in growth immediately thereafter and the sharp but short
                                                                          downturn of the Global Financial Crisis.
                                                                                  In 2014–15, Sydney’s GDP rose by over 3 per cent – well
                                                                                  above the Australia-wide growth rate of just over 2.3%.
                                                                                  However, the latest figures for 2015-16 show that Sydney’s
F IGFigure
     U R E 1 .1.PPercentage
                 E RC E N TAG E of
                                O FAustralian
                                    AU ST R A L IAjobs
                                                   N JOgenerated      inE D IN N SW
                                                       B S G E N E R AT           GDPA Ngrowth
                                                                                         D SY D Naccelerated
                                                                                                  EY         to almost 4.5% per annum with the
    NSW and Sydney                                                                nation overall growing by just under 3%.
                         % of Australian Jobs Growth Over Previous Year
  60%

  50%

  40%

  30%

  20%

  10%

   0%

                                                 Sydney       NSW

   Source:
Source:  ABSABS   Labour
              Labour  ForceForce Survey,
                            Survey, 2016 2016 and2016
                                         and SGS, SGS, 2016
NSW and Sydney have both generated disproportionately large percentages of Australia’s jobs growth
   NSW and Sydney have both generated disproportionately large percentages of Australia’s jobs growth
in the last 5 years – Sydney alone created 30% of all jobs in the country during August 2016
   in the last 5 years – Sydney alone created 30% of all jobs in the country during August 2016

  8                                                                                                              COMMITTEE FOR SYDNEY
Figure
F IG U R E 22.. Sydney’s
                SY D N E Y ’SGDP
                              G D Pgrowth
                                    G ROW T H

 0.06

 0.05

 0.04

 0.03

 0.02

 0.01

      0
          1996 1998 2000 2002 2004 2006 2008 2010 2012 2014 2016

 Source: SGS, 2016                              Sydney         Australia
 Sydney’s
Source:   GDP
        SGS,   has been growing faster than Australia’s overall growth since 2013, after a post-
             2016
 Olympics  slump
Sydney’s GDP has been growing faster than Australia’s overall growth since 2013, after a post-
Olympics slump

 During the first decade of the current century, Sydney’s share of Australian GDP declined.
 This is partly because of a post-Olympics slow-down in Sydney but also because other
 cities’ contributions increased – particularly Melbourne’s and Perth’s – following governance
 reform, policy innovation, new infrastructure or the mining boom. Sydney’s share of GDP hit
 a low of 22.4% in 2012 before rebounding strongly to 23.8% in 2015 and 24.5% in the current
 year. In 2017, we may see Sydney contribute a quarter of the nation’s wealth.

F IG U R E 3.
  Figure   3 . Sydney’s
                SY D N E Y ’S S H Aof
                           share   R EAustralian
                                       O F AU ST RGDP
                                                   A L IA N G D P

 27.0%
 26.5%
 26.0%
 25.5%
 25.0%
 24.5%
 24.0%
 23.5%
 23.0%
 22.5%
 22.0%

  Source: SGS, 2016
Source: SGS, 2016
  The mining boom and Sydney’s own subdued performance had the effect of decreasing the
The
  percentageboom
    mining        had theGDP
             of Australia’s effect of Sydney
                                 that decreasing  the percentage
                                             contributed – now theofboom
                                                                     Australia’s
                                                                          is over,GDP  thatisSydney
                                                                                   Sydney     again
contributed – now  the  boom   is over, Sydney
  becoming the motor of the national economy   is again becoming  the motor   of the  national  economy

ADDING TO THE DIVIDEND, ENDING THE DIVIDE 3                                                               9
Sydney’s strong economic growth in recent years has                  By contrast, the CBD of Sydney, until Barangaroo came
  been fuelled by increasing revenue from Finance and                  on line, had not seen its capacity increased significantly
  Insurance Services as well as the emerging FinTech sector,           and service firms may have been crowded out by higher
  for which Sydney is the undisputed Australian capital. The           productivity Financial and Insurance firms able to pay the
  significance of financial services is well illustrated below         higher rents. Of course, Greater Sydney (unlike Melbourne)
  (Figure 4), with growth in this one sector accounting for a          has centres outside its CBD, such as Macquarie Park and
  third of total growth in the Sydney economy.                         Parramatta. These centres have seen significant growth in
                                                                       the past decade and it is now also clear that an increasing
  It is interesting to note that the productivity of service jobs
                                                                       number of professional services firms are investing in
  in Melbourne has been catching up to those in Sydney.
                                                                       Western Sydney as the offer and connectivity improve.
  In the 1990s, professional services jobs in Melbourne
                                                                       Sydney’s more ‘polycentric’ nature enabled growth which
  generated half the income of their Sydney counterparts,
                                                                       has supplemented that of our relatively constrained CBD.
  but by 2015 this had increased to 80%.
                                                                       With a high concentration of Finance and Insurance firms,
  This shift likely reflects the increasing ability of a more
                                                                       Sydney is the most productive of the major Australian
  affordable central Melbourne to accommodate and
                                                                       capital cities (in terms of gross value added per hour
  retain professional service firms. In central Melbourne,
                                                                       worked). On average, almost $90 of economic output is
  infrastructure investments and major redevelopments
                                                                       produced in an hour’s work in Sydney, and in recent years
  through the 2000s substantially increased the footprint
                                                                       the productivity gap between Sydney and other major cities
  and economic capacity of the inner city, as did some
                                                                       has widened. This not only reflects the industries located in
  innovative policy reform.
                                                                       the city, but also their absolute mass, with firms in Sydney
                                                                       realising substantial economies of scale.
   Figure 4. Sydney’s growth industries
F IG U R E 4 . SY D N E Y ’S G ROW T H IN D U ST R IES

  6%
  5%
  4%
  3%
  2%
  1%
  0%
        1991         1994         1997        2000       2003       2006        2009        2012        2015
 -1%
 -2%
                               Financial & insurance          Professional services
                               Industrial                     All other industries
Source: SGS,
  Source:    2016
          SGS,  2016
One third of total growth in the economy of Sydney has been generated by one industry: FinTech
  One third of total growth in the economy of Sydney has been generated by one industry: Financial services

  10                                                                                                          COMMITTEE FOR SYDNEY
F IG U R E 5 . L A B O U R P RO D U C T IV IT Y
Figure 5. Labour Productivity
Source: SGS, 2016
Sydney is the most productive
of all major Australian cities,
with the gap between the city
and the Australian average
widening in recent years
Source: SGS, 2016
SYDNEY’S MOMENTUM – on both public and private land – to enable more key
Sydney is the most productive of all major Australian cities, with thetogap between theatcity
theand the
CONTINUES
Australian average widening in recent years
workers be able to reside heart of our city, more
potential first time buyers to build up a deposit and greater
After a decade of sluggish growth that culminated with the beneficial mixed-communities outcomes.13
shock of the Global Financial Crisis in 2008-09, Sydney has
clearly re-emerged as a major driver of Australian economic
growth, with strong year on year GDP growth. Sydney’s role SYDNEY STANDS OUT – AND HAS
as Australia’s global city, and the flow of capital and people COME A LONG WAY SINCE 2012/13
this brings, is allowing it to benefit from a global economic
Sydney’s momentum contrasts with other parts of Australia
recovery. At the same time, its housing delivery has more
that seek to manage the slow-down in the resources
than doubled since its low point in 2011/12 – to over 31,000
boom and the continued reduction in manufacturing. On
a year,10 about the same as London on just over half its
current trends, by 2056 Sydney will not only have 8 million
population11 – with the market approaching historically high
inhabitants, it will have a GDP at least 100% larger in nominal
levels of supply with significant employment consequences.
terms than today. After all, its GDP has grown by almost 25%
As with all global cities subject to such growth, an increasing in only the 8 years since the GFC.
proportion of these are investment-driven as private renting
Sydney has indeed come a long way since the first iteration
rises accordingly alongside serious affordability pressures.
of Adding to the Dividend, Ending the Divide. We are not
So far these pressures have not prevented the nation’s
complacent however, as there is a challenge to ensure that
(and the world’s) talent from locating here, though there
as the current boom tapers off – as it will when the housing
is anecdotal evidence to suggest that outmigration is
market reaches its cyclical peak – that there are projects
occurring as a result of people being priced out of housing.12
in place to sustain demand and productivity. It is worth
Both the Federal and State governments need to keep this
considering that many of the projects likely to be drivers
situation under review and seek to understand what role
of higher productivity in Sydney are still some years away.
they each play or could play in alleviating these pressures.
It will be at least a decade before Badgerys Creek Airport’s
In other related advocacy work the Committee has called
stimulus is felt and the Sydney Metro extension under the
for more of Sydney’s future housing supply to be designed,
Harbour won’t open till 2024, while the Parramatta Light Rail
designated or provided as ‘affordable’ or sub market rental
won’t open until 2023. Good planning and identifying the
most appropriate program of infrastructure projects can and
10 NSW Department of Planning and Environment, Metropolitan Housing Monitor must enable us to avoid a gap in momentum. They must
Sydney Region, 22 December 2016, http://www.planning.nsw.gov.au/Research-
and-Demography/Research/Housing-Monitor-Reports/Metropolitan-Housing- also help us overcome some of the divides in Sydney that
Monitor-Sydney-Region hold back opportunity in Western Sydney and inhibit the
11 Latanauskaite, L., House Building: December Quarter 2015, England, UK
Department for Communities and Local Government, 2016, https://www.gov.uk/ performance of the city.
government/uploads/system/uploads/attachment_data/file/502930/House_
Building_Release_Dec_Qtr_2015.pdf
12 Cross, L, ‘Sydney families moving to Brisbane ‘for the kids’’, Domain, October
2016 http://www.domain.com.au/news/sydney-families-moving-to-brisbane- 13 Committee for Sydney, Issues Paper 8:A City for All, five game-changers for
for-the-kids-20141031-11es0d/; Williams, S, ‘Sydney’s priced-out buyers heading affordable housing in Sydney, 2015, http://www.sydney.org.au/wp-content/
to Melbourne’, Domain, May 2016, http://www.domain.com.au/news/sydneys- uploads/2015/08/CfS-Issues-Paper-8-A-City-for-All-Five-Game-Changers-for-
pricedout-buyers-heading-to-melbourne-20160521-gozo9m/ Affordable-Housing-in-Sydney.pdf
ADDING TO THE DIVIDEND, ENDING THE DIVIDE 3 11PART 2: ENDING
THE DIVIDE
From its renewal in 2012, the Committee has highlighted BUT THE JOBS GAP REMAINS
Sydney’s recovering and significant economic contribution
Underpinning the current divide within Sydney is the decline
to the wellbeing of the state and the nation. We have
of manufacturing, once dominant in Western Sydney, and
advocated for policies and infrastructure that reinforce
the rise of the knowledge economy in the East. It remains
Sydney’s success and maintain its pre-eminence in driving
the case that high value jobs are concentrated east of
national growth. At the same time, however, we have
Parramatta – at Macquarie Park, North Sydney and in the
consistently drawn attention to evidence of a divided
City of Sydney LGA (mostly in the CBD). New centres have
Sydney with differing health, education and economic
been located in or are developing adjacent to the CBD, such
outcomes depending on where you live – and to the
as Barangaroo and Ultimo, with a new innovation district set
advantages that accrue from reducing such city divides.
to emerge out of the development of the ATP and an even
bigger mixed use innovation focused district mooted for the
WESTERN SYDNEY ON THE MOVE…. Bays Precinct. While research shows that Parramatta’s GDP
grew faster in the last few years than that of the CBD and
There has clearly been a decisive shift in awareness of
of North Sydney – though not Macquarie Park16 – this East
the opportunities and challenges of Western Sydney over
Sydney dominance in high value jobs is expected to persist
the last three to four years. There is greater government
for some time ahead.
focus on Western Sydney and an emerging public policy
interest in the spatial divides within Sydney, including by Work by Committee for Sydney members Western Sydney
the GSC which has taken up this theme in earnest14. There University and Deloitte, has recently set out some of the
is also renewed and healthy competition between the main challenges and opportunities in Western Sydney17. Despite
political parties that aim to show that they have the best advances, particularly in the growth in the number and
commitment to Western Sydney’s future and the policies proportion of Western Sydney residents with university
and program of infrastructure that the area needs to thrive. degrees and the growth in financial and insurance services
Long may that competition flourish as the transformation in Parramatta (the suburb’s 3rd largest employment
of Western Sydney and the re-balancing of Greater Sydney sector), “large concentrations of jobs in high value adding
needs long-term bipartisan commitment. professional services sectors are not emerging at sufficient
pace to match the growing number of tertiary qualified
Perhaps most practically, the announcement of the
Western Sydney residents”18.
location of Sydney’s second airport at Badgerys Creek
has already changed the profile of the region for investors On current projections, between now and 2041, most jobs in
and offers a major catalyst for the development of new Western Sydney will still be in retail, health care, education
industries and innovation related sectors in Western and manufacturing, with manufacturing continuing to
Sydney. The commitment to create a new cultural precinct decline in its share of overall employment19. While logistics
in Parramatta with the relocated Museum of Applied Arts is likely to grow following the growth of the new airport,
and Sciences at its heart, also reflects the shift in policy and on current trends the overall jobs profile and growth of
public investment towards the West. Very importantly, the the region will not. Currently the jobs in Western Sydney
private sector has begun to respond with significant new increase by 8,000 a year but the number of workers grows
commercial office investment – such as the Lang Walker by 13,000. This leads to a daily worker outflow from the
developments in Parramatta15 – and the developing of new region which may be over 400,000, and increasing20.
capacity in the area by some global companies.
16 PwC, Parramatta 2021, Unlocking the potential of a new economy, Report for
City of Parramatta Council, 2016, http://www.parracity.nsw.gov.au/__data/assets/
pdf_file/0011/188984/City_of_Parramatta_2021.pdf
14 Blebly, M, Why the Greater Sydney Commission says the city has to change, 17 Deloitte, Shaping Future Cities, Designing Western Sydney, 2015, http://landing.
Australian Financial Review Online, 22 November 2016, http://www.afr.com/ deloitte.com.au/rs/761-IBL-328/images/Shaping%20Future%20Cities%20
real-estate/why-the-greater-sydney-commission-says-the-city-has-to-change- blueprint%20v2.pdf
20161122-gsus8v 18 Ibid. 2015
15 Willmot, B., Lang Walker to Build Parramatta Towers for NSW Public Servants, 19 Montoya, D, Western Sydney: an economic profile, Briefing Paper No.
The Australian, 21 December 2016, http://www.theaustralian.com.au/business/ 10/2015, NSW Parliamentary Research Service, 2015.
property/lang-walker-to-build-parramatta-tower-for-nsw-public-servants/ 20 O’Neill, P, Addressing Western Sydney’s jobs slide, The Centre for Western
news-story/0df316ee0f87395ab7fa984c091c95b6 Sydney, Western Sydney University, 2016, p.16.
12 COMMITTEE FOR SYDNEYThe challenge is outlined in Figure 6. The opportunity is also
clear, as agglomerations of knowledge jobs have begun to
form in and around key centres in Western Sydney. These
can and must be built on by recognising and addressing not
just the jobs-gap but, as we shall see, the public-transport
gap experienced by Western Sydney.
Figure
F IG U R6.EAccess
1 4 : AtoCknowledge
C E S S T O jobs
KNOWLEDGE JO B S
Source:
Source: Arup
Arup 20162016
The jobs gap embodies and reinforces the different socio-economic outcomes generated in Western
Sydney. This region will need to overcome structural and connectivity divides if there is to be greater
spatial equity and improved productivity at the metropolitan level.
ADDING TO THE DIVIDEND, ENDING THE DIVIDE 3 13Figure 7. Number of residents that can be reached within 30-minutes by public transport
Source: Arup 2016
This map represents the number of residents that are accessible by public transport from each location on the map
– a person living in the inner city can reach over 1 million other residents by public transport within half an hour, this
number drops the further west a person lives. This figure shows the key transport connectivity differential between
the East and West in Sydney that reflects and reinforces this divide.
MEASURING SYDNEY’S DIVIDE general pattern, although Sydney’s constrained CBD being
WITH EFFECTIVE JOB DENSITY on the far-east of the Metropolitan area brings a lop-sided
spatial focus to Sydney’s EJD quite unlike Melbourne’s more
Effective Job Density (EJD) is an index of the level of even distribution of EJD on all sides of its larger and more
employment relative to the time taken to gain access to that centrally located CBD.
employment, adjusted by the current mode split of those
workers in their travel to employment. It is a proxy measure The following Figures and Tables show the areas with the
of agglomeration economies and for measuring the relative highest Effective Job Density (EJD), Gross Value Added
accessibility of certain parts of Sydney with other areas. (GVA) and labour-productivity in Sydney. The Sydney CBD is
People within areas of higher EJD can access more jobs and top in all categories, as expected, but other pockets of high
the consequent benefits of agglomeration. performance outside benefit from proximity to, or good
connectivity with, the Sydney CBD. Each of the maps and
In most cases, a CBD has the highest level of EJD in the figures graphically illustrate both the dividend and divide
whole city, reflecting that CBDs are generally the focal point in Sydney.
of the city’s transport network. They are the easiest location
for the most number of people in a City to access. With Public policy for Sydney can be summarised in these charts:
high levels of access per square metre, land values in CBDs we have to deepen areas of existing high EJD and extend
are high, making higher density and costlier development higher EJD performance to other areas of Sydney west and
feasible. Coupled with supportive planning controls, this south of Parramatta. We know we will have succeeded when
results in intense use of CBD land, leading to a higher more areas of Sydney are covered in deep blue.
density of economic activity. Sydney’s CBD follows this
14 COMMITTEE FOR SYDNEYFFigure
IG U R E 8.
1 6Mapping
. M A P P INSydney’s
G SY D N EEffective
Y ’S E F F ECJob
T IV Density
E JO B D E N S IT Y :
Source: SGS, 2016
EJD is highest in the CBD and
North Sydney; Parramatta is
above average but the EJD falls
off quickly in the surrounding
suburbs
Source: SGS, 2016
EJD is highest in the CBD and North Sydney; Parramatta is above average but the EJD falls off quickly
In the surrounding suburbs
GROSS VALUE ADDED
Gross value added is a measure of income generated by business in terms of both
profits and wages paid to their workers. In 2010-11, roughly one quarter ($64 billion) of
Greater Sydney’s income was generated within the Sydney CBD. Other significant income
generating in Greater Sydney are North Sydney (generates 3.5% or $10 billion), Macquarie
Park (2.6% or $7.3 billion) and Parramatta (2.6% or $7.2 billion).
F IG U R E 1 7 . M A P P IN G SY D N E Y ’S G RO S S VA LU E A D D E D (GVA ) F IG U R E 5 . L A B O U R
P RO D U CSydney’s
Figure 9. Mapping T IV IT Y Gross Value Added (GVA)
Source: SGS, 2016
One quarter of all Greater
Sydney’s income was generated
in the CBD (2010/11)
Source: SGS, 2016
One quarter of all Greater Sydney’s income was generated in the CBD (2010/11)
ADDING TO THE DIVIDEND, ENDING THE DIVIDE 3 15LABOUR PRODUCTIVITY
Labour productivity is a measure of Gross Value Added (income) generated for each hour
worked. Most locations across Sydney have labour productivity of between $50-$60.
Labour productivity in the Sydney CBD is $106 per hour worked. North Sydney ($92 per
hour worked), Macquarie Park ($82 per hour worked) and Parramatta ($79 per hour worked)
are also highly productive locations.
F IG U R E 1 8 . M A P P IN G SY D N E Y ’S LA B O U R P RO D U C T IV IT Y
Figure 10. Mapping Sydney’s Labour Productivity
Source: SGS, 2016
Most locations across the city
have labour productivity of
between $50-$60 – the CBD
has $106 per hour worked and
Parramatta $79
Source: SGS, 2016
The Sydney
Most locationsCBD is the
across thelocation
city havewith theproductivity
labour highest level
of of access$50-$60
between to all jobs butCBD
– the alsohas
access
$106 to
per
the most
hour productive
worked jobs. Sydney
and Parramatta $79 CBD’s access to jobs is double that of Parramatta and three
times that of Penrith. This means that businesses in the Sydney CBD have more opportunity
to connect with potential suppliers and customers, which helps to enhance their productivity.
People living in or close to Sydney CBD also have superior access to jobs. Taking a thirty-minute
journey during the morning peak, a Sydney CBD resident could access almost one million jobs,
while a Parramatta resident can only access half that number.
Taking a thirty-minute journey during the
morning peak, a Sydney CBD resident
could access almost one million jobs, while
a Parramatta resident can only access half
that number
16 COMMITTEE FOR SYDNEYE 7 . IN CO M E BY P O STCO D E 2 0 1 3 /1 4 1
INCOME DIVIDE
The average income of Sydney is clearly divided between the Eastern half of the city, where
the income is much higher, and the Western half, where the average income is well below the
Australian average
F IG U R11.EIncome
Figure 7 . INby
COpostcode
M E BY 2013/14
P O STCO D E 2 0 1 3 /1 4 1
Source: Healthstats NSW
and WSU
F IG U R E 8 . AV E R AG E N A P L A N Y EA R 9 R E
EDUCATION DIVIDE
Source: Healthstats NSW Figure 12. Average NAPLAN year 9 reading score by
Healthstats
The average
Figure NSWincome
12 illustrates of Sydney
the challenge is clearly
to bring divided
the entire
Sydneythe
between LGAEastern half of the city, where the
rage income
income isof
metropolis much
up
Sydney
to thehigher,isand
same level
clearly
in the Western
terms of
divided
positive
educational outcomes. Educational gaps are a significant
between
half, where the Eastern
the average income is half of the
well below thecity, where th
Australian
average
is much higher,
issue, not just inand the
terms of Western
general principles ofhalf,
equity where
in the average income is well below the Aus
providing a high level of income to all residents regardless
of where they live. The jobs of the future, including those
in the FinTech and Innovation industries, require workers
with a high-level education, to produce an internationally
competitive workforce.
The Committee’s view is that we need to focus on the
policies, innovations and investments that will on the
one hand promote better educational performance
at secondary level and on the other create the jobs
ecosystem and opportunities across Western Sydney to
exploit the skills and knowledge of the increasing number
of graduates in the area for the benefit of all of Sydney.
558 – 570
570 – 581
581 – 593
593 – 605
605 – 617
617 – 629
629 – 640
640 – 652
Source: HealthStats NSW and WSU
Western Sydney scores much lower the Eastern and Northern
Sydney in reading tests, reflecting the gap in educational outcomes
2
Source: HealthStats NSW and WSU
at school age
Western Sydney also scores much lower the Ea
ADDING TO THE DIVIDEND, ENDING THE DIVIDE 3
gap in educational outcomes 17Image provided by Penrith City Council
HEALTH DIVIDE Figure 13. Occurrence of high body mass attributable
Western Sydney communities continue to lag in a series of F IG U R E 9 . O C C U R R E N C E O F H IG H B O D
deaths by Sydney LGA
health outcomes such as diabetes, deaths attributable to
high body mass, coronary heart disease, circulatory disease
and asthma. Although much of this is associated with
relative disadvantage, there is another factor at play here.
The maps of diabetes, obesity and cardiovascular disease in
Sydney overlap closely with maps of low density and poor
public transport access.
The key difference between Western Sydney with its
comparatively lower density residential development
pattern and the more compact Sydney within 10kms of
the CBD is the relative access to walkable precincts/town
centres and public transport on the one hand, and the
reliance on the car for journeys to work or services on
the other. This has been recognised in epidemiological
and social policy research as critical to health (and indeed
economic) outcomes21. Western Sydney simply has a more
car-oriented urban structure where people walk less, drive
more and drive longer than in the compact Sydney closer
to the CBD. This has differential health consequences which
need addressing urgently. The structure of Sydney is not
only dividing us, it’s making some communities ill. 28.1 – 29.4
29.4 – 30.7
30.7 – 32.0
32.0 – 33.3
33.3 – 34.5
34.5 – 35.8
35.8 – 37.1
37.1 – 38.4
Source: HealthStats
Source: HealthStats NSW and WSUNSW and WSU
Walkable precincts
Higher obesity rates match the mapart clustered
of lower around the C
density development,
poor access to public transport and the relative physical inactivity
21 Giles-Corti, B. et al. City Planning and Population health: a global challenge, the
Lancet, 2016 the sprawldueofto lack
of communities Western
of walkable Sydney
precincts may be contribu
18 COMMITTEE FOR SYDNEYF IG U R E 1 0 . O C C U R R E N C E O F D EAT HF IG S AT
U RTE R1IB1 .UATA
MO BULEN TTO O FCHAORSDPIOVA S C UIO
ITA L ISAT L ANRS
Figure 14. Occurrence of deaths attributable to Figure 15. Amount of hospitalisations caused by
BY SY
cardiovascular disease byD N E YLGA
Sydney LG A F IG U R E type II diabetesLG
byASydney
F IG ULGA
RE
93 – 107 30 – 43
107 – 121 43 – 57
121 – 135 57 – 70
135 – 149 70 – 83
149 – 162 83 – 97
162 – 176 97 – 110
176 – 190 110 – 123
190 – 204 123 – 137
Source: HealthStats
Source: HealthStats NSW and WSU NSW and WSU Source: HealthStats and WSU
Source: HealthStats and WSU
The difference
The difference is stark
is stark – deaths –ofdeaths
caused caused
cardiovascular
Once again, health
disease of cardiovascular
outcomes
disease
Once again, differential health are
outcomes
for the west are much
for almost
the West – double in We
are almost double in Western Sydney than in many parts of the concentrated
hospitalisations fromin the West
diabetes are concentrated in the West
than in many parts of the inner city
inner city
KEEP ON KEEPING ON…
While there is clearly new impetus in Western Sydney the evidence presented shows how
much more is needed to be done to reduce the divides. The Committee will continue to
campaign on these issues, not because ending the divide is a ‘good thing’ to do or because
we care about our fellow citizens – we do care and it is a good thing to do. But we also do
it because ending the ‘Divide’ will make the largest single contribution to adding to the
‘Dividend’. Good social policy is good economic policy. And what has to inform and drive
both – and the campaign for the long-term shifts required in the balance and performance
of the city – is an understanding of some of the key trends shaping Sydney along with many
other global cities.
ADDING TO THE DIVIDEND, ENDING THE DIVIDE 3 19PART 3:
KEY CITY TRENDS
COMPACT SYDNEY AND long commutes. Because of a desire for proximity to jobs,
SPRAWLED SYDNEY services and lifestyle amenities, there is a growing demand
for smaller homes with well-designed shared spaces and
While the east-west dynamic in Sydney is core, it is also good public or active transit access to centres of activity.
useful to understand that the key trends shaping the Indeed, apartments now make up the majority of homes
two Sydneys actually reflect shifts going on in cities being built in Sydney23.
internationally, which are leading to a densifying compact
inner city on the one hand and lower density sprawled There is a greatly strengthened demand to live in inner city
city suburbs on the other. In response to this trend there is districts that are mixed use, walkable to jobs and services,
much discussion in urban planning forums around both the well connected by public transport and have a diversity of
challenge of gentrification and retrofitting suburbia. housing stock and tenures. This is happening in Sydney and
is exacerbating the Sydney divide, with poorer communities
Sydney has been experiencing a phenomenon known in being displaced from such desirable but less affordable
the USA as ‘The Great Inversion’22. This is a rediscovery locations and moving out to the fringes of our city less
of inner city living and walkable precincts by aspirational served by public transport, services and jobs. At the same
millennials and downsizing baby-boomers. We know that time, those wanting to move from the city edge closer in are
there are long-term demographic, cultural and economic finding it ever more unaffordable.
trends at work globally and these are being reflected
in Sydney. We are seeing smaller family sizes with both
parents working and with time-hungry people preferring
amenity and well-connected locations to size of home and
23 MacroBusiness, Sydney Apartment Construction set to boom, 3 April 2014,
22 Ehrenhalt, A., The Great Inversion and the Future of the American City, New York, http://www.macrobusiness.com.au/2014/04/sydney-apartment-construction-
Kaopf, 2012 set-to-boom/
20 COMMITTEE FOR SYDNEYTHE RE-URBANISATION OF THE This leads to the current preference by business and talent
ECONOMY AND THE RISE OF for more urban locations with active uses outside the work
place and locations where work-spaces meld into cafes, bars,
INNOVATION DISTRICTS restaurants and public spaces open all hours. These are
Reinforcing these trends is the ‘re-urbanisation’ of the places in which one can easily meet with peers, customers
economy that has seen businesses following talent away and investors – in a sense, the factories of the knowledge
from city fringes back towards city centres. The most economy – that are also close to where workers live (by
notable Sydney example is the move of the Commonwealth walking, cycling or public transport). This contrasts with
Bank from Parramatta and Olympic Park to Redfern. drivable out-of-town single use workspaces, business parks
Underpinning the re-urbanisation of the economy has been or university campuses, that no longer attract as much talent
a relative shift from an economy based on the production or investment. Recognising and embracing this trend, we
and exchange of goods to one that produces and are seeing universities supplement their ex-urban property
exchanges knowledge24. portfolios developed in a different era with more town-centre
This is both a sectoral and a spatial shift with global locations and moving whole faculties to them. Some are also
evidence now of companies, retailers and universities attempting to retrofit their single-use science parks with mixes
following knowledge workers and to a significant degree, of uses, housing and mass transit connectivity.26
relocating capacity from the suburban edge of cities to
more central, amenity-rich areas, well-served by public
transport. Put another way, manufacturing’s decline and
the rise of financial services have different geographies
with significant consequences for communities and
the ‘operational pressures’ on Sydney, particularly its
transport system.
Worker preferences have shifted from ex-urban compounds
and single-use business parks to in-town mixed use
environments25. In an economy based on knowledge and
innovation it is crucial to be in close contact with (and
surrounded by) people of talent. It is also advantageous to This re-urbanisation is both
be in an environment that encourages speedy learning and a sectoral and a spatial
knowledge transfer and is not constrained by traditional
office hours or confined to offices. shift with global evidence
now of companies, retailers
and universities following
knowledge workers.
24 Clark, G & Moir, E, The Business of Cities, 2014, gov.uk/government/uploads/ 26 Katz, B., Wagner, T., The Rise of Innovation Districts: A New Geography of
system/uploads/attachment_data/file/429139/business-of-cities.pdf Innovation in America,https://c24215cec6c97b637db6-9c0895f07c3474f6636f9
25 JLL, The Melbourne CBD: What is driving centralisation, 2013, http://www.jll.com. 5b6bf3db172.ssl.cf1.rackcdn.com/content/metro-innovation-districts/~/media/
au/australia/enau/research/187/melbourne_cbd_what_is_driving_centralisation; programs/metro/images/innovation/innovationdistricts1.pdf;
Clark, G & Katz, B, Forget big suburban campuses, innovative corporations Smart Growth America, Amazing Place, Six Cities Using the New Recipe for
are moving downtown, Quartz, 2014, http://qz.com/211970/forget-big- Economic Development, June 2016, https://smartgrowthamerica.org/resources/
suburbancampuses- innovative-corporations-are moving-downtown/ amazing-place/
ADDING TO THE DIVIDEND, ENDING THE DIVIDE 3 21PART 4: A DUAL
v
DEVELOPMENT STRATEGY
FOR THE TWO SYDNEYS
The city trends identified are deep and long term and they Underpinning this dual strategy are outcomes we must aim
explain why some parts of our city are residential and for. They include:
commercial hot spots and why some are actually getting
•• Fostering the number of innovation districts across
relatively cooler in market terms. The task of public policy
Sydney
for Sydney in this context is complex. On the one hand,
public policy must attempt to harness the existing trends •• More walkable neighbourhoods linked to renewed,
towards agglomeration of knowledge jobs and the drift mixed use town centres
economically to a densifying compact Sydney. On the •• A city-wide modal shift towards public transport
other, this must be achieved while recognising that such
a model, in having its epicentre in and around a relatively •• Increasing effective job density as a key objective
small and constrained CBD in the far-east of our city, is •• More dense urban settlement across Sydney but
causing problems of spatial equity and Metropolitan under particularly close to jobs and rail stations
performance. So although a single key principle should
shape planning and transport policy for Sydney, we need a To achieve these outcomes, we need the following
dual city development strategy. This builds on the success policy initiatives:
of Global Sydney to the East whilst building better and faster •• A better way to fund our cities
transport connectivity with – and the amenity, mix of uses in
•• An improved process for appraising what infrastructure
and density of – significant centres in Western Sydney.
is needed to sustain the liveability, productivity, growth
and equity of the city
•• Continuing governance innovation – towards the data-
driven and responsive metropolitan city,
•• A greater emphasis on inclusive growth with a
commitment to affordable housing as a key part of
Sydney’s growth model.
22 COMMITTEE FOR SYDNEYOUTCOMES TO
ADDRESS THE DIVIDE
INNOVATION DISTRICTS WSU’s new facilities in Parramatta town centre and the
University of Wollongong’s initiative in Liverpool are
Research by the Brookings Institution shows that in US cities
Australian examples of what’s happening globally – but
innovation and urbanism are coming together in what are
also of what we need to see more of in the key centres of
now being called Innovation Districts, with dense networks
Western Sydney.
of knowledge workers and entrepreneurs/start-ups forming
in mixed-use urban neighbourhoods or precincts.27 The
elements of the innovation district urban environment are A MORE WALKABLE SYDNEY IS AN
set out in the table below.28
ECONOMIC STRATEGY
The conventional wisdom used to be that creating a strong
Table 1: Comparing traditional innovation spaces and economy came first, and that increased population and a
innovation districts higher quality of life would follow. The converse now seems
more likely: creating urban places with high amenity, mixed
TRADITIONAL INNOVATION DISTRICTS use density and connectivity is the first step to attracting
INNOVATION SPACES
new residents and jobs.
Accessible by car Accessible by public
transport, and walkable This is the view of the leading US property expert
Spatially Isolated Located in downtown, mid- Christopher Leinberger, who has recently researched the
town or ex-industrial urban walkability and property values of every suburb in every
areas* American city. He notes that “all the fancy economic
Sprawling corridor or Physically compact development strategies, such as developing a biomedical
Campus Layout cluster, an aerospace cluster, or whatever the current
Predominantly research or Mixed use economic development ‘flavour of the month’ might be,
commercial space do not hold a candle to the power of a great walkable
urban place.”30 His research shows that the best economic
Often built on green field Built on brownfield sites
sites performance in the modern city is to be found in ‘walkable
urban’ precincts dense with knowledge workers. We think
Innovation districts are “the ultimate mash-up of this analysis holds water for Sydney too and has important
entrepreneurs and educational institutions, start-ups and implications for public policy here, both economically
schools, mixed-use development and medical innovations, and socially.
bike-sharing and bankable investments – all connected
The Committee believes that public policy needs to ensure
by transit, powered by clean energy, wired for digital
more of Sydney develops the benefits of the compact
technology, and fuelled by caffeine”.29 Following this trend
model, to ensure more equal access across Sydney to the
many universities in Australian cities are establishing town
clear economic and social benefits of density and what
centre facilities making the most in the market of their
Leinberger calls ‘walkable urbanism’, as contrasted with
location and the vibrant neighbourhoods that attract talent,
‘drivable sub-urbanism’31. Western Sydney lacks walkable
both teachers and students.
urban precincts, and in our analysis, redressing this
imbalance is not some minor matter of urban design or
architectural bias but actually a core part of designing a
serious strategy for economic renewal and spatial inclusion.
27 Katz, B., Wagner, T., The Rise of Innovation Districts: A New Geography of
Innovation in America, May 2014, https://c24215cec6c97b637db6-9c0895f0
7c3474f6636f95b6bf3db172.ssl.cf1.rackcdn.com/content/metro-innovation-
districts/~/media/programs/metro/images/innovation/innovationdistricts1.pdf
28 Centre for London, Spaces to Think: Innovation Districts and the Changing
Geography of London’s Knowledge Economy, April 2016, http://www.
centreforlondon.org/wp content/uploads/2016/08/J4234CFL_Innovation_
Districts_WEB.pdf 30 Leinberger, CB, The Option of Urbanism: investing in a new American dream,
29 Katz, B., Wagner, T., The Rise of Innovation Districts: A New Geography of Washington DC, Island Press, 2008
Innovation in America, May 2014, https://c24215cec6c97b637db6-9c0895f0 31 Leinberger, CB & Rodriguez, M, Foot Traffic Ahead – Ranking Walkable
7c3474f6636f95b6bf3db172.ssl.cf1.rackcdn.com/content/metro-innovation- Urbanism in America’s Largest Metros, The George Washington University School
districts/~/media/programs/metro/images/innovation/innovationdistricts1.pdf of Business, 2016
ADDING TO THE DIVIDEND, ENDING THE DIVIDE 3 23A MORE WALKABLE SYDNEY IS A Recent academic research in Australia has modelled the
HEALTH STRATEGY impact of urban planning on health, measuring a compact
city model against a sprawled one, to assess the impacts
The structure of Sydney is not only dividing us, it’s making of policy changes by governments in 6 cities around the
some communities ill. We have seen that the deepening and world.34 The results are directly applicable to Sydney and
enhancing of the amenity, density, design, mix of uses and the message is clear: people who live in higher density
connectivity of our town centres – and improved links with neighbourhoods tend to walk more, cycle more and use
their suburbs – should be seen as a core economic policy. public transport more often. In contrast, suburban sprawl
But we also believe it is a core health and equity policy. discourages active transport – walking and cycling. The
The amenity benefits of walkable precincts connected by study revealed that a concerted policy effort to encourage
good public transport lead to differential health outcomes. compact cities (through major infill densification) results in
Individuals in such precincts who use public transport significant health gains.
more get over three times the amount of physical activity
per day of those who don’t (estimated at approximately 19 Major land-use changes are needed to promote density
minutes a day versus 6 minutes a day by walking to and and diversity of uses to encourage a modal shift to walking,
from the stations32). Such ‘active transport’ unconsciously cycling and public transport. Local and State Government
leads to lowering risks such as heart and vascular diseases, should consider policies that encourage active and public
strokes, diabetes, hypertensive diseases, osteoporosis, transport as a major health and environment policy, not just
joint and back-problems, colon and breast cancers and a transport or planning one.
depression. As Jeff Speck notes, “If you live in a more
walkable neighborhood, you are 35 percent more likely to
be overweight. If you live in a less walkable neighborhood,
you are 60 percent more likely to be overweight”.33
32 Victoria Transport Policy Institute, Evaluating Public Transit Benefits and Costs,
November 2016, http://www.vtpi.org/tranben.pdf
33 Speck, J, The Walkable City – a TED talk, https://www.ted.com/talks/jeff_speck_ 34 Giles-Corti, B. et al. City Planning and Population health: a global challenge, the
the_walkable_city/transcript?language=en Lancet, 2016
24 COMMITTEE FOR SYDNEYYou can also read