Using Better Data to Identify Climate Change-Related Infrastructure Vulnerabilities in Canadian Communities
←
→
Page content transcription
If your browser does not render page correctly, please read the page content below
Case Study Series

Using Better Data to Identify
Climate Change-Related Infrastructure
Vulnerabilities in Canadian Communities

      The City of Kenora:
 05   Asset Risk Assessment

 15 The City of Edmonton:
    Flood Mitigation and Mapping

      The City of Moncton:
 23   Flood Mitigation and Neighbourhood
      Vulnerability Assessment

      The City of Saskatoon:
 31   Grey and Green Infrastructure
      Adaptation

      Union Water Supply System:
 39   Drinking Water System
      Vulnerability Assessment
This publication has been prepared as a non-authoritative guidance. The authors do not accept any
responsibility or liability that might occur directly or indirectly as a consequence of the use, application or
reliance on this material.
Contents

01
     Introduction: Climate Change
     and Policy Context in Canada

05
     The City of Kenora:
     Asset Risk Assessment

15
     The City of Edmonton:
     Flood Mitigation and Mapping

     The City of Moncton:

23
     Flood Mitigation and Neighbourhood
     Vulnerability Assessment

31
     The City of Saskatoon:
     Grey and Green Infrastructure Adaptation

     Union Water Supply System:

39
     Drinking Water System
     Vulnerability Assessment

47   Summary of Insights
Introduction:
Climate Change and Policy Context in Canada
In 2017, Public Sector Digest (PSD), Canadian Water Network (CWN), and the Canadian Water and Wastewater
Association (CWWA) completed a national study of municipal asset management, focusing on how data
is being used to inform decision-making on water, wastewater, and stormwater infrastructure. Surveyed
municipalities and utilities identified a specific gap that exists in their infrastructure datasets. Respondents
indicated that data pertaining to the impacts of climate change is either absent or not well integrated into
local infrastructure decision-making. In response to the increasing severity and frequency of climatic events
in Canada, along with recent studies confirming the predicted future impacts of climate change on our
communities, local leaders are searching for a way to engage in climate change adaptation.

In response, PSD, in partnership with CWN, CWWA, and the Federation of Canadian Municipalities (FCM), has
compiled five case studies of Canadian municipalities and utilities who are incorporating climate change
considerations into their asset data collection, analysis, and decision-making. Each case study highlights the
types of data that are necessary to assess vulnerabilities to critical risks posed by climate change, and how
these datasets are collected and analyzed by municipalities to inform decision-making on risk reduction and
adaptation for municipal water systems.

Climate Change in Canada
Climate change poses a significant impact to humans and natural systems around the world. The United
Nation’s Intergovernmental Panel on Climate Change (IPCC) Fifth Assessment report indicates that
associated risks to human health and safety, infrastructure, natural environments, and the economy are
increasing. The report identified a global average temperature increase of 0.85°C above pre-industrial
levels (1948)1 and scientists are predicting a global temperature increase of 1.5°C between 2030 and 2052.2

In 2019, Canada’s Changing Climate Report (CCCR 2019) was released by Environment and Climate Change
Canada (ECCC) as part of its national assessment. This report contained information from scientists at ECCC,
Natural Resources Canada, Fisheries and Oceans Canada, and Canadian universities. The report indicated
that between 1948 and 2016, the average temperature increase across Canada was 1.7°C, double that of the
global average. 3 Observed precipitation changes in Canada have increased by approximately 20% between
1948 and 2012. By the late 21st century, the projected increase could reach an additional 24%.4 During the
summer months, some regions in Canada are expecting more frequent periods of drought. Other recorded
events include flooding, cold extremes, warm extremes, wildfires, and record minimum arctic sea ice extent.5
Extreme weather events and storms are also more common across the country.

A changing climate poses a significant risk to Canada’s economy, society, environment, and infrastructure.
Climate-related extremes such as droughts, floods, higher-frequency freeze-thaw cycles, extended periods
of high temperatures, high winds, and wildfires can damage physical infrastructure. The economic impacts
are most evident in the costs associated with damage caused by extreme weather events such as hurricanes,
heavy rain, droughts, lightning storms, extreme winds, and storm surges.6 Certain economic sectors, such

Page | 1
October 2019
as agriculture, tourism, and energy will be affected, depending on the geographic region and the influence
on demand.7 Individuals who are economically or socially marginalized and Indigenous people are especially
vulnerable to the effects of climate change. Canadian municipalities have a responsibility to protect their
local economy, citizens, environment, and physical infrastructure from these impacts.

Policy Context for Local Governments
Municipal assets and public services are vulnerable to the impacts of climate change, placing local leaders
at the front-lines of protecting public resources.8 The IPCC Fifth Assessment report indicated that the most
significant progress towards climate change adaptation in North America is seen at the municipal level.
Acting proactively rather than reactively is a key principle of asset management, which aligns well with
climate change adaptation approaches. In Canada, local governments can leverage this opportunity to
implement climate change adaptation approaches while advancing their asset management practices.

Municipalities are engaging in proactive adaptation planning and assessments through the adoption
of plans and policies that integrate climate change considerations for public infrastructure.9 National,
provincial, and municipal policies, regulations, and funding programs currently reflect a political landscape
that supports these efforts. The provinces have yet to impose any regulatory requirements for local
governments to develop climate change adaptation plans, but many have released guidelines, funding
programs, and related regulations that enable and encourage municipalities to take action. For example,
the Government of Alberta released a climate change adaptation framework manual in 2010, and the
Government of British Columbia released a climate change and asset management primer in 2018.

The Government of Ontario was the first to enact a regulation requiring local governments to adopt
asset management practices. In 2017, Ontario released O. Reg. 588/17: Asset Management Planning for
Municipal Infrastructure. This regulation has deadlines to ensure that local governments are maintaining
progress on their asset management programs. The first approaching deadline was July 1, 2019; by this
date, municipalities must have adopted a strategic asset management policy that includes climate change
considerations.

The Federal Gas Tax agreements have been amended by some provinces to require municipalities to
prioritize climate change adaptation. For example, municipalities in Nova Scotia were required to complete
a Municipal Climate Change Action Plan by 2014 in order to receive their Gas Tax Funding. According to
the 2014-2024 Saskatchewan Gas Tax Fund Agreement, municipalities are required to make progress on
developing and implementing an Asset Management Plan prior to March 2018.

Municipal associations and international organizations also play a significant role in driving progress in
the areas of climate change and asset management. For example, ICLEI is an international network of local
governments. Through this network, Canadian local governments are successfully adopting adaptation and
risk management practices through standardized approaches informed by experts and local leaders.

Engineers Canada recently released a protocol in partnership with Natural Resources Canada that provides
a framework to review climate change information and establish the adaptive capacity of an organization’s

                                                                                                                     Page | 2
                 Using Better Data to Identify Climate Change Related Infrastructure Vulnerabilities in Canadian Communities
infrastructure and operations. FCM has also delivered numerous guides, webinars, and networks to support
municipalities in their efforts to formalize comprehensive asset management programs and climate
change adaptation strategies. Major grant programs include the Municipal Asset Management Program,
Municipalities for Climate Innovation Program, and Climate and Asset Management Network.

Municipalities in Canada are vulnerable to the impacts of climate change, and simultaneously constrained
by provincial regulations, restricted budgets, and public expectations. The five case studies included in
this report are designed to support local governments with learnings that may be relevant to their own
organizations.

A description of each organization’s maturity in asset management and climate change adaptation sets the
stage for each case study. Interviews with municipal and utility staff provide an overview of their approach
to adapt water, wastewater, stormwater, and other municipal infrastructure to the impacts of climate
change. Each case provides a roadmap that led to successful climate change adaptation planning that can
guide others to take action on climate change.

Page | 3
October 2019

Endnotes
1 United Nation. “Climate Change.” Accessed April 12 2019. https://www.un.org/en/sections/issues-depth/climate-change/index.html.
2 Allen, Myles et, al. “Global Warming of 1.5°C: Summary for Policymakers.” Working Group I Technical Support Unit of the Intergov-
ernmental Panel on Climate Change (2018): 6.
3 Zhang, X., Flato, G., Kirchmeier-Young, M., Vincent, L., Wa, H., Wang, C., Rong, R., Fyfe, J., Li, G., Kharin, V.V. “Changes in Temperatures
and Precipitation Across Canada: Chapter 4.” In Bush, E. and Lemmen, D.S. (eds). Canada’s Changing Climate Report. Government of
Canada, Ottawa, Ontario (2019): 112-193.
4 Ibid.
5 Ibid.
6 C.B., V.R. Barros, D.J. Dokken, K.J. Mach, M.D. Mastrandrea, T.E. Bilir, M. Chatterjee, K.L. Ebi, Y.O. Estrada, R.C. Genova, B. Girma, E.S. Kis-
sel, A.N. Levy, S. MacCracken, P.R. Mastrandrea, and L.L.White (eds.). “Climate Change 2014: Impacts, Adaptation, and Vulnerability. Part
A: Global and Sectoral Aspects.” Contribution of Working Group II to the Fifth Assessment Report of the Intergovernmental Panel on
Climate Change. Cambridge University Press, Cambridge, United Kingdom and New York, NY, USA, (2014): 6.
7 Arent, D.J., R.S.J. Tol, E. Faust, J.P. Hella, S. Kumar, K.M. Strzepek, F.L. Tóth, and D. Yan, 2014: Key ecomic sectors and services. In C.B., V.R.
Barros, D.J. Dokken, K.J. Mach, M.D. Mastrandrea, T.E. Bilir, M. Chatterjee, K.L. Ebi, Y.O. Estrada, R.C. Genova, B. Girma, E.S. Kissel, A.N. Levy,
S. MacCracken, P.R. Mastrandrea, and L.L.White (eds.). “Climate Change 2014: Impacts, Adaptation, and Vulnerability. Part A: Global
and Sectoral Aspects.” Contribution of Working Group II to the Fifth Assessment Report of the Intergovernmental Panel on Climate
Change. Cambridge University Press, Cambridge, United Kingdom and New York, NY, USA, (2014): 659-708.
C.B., V.R. Barros, D.J. Dokken, K.J. Mach, M.D. Mastrandrea, T.E. Bilir, M. Chatterjee, K.L. Ebi, Y.O. Estrada, R.C. Genova, B. Girma, E.S. Kissel,
A.N. Levy, S. MacCracken, P.R. Mastrandrea, and L.L.White (eds.). “Climate Change 2014: Impacts, Adaptation, and Vulnerability. Part
A: Global and Sectoral Aspects.” Contribution of Working Group II to the Fifth Assessment Report of the Intergovernmental Panel on
Climate Change. Cambridge University Press, Cambridge, United Kingdom and New York, NY, USA, (2014): 4.
8 ICLEI. “Changing Climate, Changing Communities: Guide and Workbook for Municipal Climate Adaptation.” Natural Resource Cana-
da: Climate Change Impacts and Adaptation Division (2018): 13.
Robak, Anna et, al. “International Infrastructure Management Manual: International Edition 2015.” Institute of Public Work Engineer-
ing Australia (2015): xvii.
9 C.B., V.R. Barros, D.J. Dokken, K.J. Mach, M.D. Mastrandrea, T.E. Bilir, M. Chatterjee, K.L. Ebi, Y.O. Estrada, R.C. Genova, B. Girma, E.S. Kis-
sel, A.N. Levy, S. MacCracken, P.R. Mastrandrea, and L.L.White (eds.). “Climate Change 2014: Impacts, Adaptation, and Vulnerability. Part
A: Global and Sectoral Aspects.” Contribution of Working Group II to the Fifth Assessment Report of the Intergovernmental Panel on
Climate Change. Cambridge University Press, Cambridge, United Kingdom and New York, NY, USA, (2014): 8.

                                                                                                                           Page | 4
                       Using Better Data to Identify Climate Change Related Infrastructure Vulnerabilities in Canadian Communities
Case Study

City of Kenora
Canadians are becoming more aware of the significant impacts that climate
change can have on our local infrastructure. Federal and provincial governments
are reacting to this concern by introducing new guidelines, regulations, and
funding opportunities to encourage local governments to act now to adapt to
climate change impacts. The City of Kenora took advantage of the Federation
of Canadian Municipalities’ Climate and Asset Management Network grant
program to undertake a climate change risk assessment.

Background: Kenora and its Asset
Management Efforts
The City of Kenora is a small northern city located within the borders
of Ontario, less than 100 km away from Manitoba. The economy
relies on four major industries: boating, healthcare, manufacturing,
and mining. The City’s population is 15,096 with a service area
of approximately 25,000. Like many municipalities in northern
Ontario, Kenora is experiencing a population decline.1

The municipality is simultaneously confronting a declining tax
base and an increasing infrastructure deficit. Adam Smith, Special
Projects and Research Officer at the City of Kenora, says the
“infrastructure deficit is top of mind” for city staff. Kenora’s unique
asset portfolio includes 19 vehicular bridges and 64 lift stations, a
reflection of their unique geography. Within its borders there are
several small lakes, in addition to larger bodies of water such as
the Winnipeg River, Black Sturgeon Lake, and Lake of the Woods.
Lake of the Woods has over 14,000 islands, many of which make up
the land of Kenora.

In 2015, Kenora adopted a new Strategic Plan to guide its projects
and planning for the next five years. Over 1,800 residents, city
staff, elected officials, stakeholders, and Indigenous community
members were consulted, using online surveys and a series of
local workshops. The Strategic Plan clearly defines goals and
corporate actions as it relates to the City’s infrastructure and local
environment. It states that the City should manage and maintain
municipal infrastructure through a robust asset management
plan and process; consider climate change impacts in managing
current and future infrastructure; and make efforts to mitigate
the impacts of climate change on City operations. These goals
are intended to guide decision-making to ensure that community
values are further integrated into municipal planning.

Kenora’s asset management journey began in 2009, around the
time that the Public Sector Accounting Board adopted PS 3150,
requiring municipalities to include capital assets in their financial
reporting. Between 2009 and 2012, Kenora acquired a number of
asset management software tools, including: an asset register
that hosts attribute data and creates projections to support
project prioritization; a capital planning and analysis tool to
support capital budget planning; and a GIS system to integrate
with asset inventory data. In 2013, the City completed its first Asset
Management Plan (AMP). Between the years of 2016 and 2017,

Highlights from the Kenora Case Study

    •   Kenora is a small, rural community in northern Ontario with cold winters and mild summers.
    •   The City struggles with a declining population and a significant infrastructure deficit.
    •   Kenora has been advancing its asset management program since 2009, and has also been working
        toward improving its climate change adaptation efforts.
    •   The City successfully applied for $80,500 from the Federation of Canadian Municipality’s (FCM)
        Climate and Asset Management Network grant program.
    •   In 2018, city staff worked with asset management consultants at PSD to produce a climate change
        adaptation and resilience study and Climate Change Risk Assessment Framework.
    •   The City needed to gather meaningful asset attribute data to identify problem areas and
        integrate the information into its GIS system.
    •   The Climate Change Risk Assessment Framework can be modified by city staff in the future to
        include new or updated data as it becomes available.

with the support of an external consultant (PSD), the City completed a comprehensive asset management
roadmap, which includes:

•   Developing a state of maturity report which compares the current state of the City’s asset management
    maturity to industry best practices.
•   Ensuring that the City’s AMP aligns the asset management strategy and objectives to the Strategic Plan,
    and updating it to be O.Reg.588/17 compliant.
•   Completing a data and asset condition analysis to review the City’s existing asset condition data to
    identify gaps and deliver a condition assessment framework that defines the condition of all asset
    categories.
•   Conducting a risk and criticality assessment to identify the assets and asset groups most at risk within
    the City’s portfolio, based on measures of economic and social consequences of asset failure.
•   Creating a lifecycle activities framework through the development of lifecycle protocols, lifecycle models
    by asset type, and asset deterioration curves.
•   Developing a levels of service framework with key performance indicators for city staff, which are
    informed by citizen expectations, strategic and corporate goals, and legislative standards.
•   Ensuring financial strategies that define the relationships between maintenance and capital requirements,
    debt strategy, reserve strategy, and annual revenue opportunities and strategies. Recommendations
    have been made for short- and long-term budget requirements.

These stages culminated in a comprehensive final AMP in 2017. The municipality received a grant of $52,335
through FCM’s Municipal Asset Management Program to fund its asset management roadmap and CCTV
scans of sewers, gather asset data from under roads, and shift from age-defined to condition-defined data
for water and wastewater assets.

Kenora is committed to being “Stewards of the Lake.” The City’s Environmental Advisory Committee was
enacted in 2009, as a part of an environmental policy outlined in the Official Plan which is “intended to create
Page | 7
October 2019
a culture of environmental awareness.” The Committee is made up of representatives from the general
public, regional school boards, Lake of Woods Property Owners Association, business community, and City
Council. The role of the Committee is to provide direction to City Council and maximize opportunities to
adapt to the impacts of climate change and reduce negative impacts on the environment. Kenora’s most
recent steps towards climate change adaptation include a comprehensive Climate Change Adaptation and
Resilience Study and a Climate Change Risk Assessment Framework.
According to the Ontario Ministry of Natural Resources and Forestry (MNRF), northern Ontario will
experience greater temperature increases due to climate change, as compared to southern Ontario.2
Increases in temperature, as well as increased severity of rainfall events, have resulted in a higher frequency
of storms, severe winds, and flooding, which have impacted the stormwater system. The 2017 AMP identified
stormwater as the asset category most at risk. With 48% of all stormwater assets in poor to very poor
condition, the municipality received an F in this asset category on its Infrastructure Report Card.
A major flood in the spring of 2014 resulted in water levels reaching the highest peak in 85 years of record
keeping. Frequent flooding during the summer of 2016 cost over $290,000 in repairs to damaged culverts
and roads.3 Funding programs exist for local governments in Ontario under the Municipal Disaster Recovery
Assistance program, but Kenora has not been eligible to apply, since their flooding events were not deemed
significant under the eligibility requirements.4 Flooding and other extreme weather events result in
both short-term costs for immediate repairs, as well as long-term costs as a result of accelerated asset
deterioration. The water assets that are most at risk due to these weather events are extremely valuable to
the city. According to the 2017 AMP, these assets have a combined value of $229 million based on replacement
costs, which can be broken down to $111 million for potable water infrastructure, $96 million for wastewater
collection and treatment infrastructure, and $22 million for stormwater infrastructure.
Social and ecological impacts of climate change have also been noticed by local residents and municipal
staff. Higher temperatures during the winter and summer months, as well as flooding, affect the day to day
lives of citizens. Algae bloom proliferation as a result of increased light, warmer temperatures, and damage
to beaver dams from heavy rainfall and storms can have a significant effect on the local environment.5
Climate Change Impact Profile
Kenora experiences very cold winters and mild summers, with high levels of precipitation.6 The chart
below shows the average high and low temperatures in the months of January and July, as well as annual
precipitation in 1960, 1980, 2000, and 2018.
Temperature Range and Annual Precipitation in Kenora
Average High Average Low Average High Average Low Yearly
January January July July Precipitation
1960 -11.6°C -19.3°C 24.4°C 14.2°C 683.1 mm
1980 -12.5°C -21.6°C 22.2°C 12.9°C 574.8 mm
2000 -11.5°C -21.5°C 24.3°C 14.4°C 982.3 mm
2018 -10.4°C -19.5°C 25.8°C 25.8°C 612.4 mm
Source: http://climate.weather.gc.ca/historical_data/search_historic_data_e.html
Page | 8
Using Better Data to Identify Climate Change Related Infrastructure Vulnerabilities in Canadian CommunitiesClimate Change Adaptation and Risk Assessment
The Environmental Advisory Committee supported city staff in implementing climate adaptation measures
such as LED lighting conversion, window replacement at City Hall, stakeholder engagement for a Community
Energy Plan, and energy audits on all City facilities.7 However, prior to 2018, the City did not have a
comprehensive plan to address the impacts of climate change on municipal infrastructure, which is a goal
outlined in its Strategic Plan.
Special Projects and Research Officer, Adam Smith, determined that the City could utilize its existing AMP
and software to integrate climate change considerations. In 2017, FCM introduced the Climate and Asset
Management Network, which included peer learning and training, access to a network of professionals and
asset management resources, as well as a total of $1.6 million in grant funding. These grants were available to
support projects with an objective of better integrating climate change and sustainability goals into decision-
making about infrastructure assets and services. The City of Kenora was a successful recipient ($80,500) and
hired the consulting firm PSD to update their AMP and risk framework to include climate change adaptation.
PSD undertook a climate change adaptation resilience study, followed by a Climate Change Risk Assessment
Framework for core infrastructure.
The following catalysts were used to gain buy-in from City Council, staff, and other
stakeholders:
• Physical, economic, social, and ecological impacts of climate change were already becoming apparent
to city staff and members of the community, therefore prompting action.
• Under O.Reg 588/17, municipalities in Ontario are required to adopt an AMP which includes
commitment to levels of service, lifecycle management, and mitigation approaches to climate change.
• The proposed project would satisfy the environmental principles defined in the City’s Strategic Plan.
• The FCM grant of $80,500 would cover a significant portion of the project costs.
• The findings from the study and framework would generate staff awareness of climate change impacts.
• The findings could also contribute to future business case reports; supplement applications for grant
programs, garner support from City Council, and make a business case to the province for funding.
• PSD was already familiar with the City’s asset management program/software and could ensure that
the research was properly integrated with the AMP.
The project was led by Smith, who works within the CAO’s office. As the Special Projects and Research
Officer, Smith guides the City’s asset management program and works with the finance, public works, and
engineering departments, as well as the GIS technologist. During this project, the various departments
worked together to increase staff awareness of climate change impacts on city infrastructure and
operations.
Municipal staff from all departments contributed to the research by identifying climate change-related
risks to infrastructure, the local environment, key economic industries, and citizens’ health and safety.
Information was gathered by PSD through interviews, the City’s environmental assessments and other
reports, and through correspondence with city staff. The Climate Change Risk Assessment Framework
required further data gathering; public works and engineering worked together to identify linear assets and
Page | 9
October 2019gather necessary asset attributes to fill the data gaps. A GIS technician integrated the asset data with the
GIS system and also identified problem areas on the map based on the likelihood of flooding and population
density.
Climate Change Adaptation and Resilience Study
Kenora’s climate change adaptation and resilience study was developed by PSD. The study began with
an overview of how climate change is affecting Canadian municipalities and the associated costs
of mitigation. The implications of climate change on the City’s key physical (roads, water, bridges,
and facilities), social (public health and safety), economic, and ecological factors (biodiversity
and eco-assets) were defined. PSD worked with municipal staff to gather the information needed
and determine the best methods to calculate vulnerability and analyze risk. Sources from the
municipality included: interviews with staff, environmental assessments, and the asset inventory
and AMP. To supplement this data, information was also collected from Environment and Climate
Change Canada (ECCC), ICLEI Canada, Standards Council of Canada, and the Public Infrastructure
Engineering Vulnerability Committee (PIEVC).
According to the MNRF, temperature increases and higher levels of precipitation will be the most
significant climate change threats within the Nelson River watershed. Projections suggest a mean
annual temperature increase of 8.8°C by the year 2080, largely due to increased temperatures in
the winter. Winter precipitation levels are projected to increase slightly from 19 to 22 mm between
2011 and 2040, to 31 mm by 2070. In the summer, precipitation is projected to be volatile, with a
possible decrease by 19 to 21 mm between 2011 and 2040; 7 to 27 mm between 2041 and 2070; and
3 to 44 mm between 2071 and 2100. Based on findings from the 2014 Intergovernmental Panel on
Climate Change’s fifth assessment report, MNRF data, the City’s current asset condition and levels
of service, the following climate change impacts were identified to be a threat to the City’s water
infrastructure:
• Higher temperatures accompanied by reduced precipitation in the summer can reduce soil
porosity. Reduced soil porosity limits the volume of water than can be absorbed, resulting in
higher volumes of water flowing through routes and minor systems.
• Increased flooding caused by an increased intensity in precipitation can overwhelm the
capacity of storm infrastructure. Flooding can cause damage to public and private property,
potential sanitary sewer overflow, and malfunction of electric systems.
• Variability in temperatures within seasons can exacerbate freeze/thaw cycles and winter
flooding. These impacts can cause pipe bursts and shifting infill, which leads to increased
stress on subsurface infrastructure.
• Higher temperatures and drier conditions can create a higher risk of forest fires, which poses
a risk to green and grey infrastructure.
The study concluded that the City’s current level of service and procedures surrounding asset
management would not suffice to prevent these adverse effects of climate change. An analysis of
Kenora’s eco-assets and wildlife identified four possible ecological impacts of climate change: 1)
a decline in the local moose population due to warming winter temperatures, which can result in
Page | 10
Using Better Data to Identify Climate Change Related Infrastructure Vulnerabilities in Canadian CommunitiesPSD’s Climate Change Risk Assessment Framework
A risk assessment framework is a useful tool for municipalities when limited internal resources are
available to immediately address capital and operating needs. Risk acts as a key measure related to
the level of service provided in the community and can guide planning for numerous departments.
The framework focuses on assets identified by the overall value, relative to the community’s entire
asset portfolio, the level of detailed asset data available, and their criticality level. Once the asset
categories are identified, consultants work with staff to create tailored risk matrices that translate the
risk potential into a quantifiable format. Risk is defined by the probability of failure multiplied by the
consequence of failure. The consequence of failure parameters are aligned with a triple bottom line
approach, which includes economic, social, and environmental considerations. Once the consultants
identify the data gaps and the data inventory is updated, the matrices support a risk analysis, which can
apply risk ratings to all assets. The consultants can then provide guidelines that allow the community
to apply the risk assessment framework on an ongoing basis when new or updated data sources are
introduced.
parasite infestation and disease proliferation; 2) the growth of algae blooms as a result of increased
light, warmer temperatures, and lower precipitation in the summer and fall; 3) threatened fish
survival as a result of increased greenhouse gas (GHG) emissions; and, 4) altered wind patterns
which may cause the lake to no longer stratify. If the lake does not stratify, the entire lake (instead
of just the top layer), will experience warming during the summer months, impacting underwater
habitat.
The study also describes how climate impacts on infrastructure and the environment will
have negative impacts on the economy and the health of citizens. It provides a number of
recommendations to alter or further develop the City’s governance strategy, data gathering
and analysis, and levels of service. The following list includes a sample of some of the study’s
recommendations:
• Modify disaster management planning to respond to new risks identified in the risk
assessment.
• Switch insurance and adapt financial risk management.
• Work toward developing a Water Infrastructure Master Plan to assess the capability of
existing infrastructure to meet future operational requirements and provide a framework to
guide long-term asset management planning.
• Promote the planting of local natural vegetation along bodies of water to reduce the risk of
erosion and need for maintenance, while enhancing local biodiversity.
• Research and invest in new structural materials that are more resistant to flooding and
extreme weather events.
Page | 11
October 2019• Improve the data collected at weather and climate monitoring stations, to satisfy the needs
of both climate change experts and engineers.
• Determine the most suitable approach to gathering climate data for the municipality, and
ensure that data is collected efficiently and is made available in a centralized location.
• Develop public engagement initiatives to increase awareness of the value of climate change
response strategies.
• Determine the municipality’s capacity to identify and evaluate the cost of the natural assets,
particularly those that provide tangible benefits to the municipality.
• Identify and create a plan to address the potential risks to key economic industries, such as
boating, healthcare, manufacturing, and mining.
Climate Change Risk Assessment Framework
The risk assessment framework is an effective avenue to integrate climate change considerations into a
community’s asset management program because it supports short- and long-term infrastructure planning.
The types of data needed are: an asset inventory that is comprised of all core and non-core asset groups;
asset attributes such as measurements, materials, and other details specific to the asset type; location;
historical costs; in-service years; estimated useful life; replacement cost; and assessed condition. The City
needed further attribute data on linear assets and population density data and to identify problem areas
based on the likelihood of flooding. Staff in public works and engineering, along with the GIS technician,
worked together to ensure the risk assessment framework had meaningful data. The risk model was defined
by the following equation:
Risk = Probability of Failure (POF) × Consequence of Failure (COF)
POF describes the likelihood that an asset will fail at a given time and the parameters are often defined by the
current physical condition and service life remaining. Kenora’s POF included current physical condition and
identified problem areas. COF describes the overall effect that an asset’s failure will have on the community
and its asset management goals. Kenora’s COF parameters were aligned with a triple bottom line approach,
and include economic, social, and environmental consequences. Economic measures were defined by the
monetary consequences of asset failure to the community and its citizens; social measures were defined by
the consequences of asset failure on the citizen health and safety and the interruption of day-to-day life;
and environmental measures were defined by the consequences of asset failure on an asset’s surrounding
environment.
The weighting process for the POF and COF were determined through consultations with city staff to
identify priority concerns. The first risk parameter used to determine POF was current asset condition, and
the second was the identification of problem areas throughout the City. Staff identified geographic areas
that have experienced extreme weather events in a higher frequency and severity in recent years, and more
specifically, significant flooding due to heavy rainfall.
Page | 12
Using Better Data to Identify Climate Change Related Infrastructure Vulnerabilities in Canadian CommunitiesCOF is a much more complex matrix and was defined by the following graphic: A major roadblock to the climate change risk assessment was a lack of data to define the economic COF. The City’s dataset is incomplete as it relates to asset replacement costs. To move the project ahead, economic consequences were defined by “land use” and did not take into consideration replacement costs. The Official Plan Designation of land use by the City can inform the economic consequences of asset failure in a zone based on whether the use of the land significantly impacts the City’s economy. Once the replacement cost data is gathered, the matrix can be amended to include the new data in the weighting system. With the current dataset, PSD performed a full risk analysis on the asset group identified in the table below. These assets were identified to have the highest risk rating based on the new risk matrices that include climate considerations, and nine of the ten assets identified were water assets. Kenora’s Top 12 Highest Risk Assets Asset ID Asset Type Name In-Service Date POF COF Risk Rating 17712 Storm Mains Sewer 458 1/1/1920 5 3.9 19.5 16590 Water Mains Water Line 562 1/1/1930 5 3.8 19 19688 Sewer Mains Sanitary Line 847 1/1/1930 5 3.8 19 17544 Storm Mains Sewer 292 1/1/1920 5 3.6 18 18654 Storm Mains Sewer 1399 1/1/1920 5 3.6 18 20877 Paved Roads Ninth Avenue S 1/1/1985 5 3.6 18 16529 Water Mains Water Line 501 1/1/1905 4.2 4.16 17.47 16530 Water Mains Water Line 502 1/1/1905 4.2 4.16 17.47 16538 Water Mains Water Line 510 1/1/1900 4.2 4.16 17.47 16539 Water Mains Water Line 511 1/1/1905 4.2 4.16 17.47 Page | 13 October 2019
At the end of the project, the City was provided with a risk assessment framework, recommendations for
future data gathering, and guidelines on how to implement the framework on new or updated data sets. The
matrices can be modified over time to fit the City’s changing needs and priorities. By using the framework to
identify the risk ratings of municipal assets, the City can improve project prioritization, short- and long-term
financial planning, and day-to-day maintenance planning.
Roadmap for Municipal Adoption
The City of Kenora will have an opportunity to use the risk assessment results to inform its short- and
long-term financial strategies. In the future, city staff will gather replacement cost data and introduce
more climate change impact measures within the matrices. Adam Smith notes that the climate risk project
allowed them to refocus the City’s AMP, and that involving staff from engineering, public works, and finance
led to a much better overall understanding of the requirements and policies surrounding asset management
planning. Kenora’s infrastructure deficit, limited staff capacity, and restricted budget are typical of many small
Canadian municipalities. Nevertheless, they were able to use their existing asset management program to
integrate climate change considerations and begin more advanced climate change research.
Endnotes
1 White, Eric. “Census: thousands leave northern Ontario Cities over last 5 years.” CBC Sudbury. February 9, 2017 https://www.cbc.ca/
news/canada/sudbury/census-northern-ontario-population-1.3971780.
2 Colombo, S.J., D.W. McKenney, K.M. Lawrence, and P.A. Gray. “Climate Change Projections for Ontario: Practical Information for Policy-
makers and Planners.” Ontario Ministry of Natural Resources. http://www.climateontario.ca/MNR_Publications/276923.pdf.
3 CBC News. “Kenora flooding fears wash over from Rainy River.” CBC Thunder Bay. June 16, 2014. https://www.cbc.ca/news/canada/
thunder-bay/kenora-flooding-fears-wash-over-from-rainy-river-1.2677165 Young, Ryan. “Flooding Last Summer to Cost Kenora Roughly
$290,000.” Kenora Online. April 19, 2017. https://www.kenoraonline.com/local/flooding-last-summer-to-cost-kenora-roughly-290-000.
4 Ministry of Municipal Affairs and Housing. “Guidelines to apply for Municipal Disaster Recovery Assistance (MDRA).” Queen’s Printer
for Ontario, 2012-19. https://www.ontario.ca/page/guidelines-apply-municipal-disaster-recovery-assistance-mdra.
5 CBC News. “Kenora Mayor Declares Sate of Emergency.” CBC Manitoba. June 28, 2016. https://www.cbc.ca/news/canada/manitoba/
kenora-mayor-declares-emergency-1.3656958.
6 Climate Data. “Climate Kenora.” https://en.climate-data.org/north-america/canada/ontario/kenora-764472/.
7 Kenora. “Strategy Plan: 2015 to 2020.” City of Kenora. http://kenora.ca/wp-content/uploads/2018/05/2017-Strategic-Plan-Prog-
ress-Report.pdf.
Page | 14
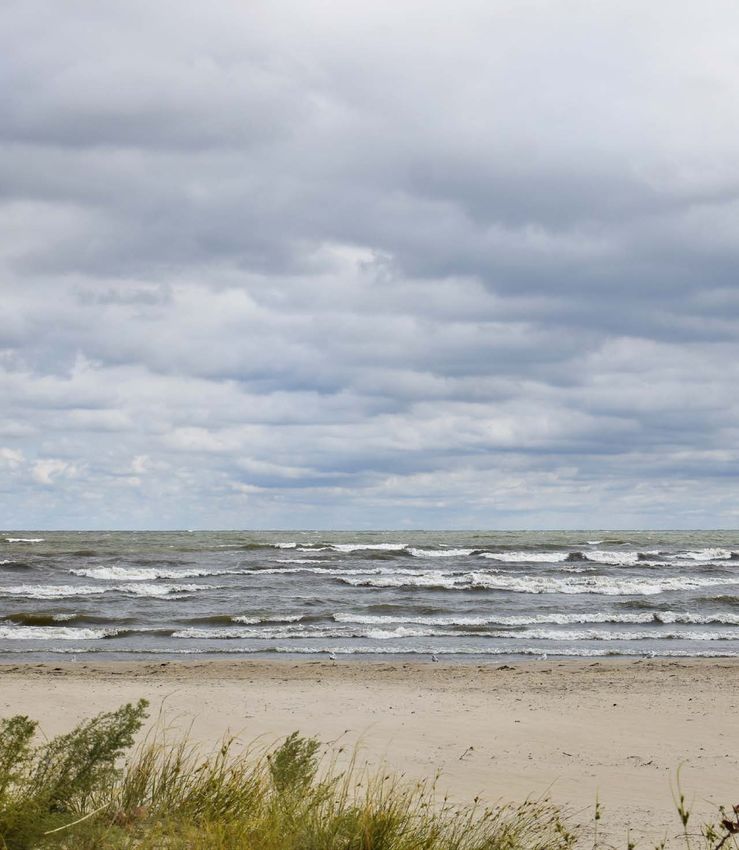
Using Better Data to Identify Climate Change Related Infrastructure Vulnerabilities in Canadian CommunitiesCase Study City of Edmonton The City of Edmonton and EPCOR have been working to establish a baseline of climate risks facing the community, including risks and vulnerabilities to assets. Edmonton has taken on a city-wide approach to climate change adaptation through its Climate Change Resiliency and Adaptation initiative. The City’s Environmental Strategies group identified vulnerabilities and conducted a risk assessment for the city. EPCOR has been working to develop a more specific assessment of risks and vulnerabilities at the storm-water sub-basin level.
Background: Edmonton and EPCOR’s
Leadership on Climate Change
The Edmonton Declaration was established following a Global Mayors’
Climate Summit on March 3-4, 2018 in Edmonton. This Declaration calls
on all levels of government “to undertake climate risk and vulnerability
assessments to guide planning and investment decisions, increase
climate resilience, and minimize the exposure of people and assets to
the impacts of climate change.”1 Edmonton Mayor Don Iveson led this
initiative, as well as the development of Edmonton’s Climate Resilient
Adaptation Strategy and Action Plan, which considers risk assessment
and vulnerabilities for Edmonton. By identifying potential climate
impacts now, Edmonton can prioritize mitigation and adaptation
efforts to build greater resiliency.

EPCOR, a commercial utility that provides power, water, drainage, and
natural gas services to more than 2 million customers in Canada and
the United States, has been working with the City to develop a more
specific assessment of risks and vulnerabilities at the stormwater sub-
basin level. EPCOR is governed by an independent Board of Directors,
but Edmonton is their sole shareholder.

Edmonton’s water, wastewater and drainage system assets are owned
by EPCOR and water rates are set by City Council. Because of their unique
relationship, the City and EPCOR work closely together on municipal
goals and priorities. EPCOR’s team have contributed to Edmonton’s
overall resiliency goals by providing a detailed risk assessment of
stormwater assets. They are looking at risks and vulnerabilities at
the stormwater sub-basin level and recently completed a climate
risk overview using GIS and flood plain mapping for more than 1,400
stormwater basins. As part of this effort, EPCOR is developing a
stormwater integrated resource plan (SIRP), building out risk through
several different dimensions to prioritize adaptation actions.

Climate Change Impact Profile
Historically, Edmonton experiences a continental climate, characterized
by cold winters, short summers and low precipitation. Maximum
precipitation typically occurs in June, with the majority of precipitation
occurring through the summer months. Severe weather is frequent
as a result of localized conventional heating and cooling at higher
altitudes. Winter is typically long and cold, frequently with the
occurrence of continuous snow cover. Edmonton generally experiences
a lot of sunshine in both the summer and winter. Their average daily
lows throughout the winter range from -11°C to -19°C, and 3°C and 9°C
in the summer.2
Highlights from the Edmonton Case Study

    •   This region experiences a prairie-steppe climate; dry, with the majority of precipitation happening
        in the summer months. The winters are very cold, with a very long snow season.
    •   EPCOR provides water, wastewater and drainage services to over 800,000 residents in Edmonton.
    •   In 2018, the City of Edmonton created a 4-year Climate Resilient Adaptation Strategy and
        Action Plan. In conjunction, EPCOR introduced an Integrated Resource Planning (IRP) approach
        to stormwater management that considers environmental and social externalities; operational,
        planning and infrastructure responses; risk assessment and management; and a participatory
        process to incorporate continuous improvement.
    •   EPCOR undertook comprehensive public engagement on the prioritization of sub-basins for flood
        mitigation measures. The public identified health and safety and social impact risks as a higher
        priority than environmental and financial risks.
    •   The consequences of a range of flooding scenarios was assessed. Data from a range of sectors and
        departments were incorporated.
    •   Results from both the public consultation and risk assessment yielded useful information to inform
        decision making on flood mitigation measures, including capital, operational, green infrastructure
        and flood-proofing by property owners.

The City consulted models from the Intergovernmental Panel on Climate Change and other scientific studies
to determine local climate variables and their potential impact. Four overarching categories are identified
in Edmonton’s Climate Resilient Adaptation Strategy and Action Plan: changing temperatures, changing
precipitation, changing weather extremes, and changing ecosystems.

•   Changing temperatures:3 Edmonton will see an increase in average temperatures across all seasons.
    The current average temperature in Edmonton is 2.5°C, but this is expected to increase by approximately
    3.5°C to 5.6°C by 2050 and 6°C to 8°C by 2080 (see figure below). The average winter temperature of
    -13°C is predicted to increase by 4.5°C by 2050 and 7°C by 2080. These temperature changes will impact
    precipitation and drought conditions.
                    Projected Annual Temperature Change in Edmonton, Alberta

Page | 17
October 2019
• Changing precipitation: Edmonton currently experiences an annual average precipitation of 458mm.
Between 2014 to 2080, Edmonton may see an increase of 40mm; and an increase of 54mm is expected
between 2071 and 2099. The biggest seasonal increase in precipitation is expected to occur in the spring,
while precipitation is expected to decrease during the summer months. It is likely that Edmonton will
experience drier summers, wetter winters, and more heavy precipitation events.4
• Changing weather extremes: The frequency and severity of extreme weather such as wildfire, extreme
rainfall or snow, freezing rain, high winds, and lightning are expected to increase.5
• Changing ecosystems: Long-term ecological changes (e.g., frost, length of growing season) could
contribute to a shift from a boreal/aspen parkland ecosystem to a grassland ecosystem, similar to what
we see currently in Southern Alberta.6
Edmonton’s Adaptation Strategy and Action Plan
Edmonton’s Climate Resilient Adaptation Strategy and Action Plan includes three phases:
Phase 1: Investigation
The City considered other cities’ adaptation strategies and participated in the International Council for Local
Environmental Initiatives’ (ICLEI) Building Adaptive and Resilient Communities (BARC) program. Edmonton’s
unique climate change risks and vulnerabilities were identified using a taxonomy of hazards created by the
Global Covenant of Mayors for Climate and Energy. The Covenant’s standardized reporting framework —
Climate Risk and Adaptation Framework and Taxonomy — enables cities to perform robust and consistent
reporting of local climate hazards and impacts, risk and vulnerability assessment, and adaptation planning
and implementation.7 The City then formed stakeholder groups to identify potential impacts of climate
hazards and create an overarching baseline.
Phase 2: Direction Setting
The City consulted local stakeholders about vulnerability and risk. This was a quantitative process that looked
at each climate hazard through an assessment of the likelihood and consequence of climate variables such
as freeze-thaw cycles, heavy precipitation, urban flooding, heavy snow, freezing rain, impacts on the growing
season, and drought. Likelihood was based on event probability, such as a 1-in-25 year storm. Consequences
in four categories (health and safety, economy, social well-being, and natural environment) were determined
by quantifying potential physical damages and service losses to assets and service levels using published
damage curves, quantitative vulnerability indices scales, and subject matter expertise.
Phase 3: Taking Action
Based on the findings described above, Edmonton established five paths to climate resilience: science and
evidence-based decisions; preparing for changing temperatures; preparing for changing precipitation;
preparing for changing weather extremes; and, preparing for changing ecosystems. Within each path, there
are a series of goals and actions identified. The development of Edmonton’s comprehensive adaptation
strategy and action plan took a considerable amount of staff time and resources. Edmonton had one full-
time employee on the initiative over the past two years, with additional help from other team members who
were not dedicated solely to this work. Edmonton did retain consulting services to help with the strategy
development. City Council has allocated some funding to this work over the next four years, and a staff
implementation team has been assigned to oversee this work.
Page | 18
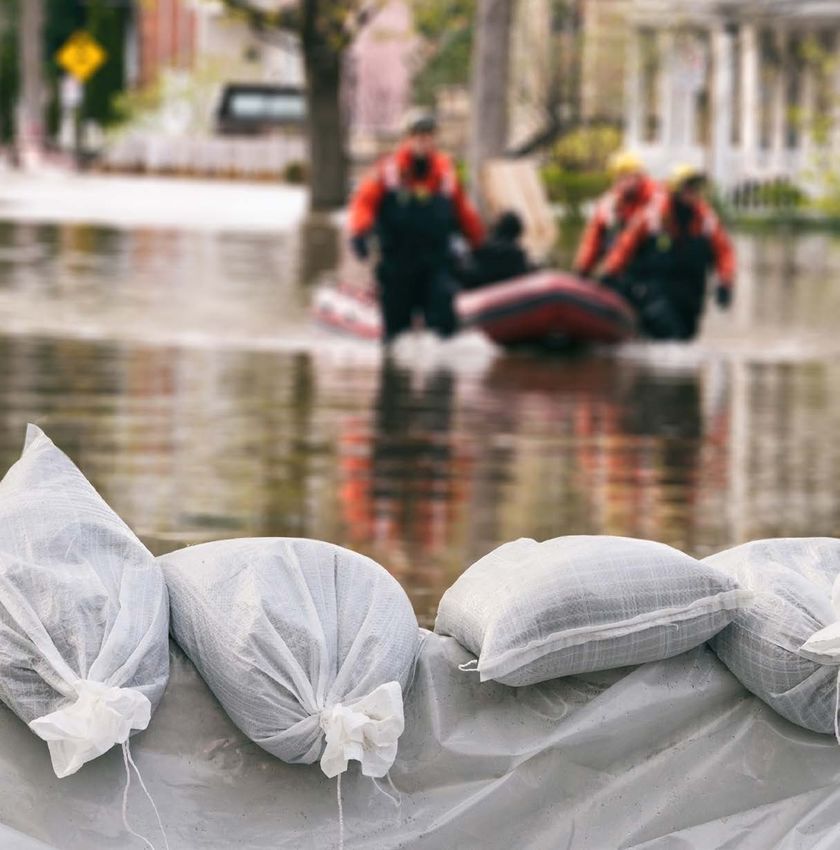
Using Better Data to Identify Climate Change Related Infrastructure Vulnerabilities in Canadian CommunitiesEPCOR’s Stormwater Integrated Resource Plan One of Edmonton’s identified goals in its adaptation strategy is to become a flood resilient city. To achieve this, the City has partnered with EPCOR to develop and implement an urban flooding resilience program. This includes the implementation and update of EPCOR’s Stormwater Integrated Resource Plan (SIRP). EPCOR’s integrated resource planning (IRP) approach “takes a holistic approach that integrates environmental and social externalities; operational, planning and infrastructure responses; risk assessment and management; financial analysis; and an open participatory process that incorporates continuous improvement.”8 Establishing Mitigation Priorities through Public Engagement EPCOR consulted Edmonton’s citizens to determine which flood impacts should be priorities in the SIRP risk framework.9 They surveyed local residents on the following four types of impacts during moderate, major and extreme flooding: public health and safety, social issues, environmental issues, and financial losses. Protecting public health and safety and minimizing social impacts from flooding emerged as clear priorities. Based on this public opinion research, EPCOR established specific risk exposure targets for the public’s highest flood protection priorities — hospitals, essential services, protection of life, and social services. The next most important priority identified in the survey was household flooding. Financial and environmental impacts were ranked lower that other types of impacts. Using this information, areas that could experience various types of impacts were prioritized accordingly in the risk framework. Building the Risk Framework: Determining Potential Flood Impacts, Risk Dimensions, and Priority Sub-basins Stormwater sub-basin capacity risks were determined by assessing the potential for basement and overland flooding. Risk frameworks were developed using various forms of data, including historical engineering analysis reports, historical flood records, and overland flood models from the Province of Alberta and insurance industry. Stormwater asset condition information, sanitary surcharge modelling, underpass modelling, river valley neighbourhood modelling, hydraulic models of stormwater pipes, GIS data, and the location of key features, such as hospitals, fire halls, schools, wastewater and water treatment plants, reservoirs, and pump stations were also used.10 Potential flood impacts were based upon flood risk exposure and whether the sub-basins could reach damaging flood depth levels. Five storm events were assessed: 1:20, 1:50, 1:75, 1:100 and 1:200 year storm events. EPCOR also collaborated with the insurance industry to ensure that they were aligned in their approach to assessing risk to a property over its lifetime. They purchased insurance flood forecast maps for Edmonton at a relatively low cost from a modelling company that estimates overland and river flooding depths for seven different storm scenarios (1:20, 1:50, 1:75, 1:100, 1:200, 1:500, and 1:1500). EPCOR incorporated this information up to the 1:200 storm level in their risk framework analysis. The utility plans reference 1:500 and 1:1500 storm levels when developing mitigation plans for the sub- basins to determine how these events could be managed by the proposed improvements.11 While the insurance overland flood maps can provide a baseline for flooding risk assessment, it is important to highlight that the flood maps used by the insurance industry currently do not consider the capacity of municipal stormwater pipe networks to reduce flood risk. Page | 19 October 2019
The risk framework was developed based on the four types of flooding impacts used in the public
engagement survey (public health and safety; social issues; environmental issues; financial losses). For
each of the four categories, data sets were analyzed to determine the consequence and likelihood of
flooding occurring within a particular sub-basin. When looking at these four different risk dimensions,
risk was driven by different flooding conditions. For example, risk to health and safety was largely
driven by three flooding conditions:
• Increased risk of basement flooding due to sanitary sewer pipes surcharging to a depth greater than
    typical basement floor elevation. If the home does not have a backwater valve, this can result in the
    health risk of exposure to sanitary sewage (1:50 storm and greater).
• Increased risk of creek erosion due to higher flows may impact the stability of banks and trails and
    increase the risk to personal safety (1:20 storm and greater).
• Increased depth of overland flooding in low-lying areas like underpasses and sag areas (1:20 storm and
    greater).12

EPCOR worked with the City of Edmonton’s Utility Committee, which is made up of representatives from
Edmonton City Council, to identify scenarios exploring different weighting schemes for the four risk
dimensions:
• Scenario 1: Equal weighting of all four risk dimensions – 25% each
• Scenario 2: 30% Health and Safety, 30% Social, 25% Financial, 15% Environment
• Scenario 3: 40% Financial, 20% for all Health and Safety, Social and Environment

The map below shows the results of Scenario 2, which places a higher emphasis on risk to health and safety
and social impacts, highlighting the basins which are at higher risk based on the various flooding conditions
considered. This scenario was selected by the Utility Committee to prioritize flood mitigation efforts and the
development of a 20-year capital and operational plan.

Assessed Risk for Sub-basins in Edmonton Using Scenario 2 Weighting of Risk Dimensions

                                                                                                                    Page | 20
                 Using Better Data to Identify Climate Change Related Infrastructure Vulnerabilities in Canadian Communities
Using the Risk Framework to Inform Adaptation Measures
EPCOR’s approach created a holistic view of the impacts of flooding on various city features, enabling the
SIRP to reflect public priorities in flood management. Some of the flood mitigation measures that EPCOR
will implement are trunk and sewer separation, outfalls and control gates, dry ponds, maintenance, weather
forecasting, and emergency response. After evaluating historical basement flooding records and local
convective storm patterns, EPCOR broadened the mix of capital and operational investments to also include
green infrastructure and flood proofing of at risk properties. These measures are intended to reduce ponding
on roads after storm events in areas which have depressions or sagging.
EPCOR is moving away from developing capital projects that are “named” projects (i.e. fixing an issue on
a specific street or neighbourhood) to performance-driven projects (i.e. choosing projects based on the
developed risk models, which identify issue areas). Their risk framework provides more flexibility in their
response to flood resilience, as there is more concrete information on flooding conditions and risk dimensions
to prioritize projects and inform decision-making. The development of EPCOR’s SIRP is directly aligned with
Edmonton’s overarching adaptation goals.
EPCOR’s reports to Edmonton’s Utility Committee as the SIRP was being developed can be accessed at
epcor.com/products-services/drainage/flood-mitigation/Pages/default.aspx. In May 2019, they presented a
proposed capital plan to the Utility Committee and are developing a 20-year capital plan.13 Future flood
mitigation work will include a combination of homeowner programs, drainage system improvements, green
infrastructure, and planning. EPCOR is also implementing a smarter stormwater network that will allow
the utility to anticipate and react to storms in real time using monitoring and control technology. EPCOR’s
overall goal is to slow, move, secure, predict, and respond to flooding events to prevent or reduce impacts.
Roadmap for Municipal Adoption
There are several elements of the approach Edmonton and EPCOR undertook that could be applied by other
municipalities looking to implement a holistic, risk-based stormwater management program in the context of a
broader climate change adaptation plan.
• Edmonton used the framework for adaptation from the Global Covenant of Mayors to establish potential
local impacts from climate change, as well as current risks and vulnerabilities. Establishing a baseline
of climate hazards and assessing the current state of vulnerabilities is something that the majority of
municipalities can accomplish with the assistance of staff and/or third-party expertise.
• Municipal leadership on citywide climate change adaptation contributed to the successful advancement
of EPCOR’s innovative stormwater management program. The initial stages of Edmonton’s broader
adaptation goals are achievable for small to mid-sized municipalities and will go a long way in supporting
climate change adaptation for municipal water systems, including driving efforts to identify infrastructure
vulnerabilities.
• This case study highlights the importance of bringing multiple stakeholders together to advance climate
adaptation. EPCOR conducted public and stakeholder engagement to help prioritize actions. The results
contributed to the creation of a combined risk scenario that placed greater emphasis on reducing health
and safety and social impact risks, with less emphasis on financial and environmental risks.
Page | 21
October 2019You can also read