Study on Equity Investments in Europe: Mind the Gap - Copenhagen ...
←
→
Page content transcription
If your browser does not render page correctly, please read the page content below
Study on Equity
Investments in Europe:
Mind the Gap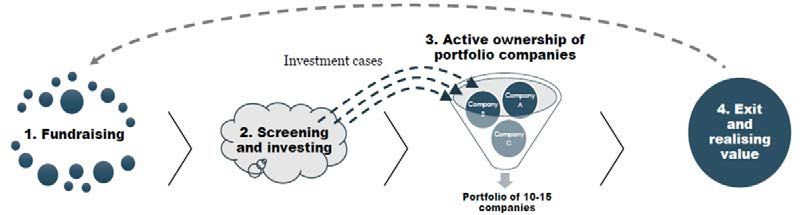
STUDY ON EQUITY INVESTMENTS IN EUROPE: MIND THE GAP
European Commission
Directorate-General for Research and Innovation
Unit RTD TF.3 – Financial Instruments
Contact Stéphane Ouaki
Email     stéphane.ouaki@ec.europa.eu
          RTD-PUBLICATIONS@ec.europa.eu

European Commission
B-1049 Brussels

Manuscript completed in February 2021.
1st edition.

This document has been prepared for the European Commission, however it reflects the views only of the
authors, and the European Commission is not liable for any consequence stemming from the reuse of this
publication.

More information on the European Union is available on the internet (http://europa.eu).

PDF          ISBN 978-92-76-28648-6               doi: 10.2777/001375           KI-04-21-014-EN-N

Luxembourg: Publications Office of the European Union, 2021

© European Union, 2021

The reuse policy of European Commission documents is implemented based on Commission Decision
2011/833/EU of 12 December 2011 on the reuse of Commission documents (OJ L 330, 14.12.2011, p. 39).
Except otherwise noted, the reuse of this document is authorised under a Creative Commons Attribution 4.0
International (CC-BY 4.0) licence (https://creativecommons.org/licenses/by/4.0/). This means that reuse is
allowed provided appropriate credit is given and any changes are indicated.
For any use or reproduction of elements that are not owned by the European Union, permission may need to
be sought directly from the respective rightholders.

Image credits:
Cover page: © Lonely #46246900, ag visuell #16440826, Sean Gladwell #6018533, LwRedStorm
#3348265, 2011; kras99 #43746830, 2012. Source: Fotolia.com.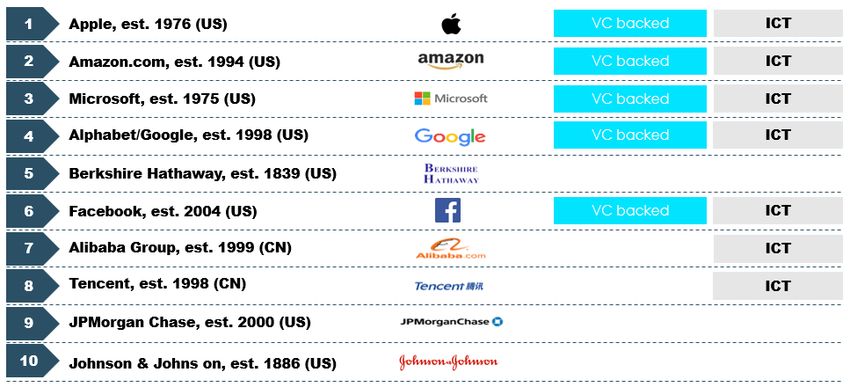
EUROPEAN COMMISSION

    STUDY ON EQUITY
     INVESTMENTS IN
  EUROPE: MIND THE GAP

                edited by Copenhagen Economics

                      Sigurd Næss-Schmidt

                       Jonas Bjarke Jensen

                  Charlotte Skovgaard Kjærulff

                       Astrid Leth Nielsen

       Directorate-General for Research and Innovation
2021   Enhanced European Innovation Council (EIC) pilot   EN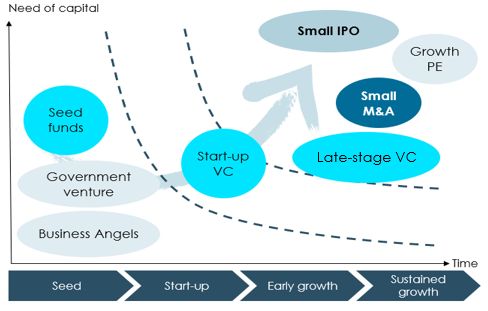
Contents
FOREWORD................................................................................................. 3
EXECUTIVE SUMMARY .................................................................................. 4

1 IMPORTANCE OF EQUITY MARKETS AND INNOVATIVE SMES
AND SMALL MID-CAPS       ..................................................................... 11
    1.1 Equity finance is suited for high-risk and high-upside investment
    projects                   ..................................................................... 11
    1.2 Equity finance is more than just funds .......................................... 15
    1.3    Impact of risk capital ................................................................... 17

2   EQUITY GAPS IN EUROPE                ..................................................................... 20
    2.1 Benchmarking to the US................................................................ 20
    2.2    Intra-EU benchmarking of equity markets .................................... 23
    2.3 Lack of equity finance will in particular
    hamper innovative sectors ................................................................... 43
    2.4    Key framework conditions driving these gaps .............................. 49

3   EVALUATION OF EXISTING PROGRAMMES AND RECOMMENDATIONS ............ 52
3.1    Why and how to support equity markets .......................................... 52
3.2    Description of existing EU policies and programmes ......................... 54
3.3 Evaluation of the functioning of
EU programmes to support equity markets............................................... 57
3.4    Recommendations                   ..................................................................... 64

REFERENCES ............................................................................................... 71
APPENDIX: ADDITIONAL FIGURES ................................................................. 79

                                                           2
FOREWORD
The creation of new companies with high scale-up potential is vital for the
sustained competitiveness of the European economy and Europe’s industrial
and technological leadership. In this context, this study should provide and
analyse data addressing the equity investments gap in Europe with a particular
focus on innovative SMEs and small mid-cap companies 1 as well as assess
existing support measures at EU level.
Concretely, the study has four key aims:
1. Outline and discuss the characteristics of equity finance.
2. Deliver conclusive information on the characteristics and size of
the equity investment gap, and sub-optimal investment
situations for SMEs at EU, national and sectoral levels.
3. Assess whether EU policy intervention has been catalytic in
helping fund managers raise funds.
4. Review the need for EU policy intervention and provide a set of
independent recommendations for such interventions.
The analysis together with the recommendations will underpin the policy
rationale for the design of one or more equity products to be set up under one
or more policy windows of InvestEU.
It should be noted that this report is drafted mainly throughout 2019, relying on
data where 2018 is the most recent year possible. Therefore, the impact of
Covid-19 on the VC/PE markets 2 in Europe is not reflected in our report.
1
Small mid-caps are defined as entities employing up to 499 employees that are not SMEs.
2
See, e.g., CB Insights (2020), How Covid-19 could impact start-up funding.
3EXECUTIVE SUMMARY
Having a well-functioning risk capital 3 market is crucial for innovation, economic
growth and investments. However, the need for external risk capital very much
depends on the concrete business model. Credit plus retained earnings will be
sufficient to address the investment needs of many SMEs and small mid-caps.
This secures the creditor a predictable repayment profile and return, whereas
the borrower gets to keep the entire upside from the investment. With equity
finance on the other hand, the investors are not guaranteed any return, but
instead they buy into the potential future earnings of the company. As such,
equity finance is well-suited for the few high-risk, high-return profile
companies, which are ineligible for credit. This typically characterises innovative
companies where high scale-up is possible. Such companies are often found
within ICT, life science and technology sectors.
The benefits to the wider economy of having a well-functioning risk capital
market is well-documented in economic research. For example, one study finds
that the return to society of a VC investment is around three times larger than
the private return. 4 In addition, 43 per cent of all US listed companies founded
between 1979 and 2013 are originally VC-backed, although VC funds only
invest in around 0.20 per cent of all start-ups. 5 Examples include some of the
world’s largest and most innovative ICT companies such as Apple, Google and
Microsoft, which originally were backed by VC.
Equity finance is more than just funding. Along with the capital investment
often comes extensive coaching and value-added support from the equity
investors whether they be business angels, or the investment teams and sector
experts employed by the General Partners (GPs) in VC and PE constructions.
The incentive here is obvious – they own part of the company and thus have a
clear motivation to accelerate its development and boost its growth potential. It
requires knowledgeable external partners and investors that are actively
involved in an entrepreneurial eco-system, ultimately helping to bring
innovative companies to the market.
Equity gap in Europe
Despite a recent and gradual increase in investment volumes, the European
equity markets 6 continue to trail behind their US counterparts. For the large-
cap segment, the difference appears manageable, but within the small- and
3
We define risk capital as equity for start-ups and scale-ups, i.e. VC and growth PE. That is,
excluding buyout and other PE.
4
Romain and van Pottelsberghe (2004), The economic impact of Venture Capital.
5
OECD (2018a), A portrait of innovative start-ups across countries.
6
Throughout the report, unless otherwise stated, we refer to equity markets as the non-
listed market, i.e. business angels, Venture Capital and Private Equity.
4mid-cap segment, equity markets are around four times larger in the US than in
Europe (after adjustment for GDP). 7
The size of ICT and life science sectors in Europe points towards the potential
for more developed equity markets, as it is exactly these types of companies
that demand high-risk capital. A simple correlation between the size of ICT/life
science sectors and VC investments suggests a potential to increase the risk
capital market in Europe by around one-third. 8 This gap indicates a lack of
access to risk capital markets to fully utilise the potential of innovative high-
growth companies, which could eventually be an obstacle for economic growth
within these sectors. In addition, within the later-stage phases, the funding gap
lead companies to seek funding abroad, e.g. in the US or China. To the extent
this also makes companies shift their operations to outside EU, this could
further hamper growth in the EU (see also recommendation 4 below).
Nevertheless, we do not interpret the difference solely as a lack of supply of
equity finance: the causality also goes the other way – lack of innovative start-
ups and a well-functioning eco-system leads to low demand for risk capital.
Thus, the challenge is to create thriving ecosystems, where the high-quality and
scalable start-ups emerge along with sufficient risk capital funding.
Looking across European countries, there are large differences in the maturity
of the equity markets. For example, in Sweden, equity funds (including buyout
PE) manage to raise above 1.5 per cent of GDP each year compared to an EU
average of around 0.20 per cent. 9 However, it should be noted that the large
fundraising volumes primarily relate to the large-cap segment and is primarily
invested outside the respective countries. This highlights the very international
character of the large-cap equity market (i.e. buyout PE). Risk capital (VC and
growth PE) is a bit less mobile across borders due to the proximity required to
access and manage investments in smaller companies, particularly in the early
stages of development, which is better handled by a local presence.
Actual risk capital investments into portfolio companies also differ between
European countries, although not to the same extent as for equity capital
overall. France is one of the high scorers with above 0.20 per cent of GDP
invested each year, corresponding to some EUR 5 billion, whereas the Czech
Republic ranks lowest in the EU with some 0.01 per cent. 10
Growth in the size of the risk capital markets has been modest but steady over
the past decade. Particularly, 15 out of 21 European countries have experienced
positive growth in investments, contributing to an average annual growth rate
for the EU of around 6%. 11
7
Based on Invest Europe, Pitchbook and PwC/CB Insights MoneyTreeTM Report, see Figure
7.
8
Based on Invest Europe and OECD, see Figure 24.
9
Based on Invest Europe, see Figure 14.
10
Based on Invest Europe, see Figure 20.
11
Net of inflation. Based on Invest Europe and Pitchbook, see Figure 22.
5Deep tech, fintech and green technology are trending
Examining sector trends, we find that equity investments within deep tech
(investments in engineering innovation or scientific advances and discoveries),
fintech (investments in financial technology) and cybersecurity are expected to
rise in the future. In these sectors, the UK surpasses any other market. For
example, within fintech, total investment between 2016-2019 is larger in the
UK than that of the entire EU combined. 12
Also, cleantech and green technology are becoming increasingly popular
amongst funds, not least in light of the necessary transition to a low-carbon
economy, which is dawning on the European economies. In this transition,
equity funds have a crucial role to play since investment in green technologies
is by nature high risk. In addition to the technological risks (e.g. the technology
becomes outdated before it reaches the market), there is also a political risk
that initiatives making CO2 emissions more costly are ultimately not
implemented, thereby reducing the market incentives to develop, adopt and
acquire cleantech innovation. However, the upside can be equally large with the
potential of a global scale-up, if a company manages to introduce a winning
technology on the market before anyone else.
The green agenda also calls for EU support; in addition to the large general
societal benefit from equity investments, investments in cleantech can
contribute to the transition to a carbon neutral economy. These environmental
benefits are most likely not included in the private decision making of equity
markets, further advancing the argument for public support.
Evaluation of EU programmes and recommendations
The EU has a long-standing commitment to improve framework conditions and
increase capital availability for the European equity markets. This should be
seen in the wider context of the Capital Market Union, with the objective of
removing barriers to cross-border investments, lowering the cost of funding and
helping companies tap into diverse sources of capital in order to finance their
development and growth. Moreover, the EU has specific programmes in place
that directly support European funds – these programmes are the focus of this
report.
We have evaluated the InnovFin Equity, COSME - Equity Facility for Growth
(EFG), SME Window of the European Fund for Strategic Investments (SMEW
EFSI) and VentureEU programmes against a best-practice benchmark,
established in economic research. As such, our recommendations – based on an
economic assessment – should be seen as input to a coherent decision-making
also including legal and political priorities that are not part of the scope of the
report.
Fundamentally, from an economic point, the aim for public support is to create
a well-functioning and robust eco-system, which can then allow public investors
12
Based on Pitchbook, see Figure 34 in Appendix.
6to gradually scale back their support, as the private market becomes more self-
sustainable. In doing so, the most crucial aspect is that public funds must not
crowd-out or outcompete private investors wanting to invest into the funds.
Instead, public support should aim at crowding-in investors by taking up-front
risk where needed. This implies that the effect of public support is larger than
the actual invested amount.
General assessment: EU support to equity programmes is on track
In general, the EU’s support to equity markets follows these principles with a
clear intention to develop the European eco-system and crowd in private
investors. We attribute the somewhat modest growth of risk capital markets in
Europe to: 1) the fact that it takes time to create an equity market eco-system
– often decades; 2) the development of risk capital markets depends on a
number of structural policies, mostly at national level, thus beyond the scope
and control of the evaluated EU programmes.
Despite being overall on track, our evaluation of the EU programmes currently
in place has identified a number of focus areas for potential improvement.
These are recommendations – from an economic perspective – for which
direction the regulation, administration and execution of programmes should
go. Thus, they do not present a call for revamping of the support system to
European equity markets.
1) Make the objectives of the InvestEU programme simpler and allow flexibility
to Implementing Partners within a general framework and pre-established
principles
Going forward, the EU support to equity markets will be channelled through a
single programme, the InvestEU. This is a welcomed development, as the many
slightly different and sometimes overlapping objectives of the existing
programmes make it rather complex to understand and administratively heavy
to apply for funds.
Despite being an important step forward, we see that there is still room for
further improvement in streamlining InvestEU; based on preliminary blueprints,
there will be five policy windows within the InvestEU Fund – with a risk of
numerous overlapping windows to remain.
Thus, we recommend continuing efforts within InvestEU to streamline and
simplify the objectives, to allow the formation of a single equity product
covering all InvestEU policy objectives.
In addition to streamlining the objectives of the programme, the experience of
the existing programmes shows the need to review the level of detail and
prescriptiveness of the terms provided to the Implementing Partners. We have
noted that the programmes contain detailed specifications at transaction level,
which may prevent the Implementing Partners in charge of the programme
implementation to intervene effectively. Together with the high fragmentation
observed across European equity markets, investments into different types of
7intermediaries (e.g. first-time fund managers) with various investment
strategies (stage and sector focus etc.) call for distinct parameters.
Thus, we recommend considering how the objectives and terms of the InvestEU
could adhere to a more case-by-case approach, to allow for greater flexibility
for the Implementing Partners.
For example, the InvestEU programme could incorporate the ability to provide
larger commitments both in relative and absolute terms in given instances of
high added value. This could be the case of supporting a new market, e.g. high-
risk sectors such as deep tech and clean technologies or funds operating in
emerging geographies as well as cross-border focused funds. As mentioned,
this must be implemented with considerations to political and legal priorities.
2) Review the boundaries to risk absorption in EU programmes
In the design of the support programmes, an inherent risk aversion is built in;
1) a ceiling on provisioning rates, and 2) a pari-passu principle, which means,
in particular, that the EU should take risk on equal footing with private investors
(and both Implementing Partners and private investors for COSME - EFG).
This risk aversion might in some instances prevent the programmes from
effectively intervening in line with the EU policy objectives and crowding in
significant resources from private investors. The primary purpose of public
funding for risk capital instruments is indeed to compensate for market failures
associated with high-risk, high-potential investments often with large spill-overs
not captured by private investors.
Therefore, we recommend allowing EU programmes to take higher risks by
adhering to a non-pari-passu risk sharing principle in specified cases of high
policy value.
For example, we suggest that the provisioning rate and the pari-passu principle
could be deviated from when needed to effectively achieve certain high policy
priorities and to crowd in private investors. As such, this approach follows our
recommendation 1) on EU programmes adhering to a more principle-based
approach. In addition, it builds on the risk-sharing structure of the already
existing programme InnovFin Equity where EU’s contribution is subordinated to
the resources provided by IPs at programme level.
3) Ease the administrative burden
One of the issues most frequently raised during our stakeholder engagement is
criticism of the programmes being too compliance heavy and difficult to
administer. For example, several stakeholders mention that a fund needs a full-
time employee to do the necessary reporting and compliance, when applying for
EU funds. This is, in particular, a problem for smaller VC funds, which are often
the ones the EU programmes seek to support. As such, there is a risk that the
recipients of EU support are not those in most need and with the biggest
potential – but those best at handling administrative processes and writing
applications.
8Therefore, we recommend that the administrative procedure is revisited, with
the aim of easing the burden currently created by the process.
Such streamlining would need to take into consideration the legal and political
space where the EU funding takes place. Hence, such a review would need to
examine the trade-offs between easing compliance burdens and need to audit
programmes.
4) Support emergence of large later-stage Pan-European equity funds
The prospects of European growth companies in the pre-IPO phase are
constrained from the limited availability of later-stage financing in Europe. As a
result, many European-born companies seek towards the US and China to get
funding of a sufficient investment size – also because alternative channels of
financing are not well developed in Europe.
We expect a main cause of the issue to be the small average fund size of
European late-stage VC and growth PE funds, being around three times smaller
than the US equivalent. More specifically, it is our assessment that emergence
of funds in the range of above EUR 400 million would be necessary to
sufficiently accommodate the funding need of these high-growth companies.
Funds of this magnitude have not previously emerged on pure market terms at
a sufficient level, not least due to the issue of engaging large institutional
investors in the later-stage equity market. Therefore, public involvement to
kick-start this segment may be needed, and the support needs to be substantial
enough to make it sufficiently attractive for private investors to participate.
We specifically recommend that the EU support to later-stage funds should be
stepped up to allow contributing with investments of up to EUR 100 million per
fund, to create momentum to attract private investors of a sufficient size. In
doing so, the EU support could be made non-pari-passu in a balanced way, to
further boost the crowding-in potential.
5) Continue strong support to the European VC eco-system
Although the majority of VC markets in Europe have experienced growth in the
past decade, there is still a significant potential of further strengthening VC eco-
systems. The European VC funding is still trailing far behind its American
counterpart, and many geographies remain underserved.
The need for continued strong support is underlined by the fact that:
1. Informational barriers preventing optimal market outcomes are,
in particular, pronounced at the early stage.
2. If there is no funding for seed and start-up companies, few
companies can make it to the later stage and thereby utilise
their growth potential.
9In supporting the market, we suggest enhanced support for technology transfer
funds, which can enhance translation of research and scientific knowledge into
innovation and marketable products and technologies. 13 What is needed is the
emergence of dedicated technology transfer and pre-seed/seed funds that are
managed by professional and qualified teams with tech transfer expertise.
We therefore recommended that EU support to the European VC eco-system
should be maintained and further increased through enhanced contribution to
tech transfer.
13
EIF, Technology transfer: Converting research into products for the market.
101 IMPORTANCE OF EQUITY MARKETS AND
INNOVATIVE SMES AND SMALL MID-CAPS
In this chapter, we set the scene and explain the nature of equity finance and
its importance for growth opportunities for innovative SMEs and small mid-cap
companies (hereafter referred to as “SMEs” unless otherwise stated).
First, we outline that access to equity finance for new companies with a high
scale-up ambition and potential is particularly vital for the sustained
competitiveness of the European economy (section 1.1). We then argue that
this is not only in terms of financing provided but also as these companies are
getting advice and know-how from fund managers (section 1.2). Finally, we
provide evidence that risk capital indeed plays a crucial role for the creation of
valuable SMEs at a global level (section 1.3).
1.1 Equity finance is suited for high-risk and high-upside
investment projects
Fundamentally, there are two types of finance available for companies: credit
and equity. These two types of finance differ fundamentally in character, and,
when assessing lack of finance to SMEs, it is crucial to distinguish between the
two:
1. Credit is the promise of full reimbursement of funds plus interest.
This type of finance is typically carried out by banks, whereas
corporates (companies above the SME segment) can also use capital
markets to issue debt (corporate bonds). From an investor
perspective, credit finance is all about risk minimisation, i.e. to make
sure that the borrower will not default. The creditor (typically a bank)
has no upside from granting credit and the focus is on getting the
money back. As such, the possibility for major scale-up is less
important for a creditor as long as the business model is sufficiently
robust to ensure that the borrower repays the loan.
2. Equity: The investors get to own a part of the company and are thus
entitled to future earnings from the company, corresponding to the
share, i.e. investors buy into the potential upside of the company.
But equity investors are also subordinated to creditors and will only
get a return if the company produces a profit – after creditors are
paid. As such, the equity investors are prone to assume more risk,
including potential default, in return for a potential upside. For
example, the ambition is typically an increase in company value of
10-20 times for Venture Capital (VC).
The typical SME does not have the ambition and ability for such high scale-up
required by equity investors. Consequently, credit is the most suited form of
finance – also from an owner perspective, as they do not have to give up shares
11and hereby entitlement to all future profits. It is important to note that this
study does not cover the availability of credit for SMEs. 14
Equity finance is for companies with a major scale-up potential
For the few companies, particularly SMEs, that have an ambition to scale up,
the risks become too big for creditors, and equity finance becomes a relevant
source of funding. However, to be worth the major risks that equity investors
are running, the upside must be equally large. This means that SMEs eligible for
equity finance are often highly innovative, on the edge of the technology
frontier, with a unique selling point and most importantly a large scale-up
potential. As such, equity financing is not turning ordinary SMEs into growth
unicorns but is making the already high-potential companies even better. 15
Even successful SMEs in a market where scale-up is not possible will often not
be candidates for equity finance. This could for example be services using direct
customer contact, both within B2C and B2B such as consultancies, craftsmen,
accountants and hairdressers. Consequently, even in well-functioning equity
markets, it is the minority of SMEs that end up receiving equity finance. For
example, in the US with one of the world’s most well-functioning VC markets,
only 0.20 per cent of all start-ups between 1979-2005 received VC. 16 The
equity-backed companies typically represent sectors such as ICT,
pharmaceutical and certain retail product industries that do indeed have the
potential to serve the mass markets and thus have large scale-up potential.
For the few companies that are being funded by equity funds, again only a
minority manages to successfully establish on the market. For example, in the
Nordics, around half of all VC investments are loss-making, cf. Figure 1. These
losses are offset by the 25 per cent of the investments that provide return
higher than two times the invested amount. Finally, 4 per cent of the
investments return more than 10 times the invested amount.
In this context, it is important to note that companies with a return multiple in
between that of loss makers and high-growth unicorns often still make it as
successful companies that create jobs and growth.
14
For an analysis of the general financing of SMEs, see for example ECB (2019), Survey on
the Access to Finance of Enterprises in the euro area and OECD (2018d), Enhancing SME
access to diversified financing instruments.
15
EIF, The VC Factor: Data-driven insights about VC-backed start-ups in Europe.
16
OECD (2018a), A portrait of innovative start-ups across countries.
12Figure 1 Distribution of return multiples (TVPI) of companies in major Nordic VC funds
Based on the Nordic Venture Capital Index (NVPI) including all the major Nordic VC companies
Note: The return multiple is measured as Total Value to Paid-in-Capital (TVPI) and is the total value of the
funds’ cumulative distributions compared to paid capital.
Source: NVPI
Different types of equity finance are needed throughout the growth path of a
company
Equity finance can be categorised in four types. The first three types of equity
finance relate to start-up and scale-up of companies (see also Figure 2):
1. Seed VC and business angels: Early on, when the company is not yet
established and only has an idea or prototype, the entrepreneurs mostly
rely on own funds or perhaps business angel funding. The first round of
VC typically happens when the company has a prototype and some
revenue, usually with an investment size of EUR 0.1-4 million.
2. Start-up VC: Once the company has a product to show and possibly
some turnover growth, start-up VC funds become available, which are
arranged in several rounds of varying ticket sizes:
a. Series A: EUR 4-10 million.
b. Series B: EUR 10-25 million.
c. Series C: EUR 25-50 million.
3. Late-stage VC and growth PE: For newly established companies with
high growth during the first years and typically more than 100
13employees, late-stage VC and growth PE become available. Here the
focus is on growing an already proven business concept. In VC/PE
vocabulary, this is typically called Series C or Series D for late-stage VC
according to Invest Europe’s definition. 17 For growth PE, it refers to
Series D or Series E rounds, i.e. ticket sizes exceed EUR 50 million.
Throughout the report, we will refer to these three types of equity finance as
risk capital – capital used to sustain growth of start-ups. The fourth type is
buyout PE:
4. Buyout PE somewhat differs from risk capital as the focus is not
necessarily on scale-up of newly established companies. Instead, buyout
PE funds often identify already established companies with a large
growth potential conditioned on certain changes. This could for example
be:
o Potential for international expansion that the current board had
not considered.
o Buyout of ill-managed companies with a large growth potential
given a new management team.
o Possible synergies through several buyouts (e.g. buyout of
entire value chain with monopolistic competition).
Figure 2
Growth path of innovative start-ups and their funding needs
Source:Copenhagen Economics (2019), Economic footprint of Swedish venture capital
17
Invest Europe (2019), Invest Europe research methodology and definitions.
14It should be noted that the distinction between the different types of equity
finance is not clear-cut; different data providers use different definitions – and
it often relies on how the fund classifies themselves. For example:
• Whether Series B and Series C investments should be regarded as start-
up or late-stage VC is also not always clear-cut.
• A EUR +50 million investment into a start-up could both be considered a
late-stage VC as well as growth PE, depending on the type of fund from
which the investment originates.
• Buyout PE funds also sometimes buy into young companies, making the
distinction to growth PE unclear.
1.2 Equity finance is more than just funds
The tasks of VC and PE funds fundamentally differ from the usual credit
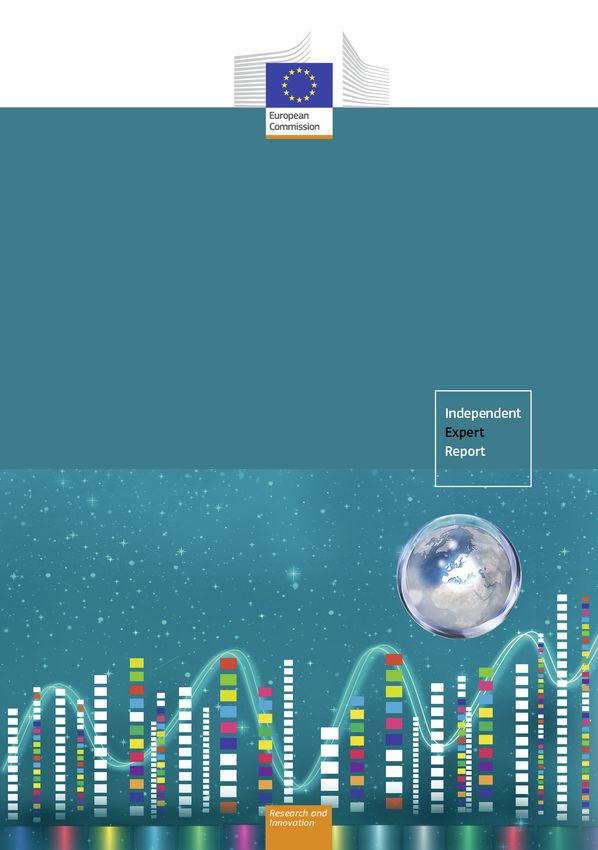
screening at banks – concretely, their tasks can be divided into four (see also
Figure 3):
• Fundraising: As a first step, a new fund needs to find investors, also
known as limited partners (LPs). Due to the risk nature of equity
investments, the reputation and past performance of fund managers are
very important. For newly established funds (involved in less than 2-3
funding rounds), this is naturally difficult, but here public funds can play
a crucial role – it can work as a kind of blue stamp for private investors.
• Screening and investing: Over the following 2-4 years, the fund
managers search through a large number of companies to identify
investment cases. It goes without saying that picking the right start-
ups, i.e. those with the best teams and ideas, is crucial to the success of
the fund.
• Active ownership: Equity funds carry out active ownership in the
companies they invest in (so-called portfolio companies), using their
highly specialised knowledge, network and syndication with other funds
to increase the chance of success.
• Exit and realising value: When the company has matured, the fund
will start looking for potential buyers in other types of equity markets.
The realised potential and experience are often canalised into new start-
ups.
15Figure 3
Four tasks of VC and PE funds
Source: Copenhagen Economics (2019c), Economic footprint of Swedish venture capital
Of these four tasks, the active ownership is a distinct feature as it does not
relate to actual fundraising but is important for understanding the possibilities
of a fund’s success.
The VC and PE funds are managed by so-called General Partners (GPs), who
represent the interest of investors in the funds (the LPs). GPs are remunerated
based on the performance and have together with the LPs a strong incentive to
boost the value of the portfolio companies. This structure shapes the
functioning of the equity markets and the funds have a strong role in shaping
and scaling up the companies they invest in.
For VC in particular, the portfolio companies are often strong content experts in
their field but lack more general knowledge of creating a commercial success.
Therefore, the funds usually staff previous entrepreneurs or management
consultants that know what it takes to transform a good idea into a commercial
success.
Concretely, we have through interviews identified the following aspects where
VC and growth PE funds typically help their portfolio companies 18:
• Finding the right strategy from the start, e.g. that the scientific strategy
matches a sound financial plan.
• Minimising product risks and bringing the product to market, e.g. by
providing access to global markets.
• Networking and bringing in the right talent, e.g. support in setting the
right board consisting of CEO etc.
• Getting access to other sources of finance.
18
Based on interviews for a previous study on VC, see Copenhagen Economics (2019c),
Economic footprint of Swedish venture capital.
16• Helping with standard start-up compliance.
• Choosing the best exit strategy and executing it, e.g. mergers and
acquisitions, initial public offering (IPO) or private equity.
As mentioned, buyout PE somewhat distinguishes from the VC and growth PE as
the required tasks are a bit different, e.g. change of management or executing
a turnaround.
Equity funds are part of broader eco-system
The strong emphasis on active ownership also means that equity funds are an
integrated part of the innovative business eco-system around scale-up
companies. As mentioned, they often hire previous successful entrepreneurs
and sector experts with in-depth knowledge. As such, the eco-system is self-
enforcing; successful start-ups can spur GPs to raise funds to invest in new
start-ups and staff within the start-up can create new spin-off projects. Also,
returns from successfully exited start-ups are often re-invested in new projects,
either as business angels or LPs in a VC fund.
Therefore, creating a successful equity market is not just a matter of enough
cash – it is required to stimulate an entire eco-system of knowledge-intensive
SMEs on the edge of the technology frontier.
1.3 Impact of risk capital
The potential immense societal value of well-functioning risk capital markets is
well-established within economic research:
• An increase of VC of 1 EUR results in an increase in output growth of
3.33 EUR as a result of economic spill-overs, based on an analysis of 16
OECD countries. 19
• Social return (impact on the entire economy) of R&D investments is
about three times higher than the private return. 20
• One dollar of VC invested at the level of the equity fund (“industry
level”) is associated with around three times more patents than one
dollar of corporate R&D. 21
• 8 per cent of the innovation by American companies in the period 1983-
1992 is a result of VC investments. 22
• Empirical research showing that VC-backed companies grow
considerably more and faster than their non-VC backed counterparts. 23
19
Romain and van Pottelsberghe (2004), The economic impact of Venture Capital.
20
Colino (2016), Cumulative Innovation and Dynamic R&D spill-overs.
21
Schnitzer and Watzinger (2017), Measuring the Spill-overs of Venture Capital.
22
Kortum and Lerner (2000), Assessing the Contribution of Venture Capital to Innovation.
17Looking at the American market, which is the most developed equity market in
the world, also clearly illustrates the value of a well-functioning VC eco-system;
while VC funds merely invested in around 0.20 per cent of start-ups in the US
between 1979 and 2013 – these 0.20 per cent made up 43 per cent of
American public listed companies founded in this period, cf. Figure 4.
Figure 4
VC is important for the creation of valuable companies
Share of American start-ups (left) and share of American public listed companies (right), 1979-2013
Source: OECD (2018a), A portrait of innovative start-ups across countries
In addition, the world’s four most valuable companies in 2018 are VC-backed,
cf. Figure 5.
23
Except for those companies with the highest probability of defaulting anyways, see EIF,
The VC Factor: Data-driven insights about VC-backed start-ups in Europe.
18Figure 4
The world’s most valuable companies
Measured by market cap in October 2018
Source: Invest Europe and National Account
192 EQUITY GAPS IN EUROPE
Having laid out how the equity markets for SMEs are working in chapter 1, we
now turn our attention to a data-driven analysis of the functioning of the EU
equity markets.
Following our analysis of the role of equity finance in chapter 1, we define an
equity gap as the lack of a well-functioning risk capital eco-system to support
innovative SMEs with high scale-up potential.
There is hardly any single metric capturing all aspects of such an equity gap.
One typical proposed measure is the difference between demand for risk capital
and actual risk capital investments. 24 However, as we will demonstrate in
section 2.2.5 (and in Appendix), a low level of risk capital available for
investments is often correlated with weak demand by companies – leading to
the counterintuitive result that countries with very absent risk capital markets
almost have no equity gap. Therefore, we see this as a flawed metric of an
equity gap.
Thus, in this chapter, we analyse the equity gap from a series of dimensions
using several methodologies to cover the wider context of potential gaps on the
EU equity markets. From an economic point of view, it is difficult to define the
“correct” level of ambition. For example, we will in an intra-EU benchmarking
exercise compare each country to the EU27 (hereafter referred to as “EU”
unless otherwise stated) average. But this is not to say that the EU average is
the correct level of ambition given the fact that this average is still significantly
below the US counterpart. Yet, even in the US, economic research indicates
that the level of risk capital investments is significantly below the social optimal
(as outlined in section 3.1).
The chapter is structured as follows. First, we will set the scene by providing a
high-level benchmarking of Europe average against the US, which has the most
developed equity markets in the world (section 2.1). Then, we will conduct a
thorough intra-EU benchmarking of the entire value chain of the equity
markets, revealing in which countries, in which stage and in which part of the
value chain, there seem to be equity gaps (section 2.2). We then take a sector
focus analysing which sectors are likely to be most affected by the identified
gaps (section 2.3). Finally, we provide an overview of the drivers behind the
identified gaps (section 2.4).
2.1 Benchmarking to the US
In terms of private equity (VC and PE) markets, the US arguably has the most
developed equity market in the world, which is around three times the absolute
size of the EU counterpart in 2017, when measured as equity issuance for non-
financial corporates. 25 On average, the per centage difference has remained
24
See for example ECB (2019), Survey on the Access to Finance of Enterprises in the euro
area.
25
AFME (2018), Capital Markets Union: Measuring progress and planning for success.
20steady over the past ten years, with Europe facing difficulties in catching up
with the US, cf. Figure 6.
Figure 5
Equity investments in portfolio companies
Share of GDP
Note: Equity investments consist of business angels and VC and PE investments, and market issuance (IPO
and secondary offerings). Statistics for market issuance in Europe cover EU27 only; Business angel
investments count from 2008 onwards; PitchBook data as of 12/12/2019.
Source: EBAN Statistics Compendium, European Early Stage Market Statistics; Jeffrey Sohl, Center for
Venture Research; PitchBook; AFME (2018), Capital Markets Union: Measuring progress and planning for
success; World Bank
Taking a more disaggregated view reveals differences within the different
stages:
• Large-cap: In market issuance of equity (both IPOs and secondary
offerings), the European market is around 2/3 of the US (adjusted for
GDP), cf. Figure 7. A study by Ernst & Young finds that the American
IPO market viewed in isolation is more than twice the absolute size of
the respective market in Europe in 2019. 26 For buyout PE, we find that
the gap to the US is a bit smaller.
• Business angel and VC segment: Here, the gap is considerably
larger, with the US being some four times larger than the European. 27
26
EY (2019), Global IPO trends: Q4 2019.
27
If we had instead relied on OCED data that uses PitchBook for the US (like us) but Invest
Europe for Europe, the VC market in the US would be some 12 times bigger than the
European market.
21Figure 6
Investments in portfolio companies by stage
Share of GDP, average of last four years (2014-2017)
Note: Market issuance refers to IPO and secondary offerings; PitchBook data as of 12/12/2019.
Source: EBAN Statistics Compendium, European Early Stage Market Statistics; Jeffrey Sohl, Center for
Venture Research; Invest Europe; PitchBook; PwC/CB Insights MoneyTreeTM Report; AFME (2018), Capital
Markets Union: Measuring progress and planning for success; World Bank
For the large well-established corporates, we do not expect big differences in
the access to equity markets. The listed equity markets are more comparable,
and we primarily expect the differences to occur for companies ready for an
IPO; once listed, the barriers of issuing new equity decrease. In this way, the
difference to the US for large well-established corporates is to some extent a
matter of preferred capital structure. This should be seen in the light of a
different industry composition in the US, with a larger share of the economy
within tech (e.g. Facebook, Apple, Google, Amazon, Microsoft), which in general
makes use of more equity finance.
The VC segment with a four-fold gap to the US market appears on the face of it
more alarming and could indicate a lack of equity funding for innovate SMEs
with ambitions of scaling up. However, again different industry compositions
could have a role as well as simply the number of start-ups of sufficient quality
and type to be eligible for VC. Recall from chapter 1 that it is a very distinct
kind of SMEs for which VC is relevant. As such, the causality can go both ways
– small and ill-functioning equity markets can lead to a lack of innovative start-
ups – but lack of innovative start-ups and a well-functioning eco-system to
support start-ups may also lead to low demand for risk capital. We will discuss
this further in section 2.3.
It should be noted that the choice of source can significantly influence the size
of the equity gap. For comparability, we have used data provided by PitchBook
as the main data source for both Europe and the US for seed/start-up VC, late-
stage VC, growth PE and buyout PE. Moreover, it should be kept in mind that
the UK is covered in most of the European statistics, implying that the gap
would be even larger by benchmarking the US to the EU countries only.
22In the following two sections, 2.2 and 2.3, we will conduct a thorough intra-EU
benchmarking through the value chain of VC and PE, across countries and
sectors.
2.2 Intra-EU benchmarking of equity markets
We now turn our attention to a benchmark analysis for Horizon 2020 associated
countries 28 to the extent that data allows, the UK and intra-EU countries in
terms of a series of parameters.
In the benchmarking of intra-EU countries, the country-specific equity markets
are measured against the EU average to identify the countries that are lagging
behind. This does not entail that the EU average is the optimal level of equity
investments. For example, the EU average is far behind frontrunners such as
the US and Israel, and many countries do have ambitious plans involving a
wider view than just catching up to an average. Thus, the benchmarking
analysis simply sheds light on where there seems to be unexploited potential,
with the best performing intra- and extra-EU countries setting the direction to
pursue.
Specifically, in the following sections, we examine each of the three parts in the
risk capital value chain illustrated in Figure 8, while deep diving into the stages
of equity funds and companies receiving capital (portfolio companies).
Figure 7
Risk capital eco-system
Source:Copenhagen Economics
28
The list of Horizon 2020 associated countries is available at
https://ec.europa.eu/research/participants/data/ref/h2020/grants_manual/hi/3cpart/h202
0-hi-list-ac_en.pdf.
232.2.1 Description of data sources
In this benchmarking exercise, we will rely on Invest Europe as our primary
data source for fundraising and investment activity in Europe. 29 The data
provided by Invest Europe are survey based, in this way collecting information
on the activity of European equity funds on an annual basis. 30
The funds included in the Invest Europe statistics are equity funds making
direct investments, mezzanine funds, co-investment funds and
rescue/turnaround funds. 31 However, not necessarily all transactions on the
equity market that involve these types of funds are registered. In particular,
caution should be taken for countries with less activity/smaller markets, such as
Denmark for which Invest Europe captures around 60-80 per cent of the
activity. 32 Consequently, the figures throughout our report must – as a general
rule – be interpreted as the level of activity that has been taking place as a
minimum. As such, the dataset does not necessarily provide the exact levels of
activity on the equity markets.
In the sectoral analyses, we also supplement the Invest Europe data with that
provided by PitchBook to shed light on VC and PE investment activity within the
deep tech and fintech sectors, as the sector scope of Invest Europe does not
cover this granularity. 33
29
Invest Europe produces significantly lower levels of investments compared to the private
capital market data provider PitchBook, whereas the differences are less pronounced for
registered fundraising across these sources. We have preferred to base our analysis on
Invest Europe to the extent possible as this is recognised in the industry as being one of
the most reliable sources. Also, the relative ranking of countries can differ between
different sources, which is why we make an effort to construct our cross-country
comparisons based on one main data source only, e.g. either Invest Europe or PitchBook.
30
For fundraising statistics at country level, we report industry statistics, meaning that
fundraising is recorded in the country of the advisory team raising/managing the fund. For
country-specific investment activity, the figures presented are market statistics. That is,
the investment statistics are reported according to the location of the portfolio company
(‘market statistics’) rather than the country of the equity fund’s office in charge of the
investment (‘industry statistics’).
31
Activities from the following funds are completely excluded from the statistics:
infrastructure funds, real estate funds, private debt funds, distressed debt funds, primary
funds of funds and secondary funds-of-funds. See Invest Europe (2018), European Private
Equity Activity.
32
Vækstfonden (2016), The Danish market for buyout capital
33
Like for Invest Europe, the Pitchbook statistics should in general not be considered as
exact totals because the dataset may not include all transactions, and, again, extra
caution must be taken for those countries with smaller equity markets. More specifically,
just because our sources do not have much data for a particular country, it does not
necessarily mean that more fundraising or investment activity has not happened there.
The approximated figures are thus minimum levels representing a lower bound of the
activity that in fact has been taken place in the equity markets.
24The benchmark figures include data on fundraising and investment activity for
the following Horizon 2020 associated countries; Israel 34, Norway, Serbia,
Switzerland and Ukraine. For the remaining countries that are associated to
Horizon 2020, we have also received data from Invest Europe and/or PitchBook.
35
However, for these countries, Invest Europe and PitchBook have simply
tracked no or, if any, very little activity meeting their methodology.
2.2.2 Benchmarking of investors within the EU
First, we examine the investors of equity funds (or Limited Partners, LPs).
Figure 8
Risk capital eco-system
Source: Copenhagen Economics
A geographical breakdown of European investors shows France & Benelux as
the most active investors, cf. Figure 10. Especially in terms of VC, the French &
Benelux investors are at the forefront with, e.g., two times more funds raised
than the UK & Ireland. The Nordics (Denmark, Finland, Norway, Sweden and
Iceland) also have active investors but primarily in the PE segment, whereas
CEE (Central and Eastern Europe), Southern European countries and DACH
(Germany, Austria, Switzerland and Lichtenstein) have less active and/or fewer
investors.
34
It should be noted that data on Israel are provided by PitchBook as market statistics on
investment activity are not captured for Israel in the Invest Europe dataset. To make
statistics more comparable, we have scaled the PitchBook figures based on the observable
difference for Europe overall across sources.
35
This involves the following countries: Iceland, Albania, Bosnia and Herzegovina, North
Macedonia, Montenegro, Turkey, Moldova, Faroe Islands, Tunisia, Georgia, Armenia.
25Figure 9
Geographical breakdown of sources of funds in European funds
Share of total GDP in each region, average of last four years net of inflation (2015-2018)
Note: The figures are funds raised in terms of incremental amounts raised during the year and not final
closings in the year (cumulative amount raised since inception). PE is the residual between all private equity
funds and venture funds.
CEE comprises the countries of Bulgaria, Croatia, Czech Republic, Estonia, Hungary, Latvia, Lithuania,
Poland, Romania, Serbia, Slovakia, Slovenia and Ukraine; Southern Europe includes Andorra, Cyprus,
Greece, Italy, Malta, Portugal and Spain; DACH is composed of the countries Germany, Austria, Switzerland
and Liechtenstein; Nordics refer to Denmark, Finland, Norway, Sweden and Iceland; France & Benelux
consists of France, Belgium, Netherlands, Luxembourg and Monaco.
Source: Invest Europe and Eurostat
In absolute numbers, North America accounts for the largest inflow of some
EUR 19 billion into Europe each year. In addition, investors from Asia &
Australia are active in Europe, although almost exclusively in the PE segment,
cf. Figure 11.
Figure 10
Geographical breakdown of sources of funds in European funds
EUR billion, average of last four years net of inflation (2015-2018)
Note: The figures are funds raised in terms of incremental amounts raised during the year and not final
closings in the year (cumulative amount raised since inception). PE is the residual between all private equity
funds and venture funds; North America consists of Canada and the US.
Source: Invest Europe
26Turning to the investor type, we find that institutional investors (pension funds
and insurance companies) are the most predominant in European equity
markets. However, they primarily focus on buyout PE and to some extent
growth PE, cf. Figure 12.
For the VC segment, institutional investors are quite absent, where public 36
money make up the largest share of the classified fundraising. Institutional
investors only make up some 9 per cent of the total VC funds. The lack of
institutional investors is a problem raised several times, among others by fund
managers in a survey carried out by the EIF 37, and points towards a big
potential to increase fundraising by engaging institutional investors in the VC
investment class. For example, a report on the Nordic VC markets shows that
merely 0.10 per cent of institutional investor assets are invested in VC. 38 To
illustrate the potential hypothetically; if this share was increased to 0.50 per
cent, it could increase VC fundraising in Europe by 60 per cent.
One of the key obstacles to increasing institutional investors’ participation in the
VC asset class is the lack of scale associated with European VC opportunities as
well as the lack of a dedicated allocation to the VC asset class on the part of the
institutional investors. 39 Yet, with the tendency of a growing European VC eco-
system and the potential of high returns, the VC market in Europe may prove to
become attractive for institutional investors. Given the long-term investment
horizon that VC investments present, together with the possibility of gaining
exposures in emerging sectors and establishing a well-diversified VC portfolio,
the VC market would suit well the investment profile of long-term financial
investors (primarily pension funds, insurance companies and asset managers).
36
Public refers to academic institutions and government agencies.
37
EIF (2018c), VC Survey: Fund managers’ market sentiment and views on public
intervention.
38
Copenhagen Economics (2019c), Economic footprint of Swedish venture capital.
39
Axon (2019), Participation of Institutional Investors in European Venture Capital.
27Figure 11
Sources of European funds by investor type
Share of total investments, average of last four years net of inflation (2015-2018)
Note: The figures are funds raised in terms of incremental amounts raised during the year and not final
closings in the year (cumulative amount raised since inception).
Source: Invest Europe
In this context, note that the EIF has recently made an effort to mitigate the
issue of lack of institutional investors’ engagement in risk capital markets; in
2017, they launched an Asset Management Umbrella Fund (AMUF) with the aim
to increase the amount of risk capital available for investment activity in
Europe, whilst maximising investments from institutional sources. 40
2.2.3 Benchmarking of VC and PE funds within EU
In this section, we turn our attention to the funds, which invest the equity
raised into companies.
Figure 12
Risk capital eco-system
Source: Copenhagen Economics
In absolute values, the size of all British VC and PE funds is by far the largest
with some EUR 40 billion raised each year – this is more than the total funds
raised in the entire EU, amounting to EUR 30 billion. France is the second
largest with total fundraising of EUR 10 billion. As a share of GDP, British funds
40
EIF (2018f), ENPACL commits to new EUR 2 billion EIF Asset Management Umbrella Fund
for European SMEs.
28are also sizeable, only succeeded by Luxembourg. In the case of Luxembourg
and United Kingdom, the reason is that they are often the preferred jurisdiction
for funds with an international LP base or those LPs where the regulatory
framework in their home countries is not deemed optimal.
Also, Sweden, France and Netherlands have large equity markets measured in
terms of fundraising. These countries have a strong pull upwards on the EU
average of 0.24 per cent (adjusted for GDP) and the EU median of around 0.10
per cent.
The other end of the scale is mainly dominated by countries from Eastern and
Southern Europe. However, Germany, Austria and Ireland break the pattern, all
ranking below the median and being some 0.15-0.20 per centage point short of
the EU average, cf. Figure 14.
These large regional differences in funds raised across the European countries
are in particular driven by buyouts, especially being pronounced for Sweden. As
we will demonstrate below, the regional differences are less pronounced when
looking only at risk capital (VC and growth PE).
29You can also read