Positively green: Measuring climate change risks to financial stability - June 2020
←
→
Page content transcription
If your browser does not render page correctly, please read the page content below
Positively green:
Measuring climate change
risks to financial stability
June 2020
Contents

Introduction                                                                                 2

1       What are the shocks? Reviewing climate risks relevant for financial (in)stability    6

2       Are financial markets pricing such shocks or building capacity to do so in the future?14

3       What can currently available disclosures tell us about the exposures of banks and
        insurers to climate-related risk?                                                   23

4       What can we learn from forward-looking scenario analysis based on existing
        information and methods?                                                            33

5       Conclusions, open issues and proposed way forward                                   45

References                                                                                  47

Imprint and acknowledgements                                                                54

Positively green: measuring climate change risks to financial stability / June 2020
Contents
                                                                                             1
Introduction

Positive measurement of the impacts of climate change is needed to underpin an increasingly
heated normative debate. In the sphere of financial stability, there is currently a dearth of
sufficiently encompassing and reliable information on risks resulting from climate change. This
report evaluates how this information gap can be filled for European Union (EU) Member States,
leveraging existing data and methodologies. In particular, the report draws insights from granular
supervisory datasets based on available carbon emissions reporting and makes use of existing
economic and financial models to gauge potential near-term risks. While climate change reporting
by banks and firms alike remains patchy, available datasets and methodologies nonetheless
already shed considerable light on financial stability risk exposures. In this context, this report
tackles four questions: (i) what magnitude of climate-related shocks can be expected?, (ii) are
financial markets pricing the prospect of such shocks (or building capacity to do so in the future)?,
(iii) what are the exposures of banks and insurers (based on available disclosures) to potential
repricing of climate-related risk?, and (iv) what can we learn from forward-looking scenario analysis
to determine where further investment is needed? The main findings are as follows:

1.    What magnitude of climate-related shocks can be expected from climate change?
      Climate shocks appear inevitable. That said, the nature and severity of associated disruptions
      to the economy and financial markets depend on the timing and stringency of mitigating
      actions. The costs associated with climate change – even in the nearer term – appear
      inevitable either in the form of direct physical impacts of climate-related shocks, or transition
      costs associated with mitigation and adaptation. On the one hand, available estimates
      suggest that physical damage from climate change could reach one-tenth, or even one-fifth, of
      global GDP by the end of this century, with considerable uncertainties around amplifying
      dynamics. In terms of current global output, this would amount to USD 8-17 trillion. Clearly,
      constructing a long-dated, forward-looking path of climate change impacts involves quite a
      large degree of uncertainty. Long-dated predictions are not, however, needed to obtain a
      sense of the growing costs associated with physical risks. The economic costs of climate
      change events have already been growing steadily in recent years for insurers in the EU,
      which are already facing the highest-ever levels of weather-related costs. These losses
      represent over 80% of catastrophe-related losses (mainly resulting from meteorological and
      hydrological events). Weather-related losses in the EU amounted to €537 billion between
      1980 and 2018, and only 35% of these were insured, leaving a large insurance protection gap.
      While the related loss magnitudes are still manageable, a continuation (or exacerbation) of
      this upward trend could place greater collective strain on (re-)insurers. On the other hand,
      available estimates suggest the transition to a low-carbon economy will require investment of
      between USD 1 trillion and USD 4 trillion in constant terms when considering the energy
      sector alone, or up to USD 20 trillion when looking at the economy more broadly. While such
      investments entail upfront costs, they may also embed many positive benefits associated with
      the employment or output multipliers of such investments, as well as productivity gains
      associated with new technologies. Moreover, the timing of intervention matters. Early action
      can avoid a situation in which physical and transition risks interact in a malign self-reinforcing
      way, whereby delayed mitigating action may yield physical disruptions, prompting abrupt
      additional tightening to keep temperature rises in check.

Positively green: measuring climate change risks to financial stability / June 2020
Introduction
                                                                                                           2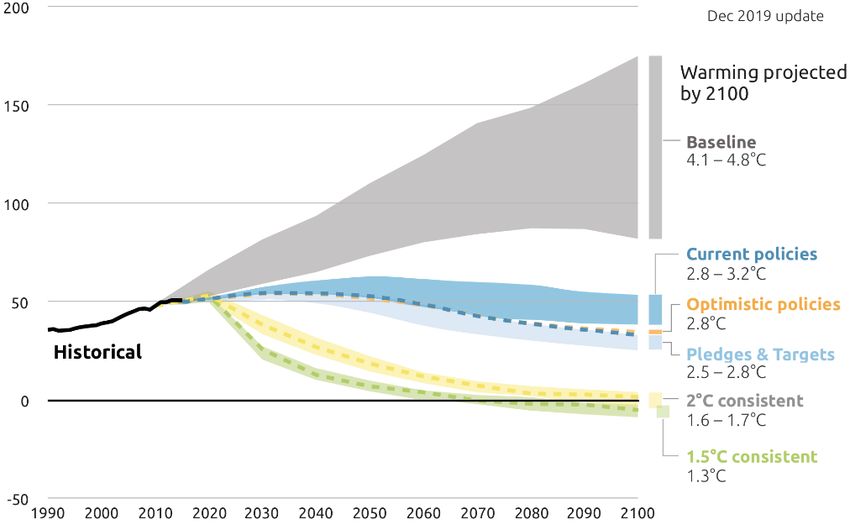
2.    Are financial markets pricing the prospect of such shocks or building capacity to do so
      in the future? Climate risk does not appear to be fully reflected in asset prices so far.
      Capacity is building rapidly, but from a limited starting point. One factor inhibiting a more
      meaningful response is that financial markets appear to suffer from informational inefficiencies
      that compound any climate-related capital misallocations. A lack of carbon pricing that
      adequately captures climate-related externalities means that financial markets – while
      seemingly willing to price climate-related risk – are unable to fully reflect this risk in prices
      owing to disclosures that are incomplete (selection bias in firm reporting), inconsistent (lack of
      accepted methodology for defining green and brown assets) and insufficient (virtually no
      reporting on downstream emission intensity of products of portfolios). Against this
      background, the performance of greener firms does not seem to outperform that of other
      firms. Even if there is limited pricing differential, values-based or green investments might
      nonetheless be less subject to volatility or sharp price drops. Most importantly, trends in past
      performance cannot be seen as representative of developments going forward. Green bond
      markets – while remaining small at only 5% of the global bond market – are expanding rapidly
      and becoming increasingly liquid. Firms and governments alike are announcing plans for
      greater green bond issuance, while asset managers and credit rating agencies are working
      towards an expansion of the environmental social and corporate governance (ESG) asset
      universe more generally, suggesting that capacity is building rapidly, particularly for asset
      classes such as equities offering excess returns from climate-related opportunities. But, until
      capacity is reached, demand for green assets may well outstrip supply, thereby creating
      scope for market overshooting and possible pricing dislocations.

3.    How large are the exposures of banks and insurers (based on available disclosures) to
      potential repricing of climate-related risk? Exposures of euro area banks to high-emitting
      firms appear limited on average, but are concentrated in a few large exposures for some
      banks. Transition risk mitigation appears to be gradually taking place, with a decline of nearly
      20% in the CO2 intensity of exposures over the past three years as captured by available
      data, and is concentrated in exposures to firms with high-intensity climate emissions. This
      decline, however, follows expanding exposures over a long time frame, which is captured by
      syndicated loans having higher levels of exposure to carbon emissions over the last decade.
      Concentration remains an issue – a few banks hold the bulk of exposures to the most energy-
      intensive borrowers, whereby the CO2 emissions of the 20 most polluting firms amount to half
      of euro area banks’ exposures to emitting firms captured by currently available granular
      datasets. A simulation analysis measuring the impacts of a credit rating downgrade of one
      notch for banks’ exposures to the highest polluting firms within economic sectors suggests
      credit losses that could reach up to 10% of total assets. As for exposures to physical risk,
      more data, notably geospatial data, are needed to properly assess the parts of the EU
      economy subject to climate-related impacts.

4.    What can we learn from forward-looking scenario analysis and where is further
      investment needed? Exploratory scenario analysis, involving the re-tooling of existing macro
      stress test models, focuses on the short-run impacts of transition risk emanating from either a
      sharp policy tightening or strong technological adjustments. This analysis, initially constructed
      with the maximum horizon suitable for associated off-the-shelf dynamic models (five years),
      suggests that transition costs in the form of both economic output and bank capital would be

Positively green: measuring climate change risks to financial stability / June 2020
Introduction
                                                                                                          3
manageable and temporary for banks and insurers. Transitory GDP losses reach a trough of
2.5% for banks and insurers, concentrated in the sectors most exposed to financial repricing
risks. But even in a scenario of sharp carbon policy tightening, negative impacts on aggregate
GDP appear limited. However, technology-related shocks, in the form of an increased share of
renewable energy across sectors, would lead to GDP-neutral or enhancing effects after
frictions associated with sectoral reallocations have dissipated. In reality, such transition
shocks are likely to interact. And, indeed, with bank capital losses limited to a range between
0% and -0.8%, the magnitude of these shocks on the economy and banks alike pales in
significance compared with stress tests to more standard recessionary economic and financial
scenarios, where output losses can easily be four times higher (and permanent). Moreover,
these transitory losses are paltry compared with the potential economic losses associated with
the manifestation of potentially broad geographical and sectoral physical risk over the medium
term, particularly if systemic amplifications are taken into account. This suggests that early
action to tackle climate risk, including adaptation and mitigation measures should have net
benefits.
Notwithstanding the foundations that this report provides for better understanding financial stability
risks from climate change, further work is needed for more accurate and encompassing
measurement of the risks to financial stability. First and foremost, data gaps constrain a fully
representative analysis. On the one hand, disclosures remain incomplete, inconsistent and
insufficient. Incompleteness relates to the voluntary nature of current disclosures, meaning that firm
disclosures of climate metrics remain partial and incomplete amid likely selection bias, and
therefore not representative of the broader industrial sample of polluting firms. Inconsistency relates
to the potential for so-called “greenwashing”, with an inadequate accreditation for green labelled
products absent a widely accepted benchmark taxonomy. Insufficiency relates mainly to the
downstream emission intensity of the products of portfolios, which are rarely reported in a
consistent manner. On the other hand, the disclosures of financial institutions – notably banks – fail
to encompass the climate risk inherent in their asset portfolios. Newly available credit register
information might help to fill gaps. Beyond data deficiencies, efforts need to be made to
meaningfully expand currently available financial modelling for the purpose of climate analysis. In
order to better capture physical risk, geolocational data are needed to evaluate susceptibility to
physical risk – both acute (e.g. extreme events) and chronic (e.g. rising sea levels). The
frameworks that are currently adept at analysing the links between economic and financial
interactions need to better incorporate links to environmental science to allow for a full cost-benefit
analysis to inform timely and tailored policy action. Such advances are crucial for underpinning
evidence-based policy reflections associated with climate change adaptation and mitigation.
More generally, the ongoing health pandemic has brought the prospect of large shocks to our
collective attention. The scale and nature of the transmission channels through which this arguably
foreseeable – but not specifically predictable – shock has affected the global economy has been
illustrative. It has laid bare a need for timely information as the shock evolves, leading to large
financial market swings in sentiment as financial markets revisit both expected cashflows and
returns of companies in a “new normal” equilibrium. It has involved a series of local policy actions
aimed at addressing the shared public health challenges experienced around the globe. On the
economic and financial side, this global challenge has created both risks and opportunities in line
with the ability of economic sectors, firms and governments alike to cope with the shock. There are
Positively green: measuring climate change risks to financial stability / June 2020
Introduction
41
numerous economic and financial parallels to the risks posed by climate change. Most importantly,
global climate change may also be foreseeable, but involves many uncertainties, and a need for
accurate information to underpin allocative decisions. As a corollary, both risks and opportunities
also follow from the capacity of economies, financial markets and financial intermediaries to
collectively weather climate-related shocks.
The remainder of this report is structured as follows. Section 1 outlines evidence on the costs of
climate change. Section 2 provides an overview of financial markets – from pricing of climate risk to
market developments. Section 3 outlines financial sector exposures. Section 4 contains details of
forward-looking scenario analysis and the foundations of an exploratory pilot risk assessment
framework. Section 5 concludes and sets out avenues for further work.
1
As argued by Normand (2020), both pandemics and climate-related catastrophes are global and existential threats that are
sometimes neglected by policymakers and ignored by investors because they seem intangible or remote until they actually
strike. Indeed, Alok et al (2020) find evidence of a “salience bias” that decreases over time and distance from disasters.
Positively green: measuring climate change risks to financial stability / June 2020
Introduction
51 What are the shocks? Reviewing climate
risks relevant for financial (in)stability
There has been a striking rise in temperatures over the last decade as the level of CO2 in the
atmosphere has skyrocketed. Global temperatures have been far higher in the past decade
compared with their 100-year average, in tandem with an unprecedented rise in CO2 in the
atmosphere (see Figures 1a and b).
Figure 1a
Changing trends: Global mean temperatures, 1850-2018
(deviation of temperature from annual average temperatures between 1901 and 2000; +/- 2.6 standard deviations)
Source: ShowYourStripes.info based on data from UK Met Office.
Note: The average temperature is set as the boundary between blue and red colours, and the colour scale varies by +/-
2.6 standard deviations from the annual average temperatures between 1901-2000.
Figure 1b
Changing trends: Current CO2 concentration in the atmosphere
(CO2 in parts per million by volume; thousands of years)
Source: National Oceanic and Atmospheric Administration.
Positively green: measuring climate change risks to financial stability / June 2020
What are the shocks? Reviewing climate risks relevant for financial (in)stability
6At the same time, scientific advances that allow long-dated horizons suggest that irrevocable
2
temperature increases have already been locked in (see Figure 2a). At least four different global
warming pathways can be considered, with most yielding a warming outcome of 2°C or more above
3
pre-industrial levels by 2100. The first is a baseline scenario with a complete absence of mitigation
policies, which according to the IPCC would imply global warming of 4.1-4.8°C. A second pathway
represents existing policies that only reduce baseline warming to 3.2°C. A third pathway considers
optimistic policies that are planned, but not yet implemented, resulting in a median global warming
path of 2.8°C. A fourth pathway considers additional policies to meet pledges and targets, which
results in a level of global warming that is still above the 2°C “tipping point.” All four pathways
suggest that current policies are incompatible with the pathway that limits global warming to 1.5°C
in line with the Paris Agreement. Moving to such a pathway requires implementation of a sharp
policy tightening not decades in the future, but in the next few years. All of the scenarios have
system-wide impacts on financial stability in the form of either physical or transition risks in the
coming decades. Perhaps the most damaging scenario is one of a double hit to economic output as
a result of physical risk manifesting itself at the same time as a belated, but sharp, policy tightening
(see Gros et al., 2016).
Figure 2a
Climate risk scenarios: Projections of carbon emissions and global warming
(emissions of CO2 in gigatonnes per year)
Physical risks
Transition risks
Sources: Climate Action Tracker, Warming Projections Global Update.
Note: December 2019 projections.
2
See Gillingham and Stock (2018).
3
There is some debate over the impact of bypassing this 2°C global warming threshold, whereby many suggest that non-
linear dynamics set in and cause increased climate-related disasters. See Jaeger and Jaeger (2011) for a discussion of
several views on the appropriateness of the 2°C target.
Positively green: measuring climate change risks to financial stability / June 2020
What are the shocks? Reviewing climate risks relevant for financial (in)stability
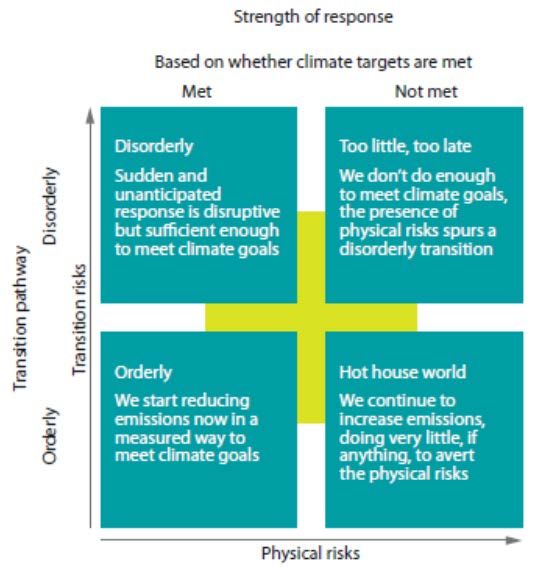
7Figure 2b
Climate risk scenarios: Strength of response
Source: NGFS Comprehensive Report, 2019, p. 21.
There are two main channels through which climate change can affect macroeconomic conditions
and financial stability (NGFS, 2019a). On the one hand, there is the possibility of physical risk, or
actual changes, in climate-related events. Such events can be both acute (sudden) and chronic
(more gradual, but equally voracious – such as changes in precipitation, extreme weather
variability, ocean acidification and rising sea levels. A shift in the climate can have both an
economic impact and an impact on financial stability through a number of supply and demand
channels. Physical risks have already been playing a growing role in eroding the collateral and
asset values of insurers. Insurance liabilities are particularly exposed to the frequency and severity
of climate and weather-related events that damage property or disrupt trade (Gassebner et al.,
2010; Albouy et al., 2013; Bunten and Kahn, 2014). The share of weather-related catastrophe
losses has increased steadily to account for over 80% of insured catastrophe losses in 2018, while
the frequency of weather-related loss events hit a record in 2018 (Swiss Re Institute, 2018). On the
demand side, extreme climate events could reduce household wealth and therefore private
consumption (Hallegatte, 2009). Business investment could also be dampened by uncertainty
about future demand and growth prospects and substantial price impacts (Parker, 2018). On the
supply side, natural disasters can disrupt business activity and trade, and destroy infrastructure,
diverting capital from technology and innovation to reconstruction and replacement (Batten, 2018).
Climate change can also trigger migration on a grand scale, cause potential social conflict and have
an impact on labour market dynamics (Opitz Stapleton et al., 2017). As has proven to be the case
in the past, these macroeconomic and financial shocks can further interact and amplify each other
Positively green: measuring climate change risks to financial stability / June 2020
What are the shocks? Reviewing climate risks relevant for financial (in)stability
8(Schwartz, 1995; Bordo et al., 2001). An example of this is the possibility of natural disasters
causing a reduction in the collateral values of housing stock and weakening households’ balance
sheets, in turn reducing household consumption (NGFS, 2019b). For Europe in particular, Ciscar et
al (2018) detail potential climate impacts in two different scenarios (a high level of warming
scenario and a 2°C scenario) in the JRC Project PESETA. The JRC report lists 11 categories of
climate change that could all be relevant in the EU, namely coastal floods, river floods, droughts,
agriculture, energy, transport, water resources, habitat loss, forest fires, labour productivity and
mortality due to heat.
On the other hand, transition risk can arise as a result of the shift to a low-carbon economy (such
as changes in public regulation, technology or in households’ or investors’ preferences) triggering
changes in demand-related factors. This adjustment process is likely to have a significant impact on
the economy and, in particular, on some financial asset values. The potential risks to the financial
system from the transition are greatest in scenarios in which the redirection of capital and policy
measures – such as the introduction of a carbon tax – occur in an unexpected or otherwise
disorderly way (NGFS, 2019b). A sharp adjustment with a view to lowering emission pathways
might mean that large shares of fossil fuel reserves can no longer be extracted, thus becoming
stranded (McGlade and Elkins, 2015). Other fossil fuel-dependent sectors will probably be
impacted indirectly as a consequence (Cahen-Fourot et al., 2019). The size of the impact depends
on the assumptions made about when and how the transition happens, and which sectors it affects.
The risk is that a sharp reassessment of climate change risks could lead to a financial market
reassessment, leading to a spiral of persistent tightening of financial conditions as losses ensue
(Bolton et al., 2020).
Physical and transition risks are not likely to be independent of one another (see Figure 2b). As
highlighted by the NGFS scenario matrix (see NGFS, 2020), the lack of sufficiently forceful policy
measures aggravates physical risks, while excessive or misplaced climate policies may intensify
transition risks (Vermeulen et al., 2018). While an “orderly” scenario can be seen as the most
desirable scenario, a “too late, too sudden” scenario would not allow for sufficient mitigation to limit
physical risks despite radical (albeit late) policy action. Quantification of trade-offs can help inform
policy action – and in an uncertain world of prediction, inform the scope for Type 1 (climate
emergency) and Type 2 (misplaced policy action) errors. The difficulty of treating physical and
transition risk lies in limited cross-disciplinary modelling and in marrying traditional macro-financial
approaches with those informed by climate science.
Early action to tackle climate change can generate considerable benefits in reducing the nature and
severity of disruptions to the economy and financial markets from climate change. That said,
investments to tackle climate change involve costs, including the costs of foregone GDP in the
event that physical climate risk manifests itself. A survey of the academic and policy literature on
measuring climate costs suggests that the macroeconomic costs of both policy inaction and action
are high – thereby creating no simple solutions, but rather trade-offs that stem from the timing and
stringency of action (see Tables 1a and b). While transition risks can be avoided through inaction,
this comes at significant economic costs through higher levels of physical damage and risk (ESRB,
2016; Finansinspektionen, 2016). The Organisation for Economic Co-operation and Development
(OECD) estimates that as much as one-tenth of global GDP could be wiped out by the end of this
century without mitigation policies, with other studies anticipating double that amount. However,
Positively green: measuring climate change risks to financial stability / June 2020
What are the shocks? Reviewing climate risks relevant for financial (in)stability
9IPCC estimates indicate that the investment needed to reach the target set in the Paris Agreement
of global warming of less than 1.5˚C could amount to USD 830 billion yearly until 2050. Studies on
4
the costs of transition to a low-carbon economy, estimate the need for investment ranging from
USD 1 trillion to USD 4 trillion in constant terms when considering the energy sector alone, or up to
5
USD 20 trillion when looking at the economy more broadly. However, if delayed, action will need to
be even more abrupt to keep temperature increases in check, further raising transition risks. These
results all point to the significant economic risks that surround both climate change and transition to
a low-carbon economy. However, the timing and magnitude of these impacts look considerably
different in the different scenarios considered. Indeed, the results illustrate how limited our
understanding still is regarding how these impacts translate into system-wide risks for financial
6
markets, particularly when second order effects are taken into account.
Table 1a
Estimates of climate risk costs: Range of estimates for the impacts of physical risk on the
macroeconomy
Studies Scenario GDP impact Timeline
Burke et al. (2015) 5 - 6°C -23% 2100
OECD (2015) 1.5°C -2% 2100
4.5°C -10%
Nordhaus (2017) 6°C -8.50% 2100
Hsiang et al. (2017) 1.5°C 0.1% to -1.7% 2100
4°C -1.5% to-5.6% 2100
8°C -6.4% to -15.7% 2100
Source: NGFS Technical Supplement, 2019, p. 7.
4
See also IMF (2019a) for a feasibility analysis of the impacts of carbon tax changes.
5
See IEA and IRENA (2017). There is also a difference in the methodology used. The IEA estimates stranded capital, while
IRENA estimates stranded value. For instance, in the upstream oil and gas sector, the IEA considers the investments by oil
and gas firms in exploration, which may not be recouped. IRENA, on the other hand, considers the potential priced-in
market value of explored reserves, which – as one might expect – is higher than the cost of exploration.
6
Wagner and Weitzman (2018) argue that climate projections can vary considerably depending on the probability
distributional assumptions employed; using a fat-tailed Pareto distribution instead of a (log)normal distribution can increase
extreme probabilities by over 40-fold.
Positively green: measuring climate change risks to financial stability / June 2020
What are the shocks? Reviewing climate risks relevant for financial (in)stability
10Table 1b
Estimates of climate risk costs: Range of estimates for the impacts of transition risk on the
macroeconomy
Studies Scenario GDP impact Timeline
IPCC (2014) Limiting warming to 2°C 1-4% of global aggregate 2030
(summary of 31 models and consumption levels
1,184 sceanrios)
Finansinspektionen (2016) Limiting warming to 2-3°C Up to 3%
German Federal Ministry of Limiting warming to 1.5-2°C 2-5% of GDP
Finance (2016)
Landa et al. (2015) Emission cuts of 40% in 2030 More than -4% of GDP, but 2050
and 50% in 2050 through positive GDP impact of
carbon taxation around 4% if carbon tax is
redistributed
OECD (2017) Limiting warming to 2°C Positive GDP impact of 2.8% 2050
TOL (2009) +2.5 and -4.8% of GDP
Acemoglu et al. (2012) Delayed policy reaction Reduced consumption by 6%
to 16%
Nordhaus (2017) Output is reduced by By the year 2100, damages
damages and mitigation will be around 4% of global
costs input
CISL (2015) Limiting warming to 2°C 3.2% higher net present 2050
value of cumulative output
compared to baseline
Wei et al. (2017) 22 different GHG mitigation Gross State Product (GSP) 2030
policies increase of $9.85 billion
pesos
Source: NGFS Technical Supplement, 2019, p. 10.
Aside from long-dated predictions, actual measurement of physical risks to date suggests that
physical and transition risks are already playing a growing role in eroding collateral and asset
values of insurers. Insurance liabilities are particularly exposed to the frequency and severity of
climate and weather-related events that damage property or disrupt trade. An analysis of global
insured catastrophe losses indicates that the share of weather-related catastrophe losses has
increased steadily to account for over 80% of insured catastrophe losses in 2018 (see Charts 1a
and 1b). At the same time, examining the number of relevant natural loss events worldwide
suggests that the frequency of weather-related loss events hit a record in 2018. Examining the
breakdown of losses suggests growth mainly in the category of hydrological events (triggered by
floods and rain), but also meteorological events (storms), with much less impact from insured
climatological events (extreme temperature-driven events, including droughts and wildfires).
Positively green: measuring climate change risks to financial stability / June 2020
What are the shocks? Reviewing climate risks relevant for financial (in)stability
11Chart 1a
Climate risk and insurance losses: Global insured catastrophe losses
(left-hand scale: USD billions in 2018; right-hand scale: percentages)
Earthquake/tsunami Man-made disasters
Weather-related catastrophes Percentage of weather-related catastrophes losses – 5-year moving average
160 100
90
140
80
120
70
100
60
80 50
40
60
30
40
20
20
10
0 0
1975 1978 1981 1984 1987 1990 1993 1996 1999 2002 2005 2008 2011 2014 2017
Sources: Swiss Re Institute, Munich Re NatCatService and ECB calculations.
Notes: Shaded areas show insured losses. The Kyoto Protocol was signed in December 1997 and the Paris Agreement was
signed in December 2015.
Chart 1b
Climate risk and insurance losses: Increasing incidence and cost of natural loss events
(left-hand scale: number of events; right-hand scale: percentages)
Post Paris agreement, € 23 billion per annum
Geophysical events
0
Meteorological events 15 11
Hydrological events 0
2 21 20
Climatological events
Pre Kyoto 22
2
Protocol,
€ 13 billion per
annum 16
23
24
12
5
18
10
Sources: Swiss Re Institute, Munich Re NatCatService and ECB calculations.
Notes: Shaded areas show insured losses. The Kyoto Protocol was signed in December 1997 and the Paris Agreement was
signed in December 2015.
In order to adequately capture the trade-offs of climate action, a suite of models is required, in
which policy analysis takes into account behavioural implications (i.e. is resilient to the Lucas
Positively green: measuring climate change risks to financial stability / June 2020
What are the shocks? Reviewing climate risks relevant for financial (in)stability
127
Critique). On the one hand, existing tools within central bank models (capturing the interplay of
financial and macroeconomic dynamics) can help quantify near-term trade-offs around a given
economic steady state (up to a three to five-year horizon). Using these models at the appropriate
level of granularity to size the substantial redistributive effects across economic sectors may still
pose a challenge. Capturing the longer-term horizon (beyond five years) of climate-related risks
calls for a broader set of methodological tools that can account for a changing steady state and
endogenise variables, such as technology, factor inputs and other growth elements. For the
purposes of financial risk management, this will require “severe but plausible” scenarios, located at
the tails of the probability distribution, which are not always congruent with the conditional
projection philosophy of climate risk modelling.
7
Structural breaks associated with climate may be quite distinct from previous economic relationships inherent to many
models, see Lucas (1976).
Positively green: measuring climate change risks to financial stability / June 2020
What are the shocks? Reviewing climate risks relevant for financial (in)stability
132 Are financial markets pricing such shocks
or building capacity to do so in the future?
Contrary to shocks to the global financial system with potentially sizeable economic effects,
financial market pricing of climate risks appears heterogeneous at best, and absent at worst. This
might not only reflect allocative market failures associated with the pricing of externalities, but also
the potential for informational market failures. Much of this stems from underlying issues relating to
data disclosure, which remain insufficient, incomplete, and inconsistent. As indicated in the
previous section, disclosures remain insufficient as they are patchy among firms. Existing
disclosures also tend to be incomplete in that they do not generally capture carbon emissions over
the lifetimes of products and measure the emissions from production, omit the emissions of
products in use (so-called Scope 3 emissions according to the Greenhouse Gas Protocol). Lastly,
data disclosures remain inconsistent and subject to greenwashing. This can be rectified by further
standardising information requirements. Addressing all three issues could, in turn, allow financial
markets to do what they tend to do best, namely efficiently allocate financial flows (see De Haas
and Popov, 2019). However, dealing with disclosures might not be sufficient to alleviate allocative
inefficiencies in financial market pricing. Given the lack of any internationally (regionally) consistent
system-wide action such as a carbon pricing scheme, the returns in carbon-intensive sectors are
likely to be overestimated. Conversely, the lack of sufficiently encompassing and rigorous scenario
analysis and the time inconsistency in investment decisions (longer/medium-term risks versus
shorter-term financial exposures), may lead to the underestimation of climate risk and suboptimal
capital allocation. Whereas a majority of banks and other surveyed institutions acknowledge that
climate change poses severe financial risks, available information suggests that they have only
recently started to consider the most immediate of these risks in their business models. In several
cases, climate change still appears to be viewed more as a corporate social responsibility issue,
which is mostly a question of reputational risk, with less emphasis on credit or market risks. In this
respect, progress made on modelling climate risk has been uneven, with some banks already
developing and implementing climate risk-related indicators, while others have adopted a more
passive approach.
Prima facie, any limited pricing differential between green and other assets may relate to
performance. On face value, there has been a discernible difference between return on equity
(RoE) for relative polluters compared with relatively clean firms in recent years (see Chart 2a). That
said, the gap in median RoE between relative polluters and cleaner firms has been narrowing.
While this helps to shed some light on the relationship between low-carbon and high carbon firms,
the definition of “relatively high-emitting” and “low-emitting” firms does not use the same threshold
as those used for green bonds, potentially distorting return differentials. As climate risks are likely to
materialise over a long-run horizon, without immediate cost incentives to tackle this externality,
such as an increase in carbon taxes, it is unlikely that firms’ returns will be affected in the short run.
Positively green: measuring climate change risks to financial stability / June 2020
Are financial markets pricing such shocks or building capacity to do so in the future?
14Chart 2a
Green bond markets – return and maturity differentials: Distribution of return on equity for
EU firms grouped by CO2 and equivalent emissions
(percentages)
Sources: Refinitiv Eikon, ESMA.
Notes: The horizontal line within each box shows the median. The top and bottom of the box = 25th and 75th percentile of the
sample. The upper and lower whisker are the respective adjacent values (box top/bottom; +/- 1.5*interquartile range).
Chart 2b
Green bond markets – return and maturity differentials: Green bond maturity buckets
(percentages)
0-5 years 10-20 years
5-10 years >20 years
100%
90%
80%
70%
60%
50%
40%
30%
20%
10%
0%
Public sector green bonds Private sector green bonds Conventional corporate bonds
Sources: Climate Bonds Initiative, Refinitiv EIKON, ESMA.
Note: Distribution of green bonds and corporate bonds outstanding in the EU by maturity bucket and source issued up to and
including November 2019.
Positively green: measuring climate change risks to financial stability / June 2020
Are financial markets pricing such shocks or building capacity to do so in the future?
15The attributes of the growing market in green bonds provides a useful illustration of trends in the
broader green assets universe. Although climate risk has a long horizon, green bonds do not have
markedly different maturities compared with conventional corporate bonds. Currently, 80% of green
bonds have a maturity of less than ten years. Green bonds issued by the public sector tend to have
longer maturities, while corporate bonds generally have shorter ones (see Chart 2b). At the same
time, differing liquidity in green versus non-green assets can also be an issue in conditioning price
8
dynamics.
Restricting the focus of financial market pricing differentials to median returns might not sufficiently
nuance expected returns. Morgan Stanley (2019) do not find any consistent or statistically significant
difference in total returns, but they do observe a 20% smaller downside deviation for sustainable
funds compared with traditional funds. Similarly, Monasterolo and De Angelis (2020) find that,
following the Paris Agreement, low-carbon and carbon-intensive indices have performed differently in
terms of equity market declines. With regard to real estate, a recent study by the Bank of England
concluded that mortgages for energy-efficient buildings are less frequently in payment arrears (Guin
and Korhonen, 2020). In a similar vein, Cui et al. (2018) suggest that Chinese banks with higher ratios
of green lending have lower non-performing loan (NPL) ratios. For other helpful literature at the
European level, see Pointner and Ritzberger-Gruenwald (2019), National Bank of Belgium (2019) and
Prudential Regulation Authority (2018). Lastly, Engle et al. (2020) show that textual analysis of the
intensity of the climate debate can provide a meaningful dynamic hedge against climate change risk.
Chart 3a
Financial market pricing of climate risk: Correlations of bank environmental scores by
Bloomberg and Refinitiv
(indices)
2009
2015
2018
90
80
Refinitiv EIKON score
70
60
50
40
30
20
10
0
0 10 20 30 40 50 60 70 80 90 100
Bloomberg environmental score
Sources: Bloomberg, Refinitiv EIKON, S&P Global Market Intelligence and Dealogic.
Notes: The Bloomberg and Refinitiv environmental scores give values of between 0 and 100, whereby a higher value indicates
a better performance in terms of environmental variables. The full unbalanced sample consists of 49 banks and 23 insurers in
the EU and the United States.
8
In this vein, Fender et al. (2019) find that, while the safety and returns afforded by green bonds support their incorporation
into reserve portfolios, their accessibility and liquidity currently pose some constraints.
Positively green: measuring climate change risks to financial stability / June 2020
Are financial markets pricing such shocks or building capacity to do so in the future?
16The limited evidence of pricing differentials in green assets compared with other assets may relate
to informational inefficiencies, in particular limited convergence of environmental scores across
main index providers. A heterogeneous set of scores have been developed by market data
providers, all seeking to consolidate quantitative and qualitative environmental information into
benchmark indices. Scores provided by Bloomberg and Refinitiv are examples of easily available
indicators on the environmental aspects reported by individual institutions and could be used as a
proxy for gauging exposure to transition risk. Although the correlation between the two indicators
has improved over time, it remains low, signalling significant discretion in environmental scoring,
most likely related to climate and broader factors (see Chart 3a). The limited correlation may have
several different explanations, including inconsistent reporting, differences in how environmental
scores are calculated, or markets not fully pricing in available information. The reporting of Scope 3
emissions or the carbon-intensity of financial portfolios remains absent in bank disclosures to date
(see ECB, 2019b). Furthermore, environmental disclosures have limited correlation with stock
market valuations for banks, but some for insurers (see Chart 3b). The relationship between an
environmental score and price-to-book ratios for a sample of large euro area insurers is somewhat
positive and statistically significant, but there is no such relationship for banks. This may reflect
greater investor scrutiny of insurers owing to their higher exposure to physical climate risk as a
result of their insurance liabilities. The limited evidence that financial institutions are actively
reducing the carbon content of their financial portfolios supports the conclusion that market
discipline is still not effective in curbing transition risk. In this context, raising awareness about the
potential effects of climate risks should remain an important task for supervisory authorities. In
particular, focus should be placed on strengthening climate disclosures, given that reporting on
greenhouse gas (GHG) emissions currently remains patchy among large fossil fuel companies,
which produce a considerable share of global carbon equivalent emissions (see the Guardian,
9
2019).
9
Indeed, according to Heede (2014), CO2 emissions are concentrated in the top 20 fossil fuel companies, which have
contributed to 35% of all energy-related carbon dioxide and methane worldwide, amounting to 480 billion tonnes of carbon
dioxide equivalent (GtCO2e) since 1965.
Positively green: measuring climate change risks to financial stability / June 2020
Are financial markets pricing such shocks or building capacity to do so in the future?
17Chart 3b
Financial market pricing of climate risk: Environmental score and the price-to-book ratios of
European banks and insurers
(indices)
Emissions score versus price-to-book ratio – EU banks
Emissions score versus price-to-book ratio – EU insurers
2.0
1.8
1.6
1.4
Price-to-book ratio
1.2
1.0
0.8
0.6
0.4
0.2
0.0
60 65 70 75 80 85 90 95 100
Refinitiv EIKON score
Sources: Bloomberg, Refinitiv EIKON, S&P Global Market Intelligence and Dealogic.
Note: The sub-sample used in the estimation consists of 16 EU insurers and 12 EU banks. Standard errors are clustered and
robust. An Arellano-Bond estimator is used, and controls include institution-specific variables (e.g. RoE, total debt, EBITDA,
total expenses, total assets, dividend payout ratio, NPL ratio, Tier 1 capital ratio, solvency coverage ratio and premium growth
when applicable) and market-specific variables (e.g. stock market volatility, long-term bond yields and GDP forecasts).
More recently, studies with a forward-looking orientation that incorporate rapidly expanding green
market capacity and are corrected for data-related deficiencies suggest limitations to the validity of
past trends, not least as uncertainties surrounding climate-related risks fall (Bolton et al., 2020).
Some recent studies indicate not only that green assets can be less risky, but that financial markets
are starting to reflect these risk differentials. Bolton and Kacperczyk (2020) find that the stocks of
firms with higher total CO2 emissions (and changes in emissions) earn higher returns, after
controlling for size, book-to-market, momentum, and other factors that predict returns. This
suggests that investors are already demanding compensation for their exposure to carbon emission
risk. In the same vein, Alessi et al. (2019) provide some evidence of a significant and negative
green risk premium – which the authors label a “greenium”, relying on company-level disclosures
and the introduction of transparency controls to account for potential “greenwashing” effects –
estimating that a reconstructed green portfolio would have outperformed brown portfolios, offering a
20% return compared with a return of just 12% for a portfolio of brown assets over the period
2006-18. Comparing the performance of high-emissions industries in the S&P 500 index before and
after the Paris Agreement, Ilhan et al. (2018) provide further evidence that investors have actually
incorporated new information when assessing risk profiles. De Greiff et al. (2018) also find that the
risk premium of fossil fuel firms has increased following the Paris Agreement and that this
reassessment can be attributed to increased awareness of transition risks (Delis et al., 2018). With
regard in particular to oil and gas companies’ market valuations, IHS Markit (2015) argues that
market mispricing of fossil fuel assets may not be as large as expected, as they are mostly driven
by commercially proven reserves that will be monetised over the medium term (within a period of
10 to 15 years) rather than over a longer-term horizon.
Positively green: measuring climate change risks to financial stability / June 2020
Are financial markets pricing such shocks or building capacity to do so in the future?
18Chart 4a
Evolution of the European green bond market: European issuance of green bonds
(EUR billions)
Reoccuring issuer Reoccuring issuer projected
New issuer New issuer projected
120
100
80
60
40
20
0
2013 2014 2015 2016 2017 2018 2019 2020
Source: Dealogic.
Note: The last observation was for 4 February 2020.
Chart 4b
Evolution of the European green bond market: Rating and issuer-sector split
(EUR billions)
2013 2017
2014 2018
2015 2019
2016 2020
80
Supranational
60 Public sector industrial
Public sector finance
40
Private sector finance
20 Private sector industrial
Sovereign
0
AAA AA A BBB Sub-IG Not rated 0 40 80
Source: Dealogic.
Note: The last observation was for 4 February 2020.
Green market capacity has an impact on investor flows, with a rapid expansion of the green bond
10
market in Europe over the past two years. Euro-denominated net green bond issuance has
10
Until recently, the EU had not defined what constituted a green bond, but as of mid-2019, the definition is tied to the EU
taxonomy of sustainable finance.
Positively green: measuring climate change risks to financial stability / June 2020
Are financial markets pricing such shocks or building capacity to do so in the future?
1911
increased more than ten-fold since 2013, reaching more than €100 billion in 2019 (see Chart 4a).
During the period 2013-18, total net euro-denominated green investment-grade issuance in the
euro area represented around 24% of global net green issuance. However, despite recent growth,
over the same period green bonds still only accounted for a small fraction of the overall global bond
supply. Although issuance of private sector green bonds as a proportion of overall EU corporate
bond issuance has risen almost five-fold over the past four years, it still accounts for only 4.7% of
issuance volumes in 2019. The share of private sector green bonds in the corporate bond market
has increased from 0.2% in 2015 to 2% in 2019. At the global level, Europe still remains a dominant
player in green bond markets, both in terms of its share of global issuance (40% of issuers of
climate bonds are by issuers domiciled in the EU) and currency of issuance (31% of green bonds
were issued in euro, followed by 24% in USD, 19% in Chinese Yuan and 17% in Indian Rupee).
The ratings-issuer split also suggests the market is broadening (see Chart 4b).
Despite a rapid expansion in capacity, the current scale of green bonds and green assets more
generally remains far from financial needs. For instance, to become climate-neutral by 2050, the
12
EU needs up to €290 billion in additional yearly investments over the coming decades. In financial
terms, green bonds tend to price tighter than the initial price guidance and to be oversubscribed.
They generally offer similar yields to comparable conventional bonds. However, there is evidence
that, in some market segments, issuers can borrow at lower rates than via conventional bonds. This
is consistent with the interpretation that investors might in some cases be prepared to forego some
income as a result of their investment constraints. As capacity grows, so too might market pricing
dynamics, as it is likely that current prices are distorted by a relatively small number of investors
with constrained investment mandates that explicitly account for climate and related risks. A closer
examination of the dynamics of green bond markets suggests a growing role for the private sector
(see Chart 5a). Within the private sector, issuance has been split somewhat evenly between the
financial sector and non-financial sector. To date, Issuance has been predominantly in the highly
rated bucket, with three-quarters of green bonds rated A or higher (see Chart 5b). While it offers
opportunities, the rapid growth in the green bond market could entail risks, not least given the
earnings uncertainty owing to the lack of knowledge regarding which technology will drive the
transition to a low-carbon economy. In this environment, any prospect of financial market
overshooting needs close monitoring.
11
See ECB (2018).
12
See European Commission (2018).
Positively green: measuring climate change risks to financial stability / June 2020
Are financial markets pricing such shocks or building capacity to do so in the future?
20Chart 5a
The financial market for green issuance: Net green bond issuance in the EU
(left-hand scale: net cumulative amount of green bond issuance by issuer type, EUR billions; right-hand scale: private sector
share, percentages)
Private sector
Public sector
Private share (right-hand scale)
300 55%
50%
250
45%
200
40%
150
35%
100
30%
50
25%
0 20%
Q4 2014 Q4 2015 Q4 2016 Q4 2017 Q4 2018 Q4 2019
Sources: Climate Bonds Initiative, Refinitiv Eikon, ESMA.
Chart 5b
The financial market for green issuance: Credit rating quality by issuer type
(EUR billions)
Private sector
Public sector
100
90
80
70
60
50
40
30
20
10
0
AAA AA A BBB Non-IG Not rated
Sources: Climate Bonds Initiative, Refinitiv EIKON, ESMA.
Note: Green bonds outstanding in the EU, by credit rating and issuer sector.
One area that has seen particularly swift market development in recent years is the EU market for
emissions allowances. Both prices and turnover have increased sharply (see Charts 6a and b),
suggesting that in recent years market forces have been trending in a direction towards more
stringent rationing of emissions. At the same time, interest in emissions trading on derivatives
markets is still limited – with the emission allowances market still negligible compared with other
derivative asset classes.
Positively green: measuring climate change risks to financial stability / June 2020
Are financial markets pricing such shocks or building capacity to do so in the future?
21Chart 6a
Emissions trading in the EU: Emission allowance prices
(EUR/tCO2)
EUA
1Y-MA
35
30
25
20
15
10
5
0
2015 2016 2018 2019
Sources: Refinitiv Datastream, ESMA.
Note: Daily settlement price of European Emission Allowances (EUA) on the European Energy Exchange spot market.
Chart 6b
Emissions trading in the EU: Emission allowance turnover
(EUR millions)
EUA
1Y-MA
90
80
70
60
50
40
30
20
10
0
2015 2016 2017 2018 2019
Sources: Refinitiv Datastream, ESMA.
Note: Monthly turnover of European Emission Allowances (EUA) on European Energy Exchange.
Positively green: measuring climate change risks to financial stability / June 2020
Are financial markets pricing such shocks or building capacity to do so in the future?
223 What can currently available disclosures
tell us about the exposures of banks and insurers
to climate-related risk?
Monitoring and quantifying risk for financial institutions stemming from near-term climate change
requires clear exposures mapping –on both the side of climate-sensitive entities and credit
institutions. For climate-sensitive entities, climate-related risks can be broken down into transition
and physical risks. For transition risks, information on emitting firms and sectors is needed. The
information that can be gauged from publicly available sources, however, remains incomplete.
Thanks to the Financial Stability Board’s Task Force on Climate-related Financial Disclosures, an
increasing number of firms have been disclosing climate-related emissions in CO2-equivalent units.
For instance, firm-level exposures to banks or insurance companies can be mapped with GHG
emissions or a related metric of emission intensity (CO2 units/sales) or even production data to
measure transition risks. For physical risks, granular locational data of factories can provide a good
indication of firms’ resilience to climate shocks such as hydrological events. For balance sheet
exposures of credit institutions, central banks and financial supervisors maintain proprietary
supervisory datasets rich in granular information. While these datasets are not specifically collected
to capture climate-related risks, they can be mapped with minor adaptations to estimate exposure
to climate-related risks associated with existing CO2 equivalent emissions disclosures (as the
capacity builds to provide a more comprehensive and commonly accepted taxonomy of climate
intensity). While available data are incomplete, they can nonetheless provide key insights into the
magnitude of exposures for banks and insurers alike. A preliminary list of the most important
indicators for the financial system is provided below (see Table 2).
Positively green: measuring climate change risks to financial stability / June 2020
What can currently available disclosures tell us about the exposures of banks and insurers to climate-related
risk?
23Table 2
Selected indicators of transition and physical risks for banks and insurers
Sector/scope Proposed indicator Financial risk category Data availability
Banking Loan book exposure to carbon- Credit risk Large exposures, credit registers and
(transition intensive sectors or firms at risk Anacredit
risk)
Equity and bond holdings Credit and market risk Securities Holding Statistics
Banking Loan book exposure to sectors and Credit and market risk Supervisory data, credit registers,
(physical counterparties subject to physical balance sheets, SDW
risk) risk – e.g. flood risk
Bond and equity holdings – exposure Credit and market risk Securities Holding Statistics, Supervisory
to vulnerable firms located in risky data, credit registers, balance sheets,
areas SDW
Historical losses due to climate Operational risk Supervisory reporting (COREP
events template) – also physical risk
Insurance Equity and bond holdings – exposure Credit and market risk Exposure data available in SII reporting
(transition to carbon-intensive sectors and
risk) sovereigns
Insurance Equity and bond holdings – exposure Market risk Exposure data available in SII reporting
(physical to vulnerable firms, sectors and
risk) sovereigns
Dramatic rise in claims due to Liability Information required on individual policy-
covered catastrophe events that level and current reserving practices,
were not considered in premiums, including market developments,
mismatch with reserving reinsurance prices Data are not available
in structured format/reporting
Both sectors Residential and commercial real Credit and market risk Supervisory data, credit registers,
(physical estate exposure to physical risks national hazard maps,
risks) (e.g. floods, fires, storms); also Private data providers like credit rating
possibly transition risks agencies, insurance companies
The granularity of financial institution exposures to climate change risk can be measured at the
firm, activity or sectoral level in addition to the commonly reported country level. Climate change
financial risk metrics are generally constructed at different levels of aggregation. This report
identifies four levels: country, sector, firm and activity-level (see Table 3). Each of these levels is
bound to suffer some degree of reporting gap that needs to be resolved. Even in the case of simple
summary statistics of climate change risk such as CO2 emissions, parameters like data granularity,
coverage or accuracy still present considerable challenges. The lack of accurate data can preclude
a rigorous analysis of these risks.
Positively green: measuring climate change risks to financial stability / June 2020
What can currently available disclosures tell us about the exposures of banks and insurers to climate-related
risk?
24You can also read