HYDROGEN APPLICATIONS IN TRANSPORT - HFCV VS EV VS ICE, PRODUCTION ROUTES, KEY CHALLENGES, ECONOMICS, TRANSITIONING COMPANIES AND PLANNED PROJECTS ...
←
→
Page content transcription
If your browser does not render page correctly, please read the page content below

HYDROGEN APPLICATIONS IN TRANSPORT
    HFCV VS EV VS ICE, PRODUCTION ROUTES, KEY CHALLENGES,
ECONOMICS, TRANSITIONING COMPANIES AND PLANNED PROJECTS

               Cameron Rout, James Hammerton & Hu Li

                                        SEPTEMBER 2019
Table of Contents:

Executive Summary............................................................................................................................................ 6

1.     An Introduction to Hydrogen Fuel .............................................................................................................. 7

     1.1.    A Brief Background .............................................................................................................................. 7

     1.2.    Hydrogen vs Conventional Fuels ......................................................................................................... 8

     1.3.    Comparison of FC vs EV vs ICE vehicles ............................................................................................... 9

       1.3.1        Emissions.................................................................................................................................... 11

       1.3.2.       Infrastructure ............................................................................................................................. 12

       1.3.3.       Technology Maturity .................................................................................................................. 14

       1.3.4.       Driving Range ............................................................................................................................. 16

       1.3.5.       Fuel Purity .................................................................................................................................. 17

       1.3.6.       Overall Cost ................................................................................................................................ 18

     1.4.    H2 Production Routes ........................................................................................................................ 19

       1.4.2.       Reforming and POx .................................................................................................................... 19

       1.4.3.       Electrolysis ................................................................................................................................. 21

       1.4.4.       Renewable Liquid Reforming ..................................................................................................... 22

       1.4.5.       Fermentation ............................................................................................................................. 23

       1.4.6.       Photo Electrochemical (PEC) Water Splitting ............................................................................ 23

       1.4.7.       Photobiological .......................................................................................................................... 23

       1.4.8.       Types of Production Facilities .................................................................................................... 24

     1.5.    Key Challenges to H2 Implementation (Storage, Infrastructure Etc.) ............................................... 25

       1.5.2.       Storage ....................................................................................................................................... 25

       1.5.3.       Distribution and Delivery ........................................................................................................... 26

       1.5.4.       Infrastructure ............................................................................................................................. 28

       1.5.5.       Standards and Safety: ................................................................................................................ 28

       1.5.6.       Cost: ........................................................................................................................................... 30

       1.5.7.       Public Response: ........................................................................................................................ 30

                                                                                  1
2.     A Closer Look at Hydrogen Vehicles: ........................................................................................................ 31

     2.1.    Major Components of HFCVs and Operating Principles: .................................................................. 33

     2.2.    Hydrogen Powered ICE Vehicles ....................................................................................................... 34

       2.2.1.       Hydrogen for Intermittent Use in ICE ........................................................................................ 36

       2.2.3. Dual-Fuel/Hydrogen Mixtures for ICE ............................................................................................ 36

     2.3.    Conversion Efficiencies...................................................................................................................... 37

     2.4.    The Market Position .......................................................................................................................... 38

       2.4.1.       Global and UK Production and Consumption ............................................................................ 39

     2.5.    Manufacturing and Fuel Costs .......................................................................................................... 41

     2.6.    Lifespan and Range ........................................................................................................................... 42

3.     Planned and Approved Projects in the North/UK .................................................................................... 42

4.     Current/Future Applications in Transport ................................................................................................ 46

     4.1.    UK-Based Projects ............................................................................................................................. 47

     4.2.    International Projects ........................................................................................................................ 49

     4.3.    Non-Application International Projects ............................................................................................ 52

5.     Hydrogen Vehicle Fleets in the UK ........................................................................................................... 53

     5.1.    An Introduction to Hydrogen in the UK ............................................................................................ 53

     5.2.    Public Access Fleets ........................................................................................................................... 54

     5.3.    Governmental Fleets ......................................................................................................................... 56

     5.4.    Fleet Transition Studies ..................................................................................................................... 57

       5.4.1.       Knoxville Bus Fleet ..................................................................................................................... 57

       5.4.2.       Policy Considerations ................................................................................................................. 60

6.     Current and Future UK H2 Activity Map: .................................................................................................. 60

     6.1.    All Existing and Planned UK Hydrogen Activities (Diagram and Table):Error! Bookmark not defined.

7.     Proposed Actions and Objectives ............................................................................................................. 65

8.     References: ............................................................................................................................................... 66

                                                                                 2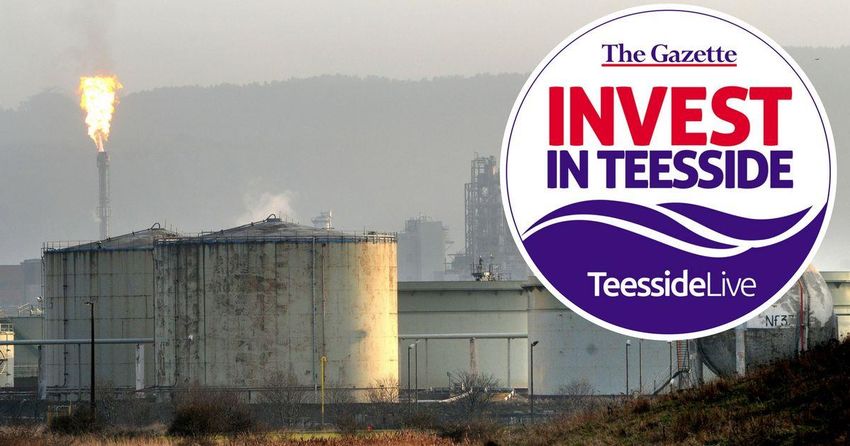
List of Figures:
Figure 1 - Specific energy per unit mass of hydrogen and other fuels (Arup, 2019)......................................... 9
Figure 2 - Global warming potential of different vehicle types (Acar, C, 2018). ............................................. 11
Figure 3 – All EV charging points around the Leeds region (ZapMap, 2019). ................................................. 13
Figure 4 – The HFC tractor from 1959 (NMAH, 2019). .................................................................................... 15
Figure 5 - Driving range of different vehicle types (Acar, C, 2018).................................................................. 17
Figure 6 - SC-CO2 of different vehicle types (Acar, C, 2018). ........................................................................... 19
Figure 7 - SMR process flow diagram (HydrogenEurope, 2019)...................................................................... 20
Figure 8 - Electrolysis of water to form hydrogen (energy.gov, 2019). ........................................................... 21
Figure 9 – A liquid hydrogen tanker truck (United Hydrogen, 2019). ............................................................. 27
Figure 10 - The invisible hydrogen flame (Okino, T, 2019). ............................................................................. 29
Figure 11 - A typical HFC operating principle (SMMT, 2019). ......................................................................... 34
Figure 12 Flammability limits of common engine fuels in terms of air-fuel ratio (λ). Note: Air-fuel ratio
operation range from an engine would be narrower than shown as there are other limitations, such as flame
speed and unburned fuel emissions. ............................................................................................................... 35
Figure 13 Typical variation of emissions of NOx with air-fuel ratio during homogeneous operation with
hydrogen (Verhelst and Wallner, 2009; Wallner et al., 2008)......................................................................... 35
Figure 14 Improvement in the thermal efficiency of gasoline engines. From Takahashi et al. (2015) ........... 38
Figure 14 - Production and consumption of global hydrogen iMechE. (2019). .............................................. 39
Figure 15 - Global demand for pure hydrogen (IEA, 2019). ............................................................................ 40
Figure 16 - Policies supporting hydrogen transitions (IEA, 2019).................................................................... 41
Figure 17 - Government budgets for hydrogen research over the past 15 years (IEA, 2019). ....................... 41
Figure 18 - Teesside's hydrogen campaign (McNeal, I, 2019). ........................................................................ 43
Figure 19 - H21 North of England map Sadler, D. (2018). ............................................................................... 44
Figure 20 - HyNet proposed cluster (Cadent, 2019). ....................................................................................... 45
Figure 21 - The 500 planned homes in Aberdeen (BBC News, 2019). ............................................................. 46
Figure 22 - Schematic of hydrogen trains operating principles (Burridge, T, 2019)........................................ 48
Figure 23 - Hydrogen double-decker buses in London (Barrett, T, 2019). ...................................................... 49
Figure 24 - Breeze hydrogen trains plan to come to the UK by 2022 (Alstom, 2019). .................................... 49
Figure 25 - Coradia iLint hydrogen train by Alstom (Alstom, 2019). ............................................................... 50
Figure 26 - Hydrogen fuel cell delivery truck by UPS (Mathews, L, 2019)....................................................... 50
Figure 27 - Hype taxis in Paris (Roy, J, 2019). .................................................................................................. 51
Figure 28 - HY4 - World's first hydrogen aircraft. ............................................................................................ 52

                                                                         3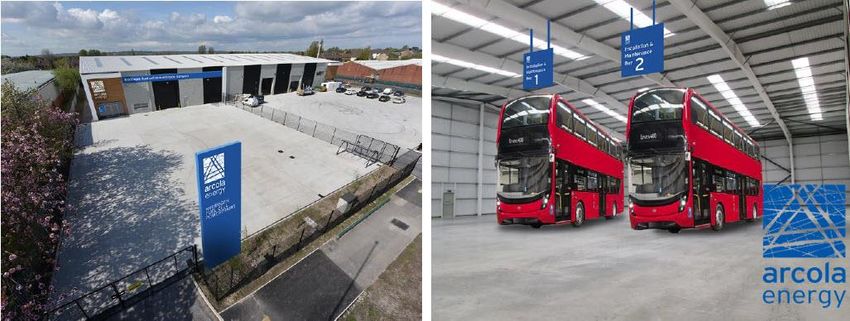
Figure 29 - Skai flying taxi concept (Fish, T, 2019). .......................................................................................... 52
Figure 30 - Arcola Energy hydrogen bus maintenance facility (Fuel Cell Works, 2019). ................................. 56
Figure 31 - Toyota Mirai HFCV used by the Met Police (Fossdyke, J, 2018). ................................................... 57
Figure 32 - Hydrogen vs conventional fuel bus data for 3 case studies (Langford, B, 2011). ......................... 58
Figure 33 - Knoxville bus fleet breakdown (Langford, B, 2011)....................................................................... 58
Figure 34 - Total dispensers used and associated refuelling times (Langford, B, 2011). ................................ 59
Figure 35 - UK hydrogen activity map.............................................................................................................. 61

                                                                         4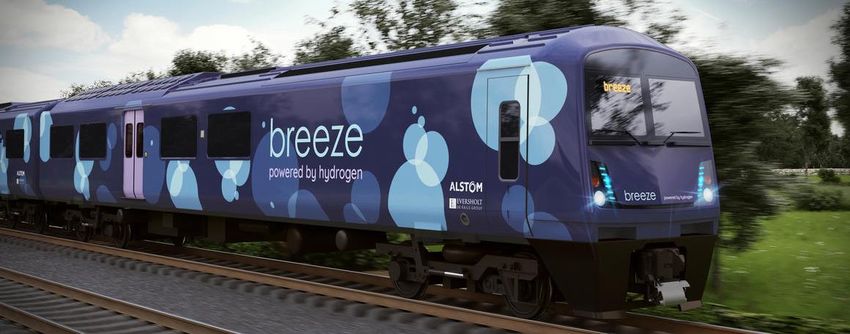
List of Tables:
Table 1 - Opportunities and challenges of a hydrogen economy (Arup, 2019). ............................................... 8
Table 2 - Typical emissions from all vehicle types. .......................................................................................... 11
Table 3 - Technology maturity of ICE, EV, and HFCVs. .................................................................................... 16
Table 4 - Hydrogen safety pros and cons......................................................................................................... 29
Table 5 - Some thermochemical parameters of hydrogen and methane (Acar, C, 2018). ............................. 31
Table 6 Maximum power output with respect to gasoline of different fuels depending on the injection
method ............................................................................................................................................................. 36
Table 7 Conversion efficiencies of technologies for utilisation of hydrogen in transport .............................. 37
Table 7 - Existing refuelling stations. ............................................................................................................... 62
Table 8 - Planned refuelling stations. .............................................................................................................. 62
Table 9 - Hydrogen projects. ............................................................................................................................ 63
Table 10 - Hydrogen fleets. .............................................................................................................................. 63

                                                                                  5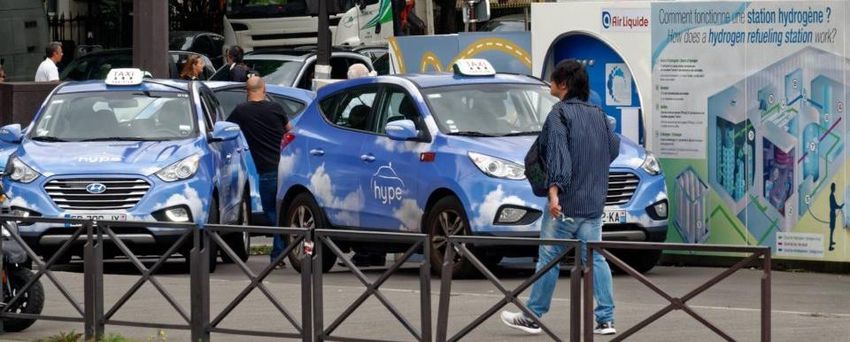
Executive Summary

The transition towards hydrogen in the transport sector is a huge challenge, but also presents great
opportunity for achieving both reduced emissions and improved air quality. Although there have been a
number of studies and trials focused on hydrogen vehicles in the UK, targeted towards their performance
and cost, these have been limited in their usefulness as they are based on specific fleets and locations. Other
regions (such as the hydrogen corridor in the North of the UK) may not have the same resources available
and this puts limitations on what these areas can achieve, for example.

This report covers the fundamentals of hydrogen for use as a future transport fuel and highlights some of
the major reasons for using hydrogen in the future. In addition to this, multiple factors are discussed which
must be considered in detail in the event of a transition period taking place. Some of these include hydrogen
production routes, current market position, existing and planned UK projects and fleets, and advantages
over conventional fuels, as well as challenges that must be overcome in order for it to compete with
electrification and become a sustainable and viable alternative. These challenges include the limited
refuelling infrastructure, safe storage and delivery of hydrogen fuel, production emissions, high cost, and
public acceptance, for example. Also in this report is a mapped summary of the major UK hydrogen activity,
and actions proposed with regards to further hydrogen research and innovation, along with potential
industrial partners and refined research objectives.

                                                       6
1. An Introduction to Hydrogen Fuel

1.1. A Brief Background
As the population continues to soar and demand for products and services rises, it has led to an increase in
energy consumption; the majority of which has been generated from fossil fuel based resources which are
of course finite and lead to negative impacts including the release of greenhouse gas emissions, for example.

The transport sector is a major contributor towards greenhouse gas emissions, not only in the UK, but
worldwide, with approximately one third of all carbon dioxide emissions in the UK coming from road
transport in 2018 (DBEIS, 2019). Although these emissions figures have been falling in recent years thanks
to the introduction of cleaner fuels and improvements in conversion efficiencies, it is still an area of concern
with more awareness and pressure being put on reducing the rate of global warming. In addition to this, UK
air quality has also been receiving more attention lately with the publishing of the Clean Air Strategy in 2019,
aimed to lower pollutant concentration levels. On 27th March 2019, the government also issued a climate
emergency in Leeds, stating that emissions must be reduced, and aimed to be carbon neutral by 2030.

In 2017, the transport sector was the largest energy consumer in the UK and represented 40% of final energy,
up 0.9% compared to the year before, with road transport accounting for the majority of this, with
approximately 73% (DBEIS, 2018). This has shown to slow however, with a rise of only 0.1% between 2016
and 2017, although electricity usage for road transport has increased sharply by 33% due to the growth of
electric vehicles (EVs) (DBEIS, 2018). As a result, the transport sector has been much slower to decarbonise
compared to other industries such as energy, for example.

The use of these alternative fuels and technological engineering advancements in the transport sector is now
gaining momentum, driven greatly by the introduction of companies such as Tesla in 2003. These promote
a transition towards more sustainable energy, specifically by bringing EVs to the mainstream market.
However, it is not only these EVs which are predicted to overtake the fossil-fuel-dominant transport sector;
hydrogen fuel cell vehicles (HFCVs) have also seen great developments in recent years and could be another
major player in the future automotive industry. The use of hydrogen can alleviate some of the issues
associated with fossil fuel use and there are a number of drivers for an overall wider hydrogen economy in
the UK:

   1. More hydrogen-related jobs available – and more tax to the government.
   2. Reductions in GHGs and improvements in air quality and health.
   3. More consistent price of energy – Takes advantage of renewable energy.

                                                       7
4. A self-sufficient country – not dependent on other countries (high energy security).

However, although hydrogen presents a number of opportunities for decarbonising the future of the UK and
several advantages compared to other energy vectors, it does still hold a number of challenges which must
be overcome. These are currently under development and are outlined below:

                       Table 1 - Opportunities and challenges of a hydrogen economy (Arup, 2019).

                    Opportunities:                                                  Challenges:
      Decarbonised gas network in city centres.                         Efficiencies are not high enough.
               Minimal GHG emissions.                                   Lack of necessary infrastructure.
    High energy security and seasonal resistance.                           Public support is lacking.
        Energy storage easier than electricity.                      More storage space and tech needed.
         Safety aspects similar to natural gas.                                      High cost.
        Fast vehicle refuelling and long range.                       Policies must be developed further.
                   New job creation.
     UK can lead the global hydrogen transition.

1.2. Hydrogen vs Conventional Fuels
Hydrogen is the most abundant element in the universe and is a major source of energy, making it a potential
fuel for transport. It is incredibly light and versatile, giving it a very high specific energy by mass – nearly 3x
as high as methane, but can rarely be found in pure form; it is almost always found as part of another
compound. However, thankfully it can be produced in several ways, both sustainably and not, through
processes such as steam methane reforming (SMR) and electrolysis, for example. However, as its use in fuel
cells is still relatively new compared to other, more mature alternatives, it presents a series of challenges
which must be overcome before it can compete in the marketplace.

                                                           8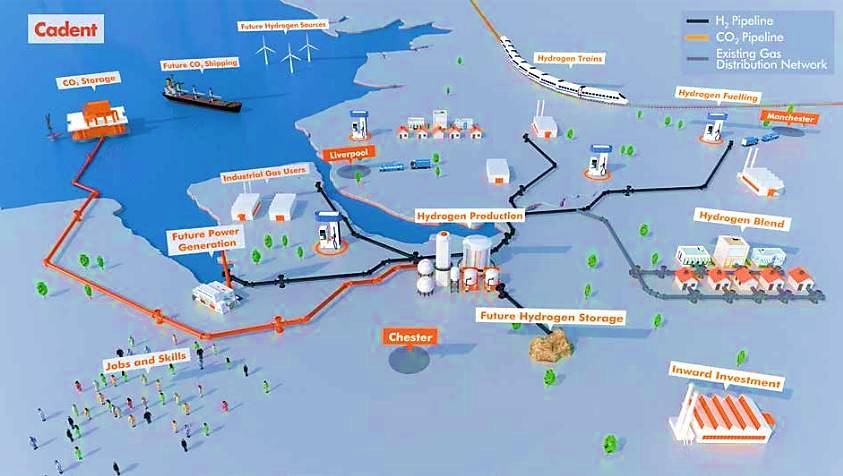
Figure 1 - Specific energy per unit mass of hydrogen and other fuels (Arup, 2019).

Alternative fuels represent only a very small fraction of transport fuels in the UK, as the majority of cars on
the road still run of traditional fossil fuels of petrol and diesel. 2018 saw roughly 38.2m vehicles registered
on UK roads, with approximately 200,000 ultra-low emission vehicles (ULEVs), which was a 39% increase
compared to 2017, representing 0.5% of total licensed UK vehicles (National Statistics, 2019). In addition,
registered diesel vehicles dropped by 30%, and petrol vehicles rose 9%. Alternative fuel cars increased by
22% in 2018, with 59% of these being hybrid electrics (National Statistics, 2019).

ULEVs are those which use low carbon technology to emit less than 75g CO2/km and are growing in
popularity according to statistics (SMMT, 2019). As these alternative fuels grow and develop, the use of
diesel and petrol cars should decline in the future as a result, especially with the various government grants
and incentives that are in place to promote their purchase and use, such as the ‘plug-in’ grant, for example.

The major difference between conventional fuels and more sustainable alternatives however is in their
emissions. Typical fuels of petrol and diesel when combusted in an internal combustion engine (ICE) release
harmful pollutants such as carbon dioxide, NOx, and carbon monoxide, for example. However, if hydrogen is
used in a fuel cell, the process is net-zero, with emissions of only water and heat. Although this is highly
dependent on the route chosen for the hydrogen as many production pathways include the release of
greenhouse gases (GHGs), making the overall process less eco-friendly. So, renewable hydrogen sources
must be used. Other differences include thermochemical qualities such as combustion/thermal efficiency,
ignition values, diffusivity, and flammability, for example.

1.3. Comparison of FC vs EV vs ICE vehicles
The current UK transport scene is a mix of different vehicle types, with the majority being made up of internal
combustion engines (ICEs). However, these are highly polluting, and release large quantities of particulate
matter, carbon monoxide, and NOx compounds which contribute towards poor air quality and negative
health effects (Condliffe, J, 2017). As a result, the government introduced new policies and targets in 2017

                                                             9
and 2018 to have almost all cars and vans to be zero-emissions by 2050 and to reduce their numbers on the
road, with the sale of new ICE petrol and diesel cars being stopped in 2040 (parliament.uk, 2019).
Alongside this, the government is pushing for a transition towards renewable alternatives such as electric
vehicles (EVs) which are much cleaner to the environment, releasing zero emissions. This is being done
through various financial grants and incentives, such as the plug-in grant, which offers £2,500-4,000 for
certain EVs purchased, as well as the development and installation of more charging points, making
infrastructure more readily available, promoting the growth of the EV market – the UK had approximately
3,800 publically funded points in 2018, although this must increase if EVs are to overtake the sale of ICEs in
the future (House of Commons, 2018). With these actions taking place, it is predicted that by 2040, roughly
55% of new car sales will come from EVs (carbonfootprint, 2019).
Hydrogen fuel cell vehicles (HFCVs) are also gaining in interest by many as a potential transport option with
growing concerns regarding climate change and the release of GHGs. Similarly to EVs, these emit zero
emissions when renewable energy sources are employed to produce the hydrogen fuel, although this is not
always the case. Their technology is also much less mature than that of EVs, with high costs for fuel cell
production and a limited range of refuelling infrastructure, which demands further funding and development
if public uptake is to improve in the future.
Kalghatgi et al investigated the future of ICEs in a world now moving towards EVs and low-carbon
alternatives and stated that it would be several decades before these are fizzled out due to the lack of
charging infrastructure and the shear quantities of electricity that would be required. It was also predicted
that ICEs will be used and will continue to improve and develop further in the future, with low-carbon options
playing a small role, making possibly only 10% of total transport energy demand by 2040 due to negative
business cases and a low market uptake in the development stages. However as infrastructure becomes
more readily available and costs reduce, this transition may take place more rapidly.
Acar et al investigated the potential of hydrogen as a sustainable alternative transport fuel and conducted
several studies using integrated assessment models to examine the differences between HFCV, EVs, and ICEs
respectively; a few of which will be shown in later sections of the report. However, the key takeaways from
these tests showed that in terms of environmental impacts, the global warming potential of both HFCVs and
H2ICEs was the lowest with approximately 7.10 and 6.40kg per 100km travelled, respectively (shown below
in Figure 2). This suggests hydrogen can be a more eco-friendly option when compared to EVs and
conventional ICEs for example, as these gave higher figures of 11.40 and 21.40kg respectively, although
production stages must also be taken into account.
10Figure 2 - Global warming potential of different vehicle types (Acar, C, 2018).
This section of the report is aimed to outline the key differences in each of these vehicle types, taking into
account several factors such as emissions, cost, technology maturity, driving range, available infrastructure,
and fuel quality respectively. These will also be discussed separately in greater depth with a closer focus on
hydrogen throughout the report.
1.3.1 Emissions
In 2017, transport accounted for approximately 28% of all UK GHG emissions, which was the largest
proportion from any sector (House of Commons, 2018). The government has since re-emphasised and
introduced a number of schemes and targets to improve these figures, including the Climate Change Act of
2008, which led to a big improvement in UK decarbonisation. This should see an 80% reduction in GHGs by
2050, compared to 1990 levels - though this has now been revised to a net-zero target. The Clean Air Strategy
in 2019 also aimed to reduce pollutant concentrations such as PM, for example, limiting concentration levels
to an average of no more than 10ug/m3 each year (Defra, 2019). Emissions therefore play a very important
role nowadays in the introduction of new vehicles types. Table 2 below shows the potential emissions from
all 3 vehicles types respectively:
Table 2 - Typical emissions from all vehicle types.
ICEs: EVs: HFCVs:
Petrol and diesel cars emit EVs do not emit GHGs, unless When the hydrogen being
large quantities of CO2, CO, the electricity they use is used in FCVs is from
PM, NOx which are very generated in power plants renewable sources, the only
harmful to the environment. from fossil fuel burning, for emissions are water and heat.
example.
11 They operate by burning fossil New methods of electricity If hydrogen is produced by
fuel resources directly, which generation must be other means, emissions may
are finite resources, leading developed in order to be released during the
to their depletion soon in the improve the emissions production route. Examples
future, which is not throughout the production include electrolysis and SMR,
sustainable. route. Renewable sources which burn fossil fuels
must be used more releasing CO2.
frequently.
Their thermal efficiency is low Producing the battery for an A study found that a Toyota
compared to EVs. EV can be a very energy- HFCV model produces
intensive process. ~120g/km CO2 over its
lifetime when considering the
manufacturing process
(TheWeek, 2019). But this can
be reduced massively if
hydrogen is produced
sustainably.
Average emissions from Emissions equate to roughly SMR is the most common
driving 10,000 miles using an 83g/km of CO2. And when production method for
ICE have been estimated at charging is taken into hydrogen. However this
2.99 and 2.88 CO2e in the UK account, it is 124g/km releases around 10kg CO2 for
for both petrol and diesel cars (TheWeek, 2019). every kg of H2 produced –
(carbonfootprint, 2019). roughly 62g CO2e per km
(TheWeek, 2019).
Average emissions from
driving 10,000 miles using an
EV have been estimated at
0.96t CO2e in the UK
(carbonfootprint, 2019).
1.3.2. Infrastructure
The transition towards a low carbon economy will not take place unless there is sufficient infrastructure to
support the use of EVs and HFCVs. Conventional ICEs have been in use for many years and have an extensive
range of existing infrastructure. However, the development of EVs has seen a rise in charging points, with a
large number located around Leeds (shown in Figure 3) and approximately 13,000 now available to the public
across the UK (Rosamond, C, 2019). It is these which pose the biggest threat to the market, with many
people still apprehensive as to whether they will be able to gain easy access to a charging station in their
area or during a journey due to the limited range of current EVs, for example. These are continuing to grow
12though, with government funding helping to open more points across the country, and even allow people to
charge their vehicles from home and at work, promoting the transition. Further research is needed however
on the total demand required to support the country in the future, and the associated costs of providing
such a vast network of stations. In previous years, the charging was free in many cases, in order to help push
the use of EVs, but now due to the rapid increase in users, charges are being applied which could discourage
people slightly. Companies such as Tesco are planning to open over 2000 charging stations at their stores
over the next few years and BP has made plans to become the UKs leading public network of EV charging
stations (Sultan, F, 2019). This will mean people can more easily charge their vehicles, taking only
approximately 20 minutes to fill the vehicles from empty, depending on the type of charging connector used.
These are highlighted below:
1. Rapid Chargers: The fastest chargers available. These range between 43-50kW and can charge 80%
of the battery between 30m-1 hour.
2. Fast Chargers: Ranges between 7-22kW and charge takes approximately 4 hours. These are
considered the most common chargers currently available in the UK.
3. Slow Chargers: Can reach 3kW in power and require overnight charging. However, these chargers
can operate with a normal 3-pin plug, typically used in UK homes.
Figure 3 – All EV charging points around the Leeds region (ZapMap, 2019).
In contrast however, the UKs HFCV infrastructure is much less developed. As the use of HFCVs is not as high
compared to EVs, funding has been much less frequent and as a result, their costs are higher and there are
13only a small number of refuelling stations scattered around the UK at the moment, with the majority based
in London. There is however one station in Rotherham, but this still leaves a very sparse central region which
may present difficulty to drivers when running low on fuel, for example. In order for ample hydrogen to be
available to all during high demands in the future, renewable production routes must increase and the
distribution and storage of this hydrogen must also develop.
There is a clear trade-off here between a lack of funding for infrastructure, which is restricting public uptake,
and a lack of investor confidence in hydrogen due to low user volumes, for example. It seems something or
someone must move first if the hydrogen economy is to really take off in the future, and this has to be
related to funding. As a result, the Department for Transport recently gave £8.8m in funding towards the
development of the hydrogen infrastructure in the UK, specifically 4 new refuelling stations and
approximately 200 HFCVs for use by the MET police and others respectively (Corfield, G, 2018).
With plans to add new refuelling stations around the UK in the future, these challenges may fade. Tees Valley
is opening two stations around Middlesbrough and Redcar, and providers ITM Power have also installed a
hydrogen pump in a Shell petrol station on the M40 (joining Birmingham and London), which is uncommon
and may help to generate a buzz among the public when filling up. Other companies are using HFCVs in their
fleets, such as Yorkshire Ambulance Service and the Natural History Museum. Many regions are introducing
new hydrogen fleet projects such as the Aberdeen and Liverpool Bus Project, for example, which may help
improve public perception of hydrogen and spark an increase in its use among other companies in the future,
which would call for a push on its infrastructure, for example.
1.3.3. Technology Maturity
The technology behind all ICEs, EVs, and HFCVs vehicles differs due to many factors, including engineering
advancements and government funding, for example. Technological developments and new prototype
designs cannot be pilot tested unless companies secure funding to help support the projects.
As mentioned previously, the ICE is a well-established and mature technology, which has been in operation
for many years and is the most common form of transportation in the UK. The first modern ICE was designed
in 1876 and it was used in a commercial vehicle 10 years later. It still uses the same basic operating principles
now as it did back then, however advancements in emissions control and efficiency have developed greatly,
for example. ICEs can be used for a range of vehicle sizes, from small hatchbacks to large HGVs, and can
transport a range of loads also. The same cannot be said for EVs however…
Like the ICE, EVs have been in use for centuries, with the first electric motor powered car being designed in
1828 (Robertson, M, 2019). After this, further developments were made and larger vehicles were being
created all around the world, with EVs running on batteries. Since then, companies such as Tesla have taken
14over the market and brought EVs to the public eye, with Roadster models proving a practical and sustainable
alternative to the ICE. Although they do not emit harmful GHGs like that from ICEs when the electricity is
produced sustainably, they do currently lack a big range which is one of the biggest technological roadblocks
to their use, and the batteries used also limit the vehicles they are suitable for. For example, the batteries
required to power a larger vehicle with a heavier weight and a higher load are very big and heavy and there
simply is not enough storage space on board to make this practical. In addition to this, EV batteries are still
expensive to purchase when compared to ICEs and have long refuelling times of >8 hours (Houses of
Parliament, 2010). These shortcomings all need further development in order to generate higher public
appreciation and approval.
HFCVs are the newest vehicles to hit the UK market, however, similarly to EVs, fuel cells have been in use for
many years prior. The first working fuel cell was introduced in 1842, and employed a platinum catalyst to
facilitate the reactions (Morus, I, 2017). However, in terms of fuel cells for transport, this wasn’t introduced
until much later in 1959 when a tractor was fitted with one (NMAH, 2019). Since then, developments have
continued and in 2013 the first commercially available HFCV was brought on to the market from Hyundai,
swiftly followed by the Toyota Mirai in 2015. Now, further research and development is being carried out to
introduce larger vehicles such as trains, boats, and trucks, fuelled using hydrogen fuel cells.
However, as this technology has not been commercially available for long, it has meant that the associated
infrastructure required is not as readily accessible, which limits the public uptake. Though this is an obstacle
to overcome, the actual technology of fuel cells has been around for some time now. The basic principles of
fuel cell technology do not show many limitations other than improving the efficiency - instead, the major
challenges arise in the cost, storage, and infrastructure of the technology itself.
Figure 4 – The HFC tractor from 1959 (NMAH, 2019).
15Table 3 - Technology maturity of ICE, EV, and HFCVs.
ICEs: EVs: HFCVs:
Most common engine type in the Limited range of vehicles Could be used for all vehicle
world. Been in operation for available. types. Prototype planes, trains,
centuries. and ferries all use HFC
technology.
Improvements have been made Currently not suitable for heavy Higher efficiency than ICE but
in efficiency and emissions vehicles such as trucks, trains, still improving.
reduction. and ships.
Suitable for all vehicle sizes and Batteries required are still costly Major challenges are non-
loads. and take a long time to charge. technology related.
1.3.4. Driving Range
The distance that can be travelled using each of the technologies depends on the fuel properties and the on-
board storage available, for example. Hydrogen typically takes the same amount of time to refuel as an ICE,
and gives a much better driving range when compared to EVs. The Toyota Mirai is one of the most common
FCVs and has a range of approximately 312 miles, whilst a high-end EV (the Tesla Model S) only manages
around 294 miles, and the common Nissan Leaf manages 168 miles, whilst taking over 30 minutes to charge
fully using the fastest chargers (Mok, B, 2017). ICEs running on petrol or diesel have a far higher range
compared to both of these alternatives however, with some cars on the market being capable of travelling
over 1000 miles per tank, such as the VW Golf (1,046 miles) and Ford Focus (1,112 miles), for example (Smith,
L, 2019).
One study mentioned previously by Acar using integration models also assessed the driving range of different
vehicles (Figure 5) and this showed poor results in the case of fuel cells. HFCV and H2ICEs were among the
lowest with only 355 and 350km (second behind EVs at only 160km), and ICEs were the second highest
behind hybrids with roughly 540km respectively. However, with the technology rapidly developing as new
funding opportunities arise, these limitations may not be an obstacle for much longer.
Driving range is a major challenge for the EV industry, with many people worried about running out of fuel
and not finding a refuelling station nearby, though work is being done to improve this soon in the future.
16Figure 5 - Driving range of different vehicle types (Acar, C, 2018).
1.3.5. Fuel Purity
The most common and cheapest method for producing hydrogen currently is steam methane reforming
followed by purification by pressure swing absorption (PSA) (Broda et al., 2013). Hydrogen contains several
impurities such as carbon monoxide, carbon dioxide, nitrogen, noble gases, hydrocarbons, ammonia and
sulphur compounds (Barthélémy, 2011; Relvas et al., 2018). For use in fuel cell electric vehicles, these need
to be reduced significantly to maintain the lifespan of the cell, as well as to keep it operating at maximum
power and efficiency (Murugan and Brown, 2015). There is currently a standard for the quality of hydrogen
for fuel cells (ISO 14687-2) but none for use in internal combustion engines. Particular caution is made to
the concentration of carbon monoxide and sulphur compounds which absorb onto the surface of the
catalyst, impeding the electrode transfer process (Reshetenko et al., 2012). In the case of sulphur
compounds, the catalyst can be permanently degraded by low concentrations in hydrogen (Kakati et al.,
2016; Lee et al., 2018). Hence, the carbon monoxide and sulphur levels are kept to below 0.2µmol/mol and
0.0042µmol/mol respectively (International Organization for Standardization, 2012)
For internal combustion engines, fuel carbon monoxide impurities in hydrogen are not as stringent as HFC,
the main reason for a limit being safety. Sulphur impurities in hydrogen for ICEs are still an issue as they
damage diesel catalysts and contribute to SOx emissions (Li et al., 2012). However, the removal of sulphur
impurities by PSA is less challenging than carbon monoxide (Ohi et al., 2016). The presence of inert impurities
in hydrogen will have little effect on the combustion behaviour of hydrogen in an ICE. Overall, the amount
of upgrading of hydrogen produced from steam methane reforming is less for use in an ICE than a HFC.
The lower purity requirements for ICE means that there is potential to reduce costs in the upgrading
procedure. Currently, PSA is the most cost effective and widely used upgrading process used (Relvas et al.,
2018; Li et al., 2016). The percent cost of a PSA unit for delivering fuel cell grade hydrogen has been
estimated to be just 6% of the price, therefore the fuel cost benefit per kilogram for using a lower purity
grade for ICE is negligible (Ohi et al., 2016). Also, considering that separate filling stations would have to be
17purchased for a lower purity ICE grade hydrogen fuel, the savings in production costs are unlikely be enough
to warrant this.
To make significant cost savings on fuel using hydrogen ICEs compared to HFCs would require blending with
other gaseous fuels which are cheaper than hydrogen. Hythane, which is a mixture of 20vol% of hydrogen in
natural gas is an example of a vehicle fuel which is considered by many of a more cost effective way of using
hydrogen in transport (Middha et al., 2011).
1.3.6. Overall Cost
The purchase cost of conventional vehicles is much lower compared to EVs and HFCVs. This is because of the
development of the engineering technology involved, which is still taking place in the latter cases. ICE
vehicles range from roughly £10,000 to over £500,000 depending on the engine size and specifications, for
example, whereas EVs and HFCVs are much higher (covered in Section 1.5.5.). Using a quick calculation we
can say that diesel costs approximately £1.32/litre and assuming a fuel consumption of 40mpg, this gives an
overall cost of roughly £7.80/100km.
However, as technology maturity is relatively low for HFCVs, the cost of manufacturing the individual
components is high and this leads to high purchase costs in order for profits to be made, for example. A
typical PEM fuel cell has been estimated to cost at least $3,500 in the case of small vehicles, with larger
trucks and so on costing much more. In addition to this, the hydrogen fuel is also very expensive as demand
is low and there are limited refuelling stations and distribution facilities, for example. As a result, hydrogen
costs roughly £12/kg, and when using a fuel consumption of 57 miles/kgH2 (given in Section 2.4.), this means
a 100km trip will cost approximately £13, far higher than ICE vehicles (Auto Trader, 2018).
In the case of EVs, fuel consumption figures have been quoted at 14.3kWh/100km (Auto Trader, 2018). Using
this as a guide, and the fact that 1kWh costs approximately 16p, a journey of 100km will only cost around
£2.28, which is the cheapest option by some distance. However, although cheaper than ICE vehicles, their
purchase costs are much higher and the availability of EV charging points are much lower so there is some
trade-off present.
The social cost of carbon (SC-CO2) is also a monetary value used to measure the long-term damage caused
by one tonne of CO2 emissions. These calculations are made using integrated assessment models but are
difficult to achieve high levels of accuracy as they are relatively new and as things are so dynamic in real life,
it is hard to model and account for these changes, for example. However, one model used a SC-CO2 of $60/t
and calculated the costs for different types of vehicles and found the following results shown below:
18Figure 6 - SC-CO2 of different vehicle types (Acar, C, 2018).
From the figure it can be seen that conventional vehicles have the highest cost of approximately
$1.28/100km, suggesting they are the most damaging towards the environment, for example. On the other
hand, hydrogen ICE vehicles had the lowest at only $0.38. This is surprising as they still use some
conventional fuels in their operation, however this must be compared to the other options of fuel cells and
electric vehicles which are both fairly expensive and energy–intensive due to their lack of maturity and
development at these early stages.
1.4. H2 Production Routes
Hydrogen can be produced using a number of techniques from any primary energy source and many of these
production techniques are both cheap and mature. The major challenges however lie in the storage and
distribution of the hydrogen, which will be covered later in the report. The most common methods include
production via fossil fuel feedstocks such as gasification, as well as renewable ones like electrolysis using
wind energy. A number of conventional and newer technologies are outlined in this section with their basic
operating principles, with pros and cons respectively.
1.4.2. Reforming and POx
Hydrogen production through SMR is the most popular and mature production route for hydrogen today,
with a low cost compared to other methods available. The largest SMR plant in the UK is based in Teesside
by BOC, making it an attractive area to begin a hydrogen transition. However, as a trade-off to this, SMR is a
damaging process as the upstream extraction and delivery of natural gas leads to carbon dioxide emissions.
For this reason, CCS is becoming a more important aspect to collect the carbon dioxide emitted and reduce
environmental damages, although if net-zero targets are to be achieved, this route is not suitable due to
residual emissions released, for example (CCC, 2018). Here, natural gas (composed of mainly methane) is
obtained from fossil fuels and is reacted with steam under high temperatures of roughly 700-1000°C, which
is generated usually by burning part of the fuel source (to facilitate the endothermic reaction)
(HydrogenEurope, 2019). The reaction also requires a catalyst (usually platinum) to produce a syngas
19composed of hydrogen, carbon monoxide, and minor quantities of carbon dioxide (which can be captured
for storage or use). The CO by-product can then be reacted with excess steam to increase the yield of
hydrogen. This process can achieve efficiencies of between 70-82% (National Grid, 2019). The chemical
reaction steps are outlined below:
CH4 + H2 O → CO + 3H2
CO + H2 O → CO2 + H2
Figure 7 - SMR process flow diagram (HydrogenEurope, 2019).
The final stage of this process involves extracting the hydrogen and is called pressure swing adsorption (PSA),
which is another mature technology available at high capacities, although it does come at an additional cost.
As hydrogen for use in fuel cells has very strict requirements; currently at least 99.999% pure, a rigorous
clean-up stage is required to ensure there are no contaminants in the final product stream (Walker, I, 2018).
So here, the by-products of carbon dioxide and other impurities are removed to give pure hydrogen as a
product. As an alternative stage, membrane-based purifiers or amine based systems could also be used. If
the hydrogen produced was to be used for a different application, heat for example, then these stages may
not be needed.
This reforming process can also be carried out using a different fuel (such as ethanol), which could potentially
give higher efficiencies of hydrogen production compared to SMR due to the re-use of generated heat and
the introduction of an oxygen stream into the reformer (CCC, 2018). In addition to this, using advanced
reformers may also offer higher rates of CO2 capture as the majority of the CO2 released is held at the process
pressure (which is easier to collect), and not at ambient temperatures, compared to SMR.
In a process similar to SMR, partial oxidation (POx) can also be used to produce hydrogen for use in fuel cells.
The difference in this method is that it releases a lot of heat (i.e. is exothermic) as the fuel reacts in a limited
amount of oxygen which is not enough to completely oxidise the hydrocarbons into carbon dioxide and
20water. Instead, the products are the same as SMR: carbon monoxide and hydrogen, with minor traces of
carbon dioxide. From here, the next step is called the water gas shift (WGS) reaction in which the carbon
monoxide gas reacts with water to form carbon dioxide, hydrogen, and heat, shown in the chemical reactions
below:
1
CH4 + O2 → CO + 2H2 + HEAT
2
CO + H2 O → CO2 + H2 + HEAT
This method is also relatively mature compared to others available, and is very fast, however does not give
a hydrogen yield as high as SMR. It still however relies on methane from fossil resources which is not
sustainable, making it a CO2-intensive process, so it has downsides. In order to improve it for the future, it
should be combined with renewable production techniques.
1.4.3. Electrolysis
Hydrogen can also be produced via electrolysis, in which electricity splits water into its constituent atoms of
hydrogen and oxygen respectively. Here, the electrolyser which is used consists of two electrodes (a positive
anode and a negative cathode), attached by an electrolyte which can be made of various materials. The most
common electrolysers however are the solid plastic polymer electrolyte membrane (PEM) and alkaline
electrolyser. These can be relatively small, achieving efficiencies of 70-90% which also makes them well
suited to local, on-site hydrogen production.
Figure 8 - Electrolysis of water to form hydrogen (energy.gov, 2019).
Here, water reacts at the anode, forming oxygen and positively charged hydrogen ions:
2H2 O → O2 + 4H + + 4e−
21From here, the electrons flow through an external circuit whilst positive hydrogen ions move through the
membrane to the negative cathode. At this point, the hydrogen ions react with negative electrons to form
hydrogen, shown below:
4H + + 4e− → 2H2
Other emerging electrolysers that can be used include solid oxide electrolysers. However, other less common
options are not as mature and may have lower performance characteristics.
Electrolysis has a strong potential for hydrogen production for use in vehicles in the future as its purity is
very high (99.999%), but the source of the electricity and its associated cost and efficiency must also be
considered when evaluating its benefits (CCC, 2018). The process will only be classed as net-zero if the
electricity being used is from renewable sources such as wind, nuclear, or solar, for example. If not, the GHG
emissions will be higher and it won’t be considered a sustainable option for fuel cell uptake in the future.
Current grid electricity in the UK is not suitable for hydrogen production as it is not produced sustainably,
with GHG emissions being released at some stages during the process. It is therefore vital to try and
incorporate other power generation systems such as wind farms into hydrogen production, and make
electrolysis more economically viable through improving the efficiency of the conversion process and
reducing costs as much as possible, as high electrolyser capital costs remain a barrier to adoption.
1.4.4. Renewable Liquid Reforming
Renewable liquid fuels derived from biomass resources, such as ethanol can also be reacted with steam,
similarly to SMR, to give hydrogen. As these liquids can be more easily transported compared to the raw
biomass, it means the hydrogen could potentially be produced closer to the point of end use, and
transported more easily to refuelling stations, with only minor infrastructure adaptations required, or simply
reformed on site, for example. In addition to this, the raw biomass feedstocks can also be processed at larger
facilities to take advantages of the economies of scale, saving on costs.
The 3 major stages for reforming biomass-derived liquid fuels is almost identical to SMR:
1. The fuel reacts with high temperature steam in the presence of a catalyst to form a mixture of carbon
monoxide, carbon dioxide, and hydrogen.
2. This carbon monoxide is then reacted with excess steam to produce more carbon dioxide and
hydrogen.
3. The last stage sees the hydrogen stream purified and removed.
Chemicals reactions are similar to SMR; this time with ethanol as the feedstock:
C2 H5 OH + H2 O + HEAT → 2CO + 4H2
22CO + H2 O → CO2 + H2 + HEAT
This production route has a number of advantages including the fact that biomass feedstocks are plentiful
and the transportation of the liquids is relatively simple. There will always be a large resource of biomass
options for use in hydrogen production, and their consumption of carbon dioxide helps to ensure the process
remains low in terms of GHG emissions. If this route is to be used to provide for an increasing demand of
hydrogen for transport however, the reforming efficiency of larger compounds must be improved and the
costs of both the liquids and the equipment must also be reduced.
1.4.5. Fermentation
Hydrogen can be produced through microbial action in which biomass is converted into a sugar-rich
feedstocks which are then anaerobically fermented. Here, microbes break down and digest the organic
matter of the biomass to release hydrogen, and this method could be used for distributed, semi-central, or
central hydrogen production scales respectively.
This organic matter can be in the form of refined sugars and wastewater, for example. In direct fermentation,
microbes break down organics and the by-products can be combined with enzymes to produce hydrogen.
For the future however, work is currently being done on improving the rate at which organics are broken
down and how much hydrogen is produced (i.e. the yield) from the organic matter. Microbial electrolysis
cells (MEC) can be used to capture the energy and protons generated by the microbial action and combined
with an electric current, can produce hydrogen. This technology however is relatively new and immature,
with a number of challenges that must be faced before implementation on the mass market, such as scaling
up systems and increasing fermentation rates, for example.
1.4.6. Photo Electrochemical (PEC) Water Splitting
This is an emerging technology in which water is dissociated into its constituent components of hydrogen
and oxygen using sunlight and cheaper semiconductors surrounded in water-based electrolytes. It could be
a potentially low-carbon route for hydrogen production in the future as it offers high conversion efficiencies
and can produce relatively large quantities of hydrogen. However, as the process is not yet mature, there
are still improvements associated with its efficiency and material costs which could be made.
1.4.7. Photobiological
This production route employs the use of sunlight and microbes to break down water and organic matter
into hydrogen. It is another technology which currently lacks maturity, yet offers good potential for green
hydrogen in the future at a low cost. Its downsides however include low hydrogen production rates and low
conversion efficiencies from solar energy.
23The basic principle when using water involves microbes utilising solar energy to break it down into hydrogen
ions and oxygen. From here, these hydrogen ions can be joined together to form hydrogen gas. However as
oxygen inhibits this stage, and the rate is still slow, challenges are present which must be overcome. In
addition to this, oxygen and hydrogen may present some safety concerns when combined in specific
concentrations, for example (energy.gov, 2019). In order for this route to improve, more research must be
done on improving the rate of breakdown (and hence hydrogen production), and scaling the process up to
support higher demands in the future.
1.4.8. Types of Production Facilities
Hydrogen can be produced in a range of facilities, depending mainly on who the consumer is and where the
hydrogen is going to be used, for example. The production route also has an influence on which facility is
most suitable. The 3 major types are outlined in the table below:
Table 2 - The 3 major hydrogen production facilities (energy.gov, 2019).
Distributed Production: Centralised Production: Semi-Central Production:
Hydrogen is produced in When hydrogen demand This is a mid-range
small local units, close to the increases in the future, larger production facility which is
point of end-use, such as facilities will be needed to relatively close to the point
refuelling stations. keep up. of end-use.
This is a more cost-effective Third-party delivery may be These have a reasonable cost
approach in the early stages beneficial initially when associated and do not require
as hydrogen demand is demands are low. However extensive transportation.
currently very low and transportation of the fuel will They are capable of
transport costs are avoided. be expensive and could lead producing between 5,000-
to additional emissions. 50,000kg/day.
These are capable of
producing 750,000kg/day,
taking advantage of
economies of scale.
This approach is more
expensive compared to
distributed, and requires
additional hydrogen delivery
infrastructure.
As the UK currently has a low hydrogen demand for transport, with fuel cell vehicles considered a rarity and
only a handful of refuelling stations available, it makes sense to produce hydrogen through only distributed
facilities at this early stage. In addition to this, as the infrastructure required to transport this hydrogen is
still not yet available, centralised facilities will be a long way off development. However, there may be
24You can also read