ENERGY IN THE WEST NORDICS AND THE ARCTIC - CASE STUDIES
←
→
Page content transcription
If your browser does not render page correctly, please read the page content below
ENERGY IN
THE WEST NORDICS
AND THE ARCTIC

CASE STUDIES
Energy in the West Nordics and
the Arctic
Case Studies

Jakob Nymann Rud, Morten Hørmann, Vibeke Hammervold, Ragnar
Ásmundsson, Ivo Georgiev, Gillian Dyer, Simon Brøndum Andersen,
Jes Erik Jessen, Pia Kvorning and Meta Reimer Brødsted

TemaNord 2018:539
Energy in the West Nordics and the Arctic
Case Studies
Jakob Nymann Rud, Morten Hørmann, Vibeke Hammervold, Ragnar Ásmundsson, Ivo Georgiev, Gillian Dyer,
Simon Brøndum Andersen, Jes Erik Jessen, Pia Kvorning and Meta Reimer Brødsted

ISBN 978-92-893-5703-6 (PRINT)
ISBN 978-92-893-5704-3 (PDF)
ISBN 978-92-893-5705-0 (EPUB)
http://dx.doi.org/10.6027/TN2018-539

TemaNord 2018:539
ISSN 0908-6692

Standard: PDF/UA-1
ISO 14289-1

© Nordic Council of Ministers 2018
Cover photo: Mats Bjerde

Print: Rosendahls
Printed in Denmark

Disclaimer
This publication was funded by the Nordic Council of Ministers. However, the content does not necessarily
reflect the Nordic Council of Ministers’ views, opinions, attitudes or recommendations.

Rights and permissions

This work is made available under the Creative Commons Attribution 4.0 International license (CC BY 4.0)
https://creativecommons.org/licenses/by/4.0

Translations: If you translate this work, please include the following disclaimer: This translation was not
produced by the Nordic Council of Ministers and should not be construed as official. The Nordic Council of
Ministers cannot be held responsible for the translation or any errors in it.

Adaptations: If you adapt this work, please include the following disclaimer along with the attribution: This
is an adaptation of an original work by the Nordic Council of Ministers. Responsibility for the views and opinions
expressed in the adaptation rests solely with its author(s). The views and opinions in this adaptation have not
been approved by the Nordic Council of Ministers.
Third-party content: The Nordic Council of Ministers does not necessarily own every single part of this work. The Nordic Council of Ministers cannot, therefore, guarantee that the reuse of third-party content does not infringe the copyright of the third party. If you wish to reuse any third-party content, you bear the risks associ ated with any such rights violations. You are responsible for determining whether there is a need to obtain permission for the use of third-party content, and if so, for obtaining the relevant permission from the copy right holder. Examples of third-party content may include, but are not limited to, tables, figures or images. Photo rights (further permission required for reuse): Any queries regarding rights and licences should be addressed to: Nordic Council of Ministers/Publication Unit Ved Stranden 18 DK-1061 Copenhagen K Denmark Phone +45 3396 0200 pub@norden.org Nordic co-operation Nordic co-operation is one of the world’s most extensive forms of regional collaboration, involving Denmark, Finland, Iceland, Norway, Sweden, and the Faroe Islands, Greenland and Åland. Nordic co-operation has firm traditions in politics, economics and culture and plays an important role in European and international forums. The Nordic community strives for a strong Nordic Region in a strong Europe. Nordic co-operation promotes regional interests and values in a global world. The values shared by the Nordic countries help make the region one of the most innovative and competitive in the world. The Nordic Council of Ministers Nordens Hus Ved Stranden 18 DK-1061 Copenhagen K, Denmark Tel.: +45 3396 0200 www.norden.org Download Nordic publications at www.norden.org/nordpub
Contents

Foreword ...................................................................................................................................7
Acknowledgements .................................................................................................................. 9
1. Summary, introduction and background ............................................................................ 11
2. Case 1: Land transport ....................................................................................................... 13
   2.1    Current and upcoming technologies ........................................................................ 13
   2.2    Segmentation and potential for new technology .....................................................21
   2.3    Potential for reductions in carbon emissions........................................................... 22
3. Case 2: Igaliku hybrid system .............................................................................................35
   3.1    Hybrid systems in the Arctic ................................................................................... 36
   3.2    Segmentation and potential for new technology ..................................................... 37
   3.3    Potential for reductions in carbon emissions........................................................... 39
4. Case 3: Electrification of fishing vessels ..............................................................................41
   4.1    Current and upcoming technologies ........................................................................41
   4.2    Categorisation and potential for new technology ................................................... 44
   4.3    Potential for reductions in carbon emissions........................................................... 45
5. Case 4: Tourism ................................................................................................................ 49
   5.1    Tourism development ............................................................................................ 49
   5.2    Carbon emission from the tourism sector ............................................................... 52
   5.3    Tourism as a driver for green transition .................................................................. 58
6. Case 5: De-carbonizing Svalbard ....................................................................................... 61
   6.1    Existing energy consumption in Svalbard ............................................................... 62
   6.2    Catalogue of technical solutions for replacing fossil fuel based energy supply ......... 63
   6.3    Summary ................................................................................................................76
   6.4    Data and Literature .................................................................................................78
Sammenfatning.......................................................................................................................81
   Case study .........................................................................................................................81
   Land transport ...................................................................................................................81
   Igaliku energiforsyning ......................................................................................................81
   Elektrificering af fiskerbåde .............................................................................................. 82
   Turisme ............................................................................................................................ 82
   Det fremtidige energisystem i Svalbard ............................................................................ 82
Foreword

The following report is the result of a study undertaken by COWI on behalf of Nordic
Energy Research, the platform for cooperative energy research and policy development
under the auspices of Nordic Council of Ministers. Nordic Energy Research’s mandate
for creating knowledge to support energy and climate targets in the Nordics applies not
just to the larger countries of the Nordic region, but also the more sparsely populated
areas of the West Artic; Greenland, Iceland, Faroe Islands, Jan Mayen, Svalbard and
Arctic Ocean areas nearby these lands. These areas present unique energy challenges,
as well as unique opportunities. By studying the energy systems in these areas we can
learn how to create a more sustainable, more energy-independent artic region, and
begin to apply the lessons learned from these regions to energy systems elsewhere in
the world.
     We would like to thank all those who have participated in this process.

Hans Jørgen Koch
Director, Nordic Energy Research

                                       Energy in the West Nordics and the Arctic     7
Acknowledgements
Energy in the West Nordics and the Artic (EVA) is a collaborative project between COWI
and Nordic Energy Research – an intergovernmental organisation under the Nordic
Council of Ministers.
Nordic Energy Research was the coordinator of the project.
Jakob Nymann Rud at COWI was the project manager and had overall responsibility for
the design and implementation of the study.
Nordic Energy Research team
Hilde Marit Kvile, Kevin Johnsen and Marie Kjellén.
COWI team
Jakob Nymann Rud, Morten Hørmann, Vibeke Hammervold, Ragnar Ásmundsson
(HeatRD), Ivo Georgiev, Gillian Dyer, Simon Brøndum Andersen, Jes Erik Jessen, Pia
Kvorning, Meta Reimer Brødsted.
Steering group
The work was guided by the Steering group, consisting of:
Erla Björk Þorgeirsdóttir (Iceland), Rune Volla (Norway), Meinhard Eliasen (Faroe
Islands), Peter Njenga Githii et al (Greenland).
The individuals and organisations that contributed to this study are not responsible for
any opinions or judgements contained in this study.
Energy in the West Nordics and the Arctic 9Contact Comments and questions are welcome and should be addressed to: Kevin Johnsen Nordic Energy Research E-mail: kevin.johnsen@nordicenergy.org Jakob Nymann Rud COWI E-mail: jaru@cowi.com For enquiries regarding the presentation of results or distribution of the report, contact Nordic Energy Research. Additional materials, press coverage, presentations etc. can be found at www.nordicenergy.org 10 Energy in the West Nordics and the Arctic
1. Summary, introduction and
background
This report is a sub report of the project Energy in the West Nordic areas and the Arctic
– EVA. The purpose of the projects is to look at the energy situation and the local
challenges in the five areas Iceland, Greenland, Faroe Islands, Svalbard and Jan Mayen.
Some of the data for the main project (energy situation, energy demand and scenario
analysis) will be referred to in this report. The purpose of this report is to develop case
studies of five selected challenges which is relevant for the five areas. These are:
Land transport
Igaliku hybrid system
Electrification of fishing vessels
Tourism
De-carbonizing Svalbard
The conversion to a sustainable land transportation sector is not an issue for the
West Nordic and Arctic areas specifically. However, these specific areas do have a
lot of renewable energy potential in wind and hydro power technologies and a
transition to electrified (or hydrogen) transportation sector could be an important
part of this system.
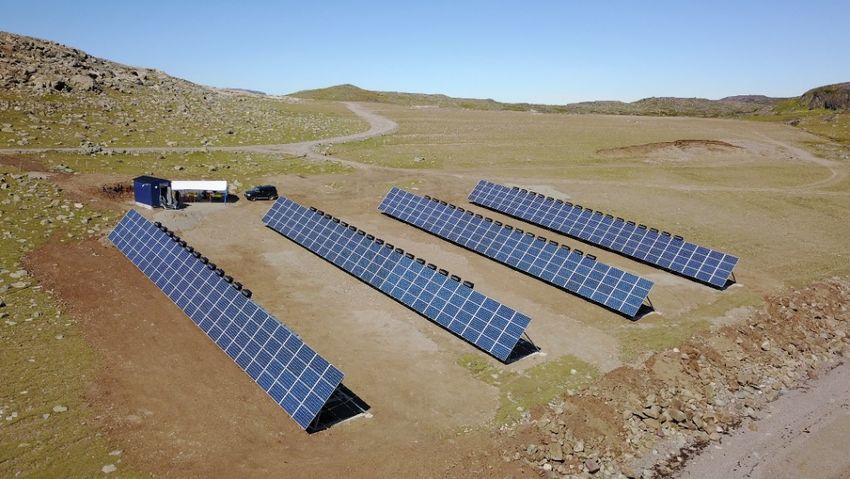
In Greenland most of the villages are not connected to a common power grid. This
calls for more tailored smart energy system solutions. In Igaliku in Greenland,
Nukissiorfiit supplies energy to the village town from multiple renewable energy
system technologies. This system could be used in many other locations in Greenland.
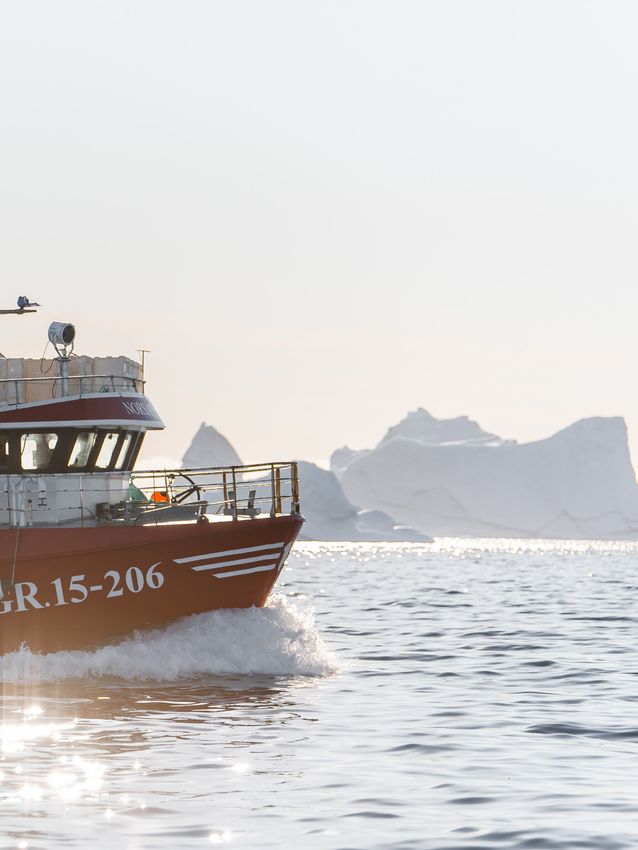
One of the largest contributors to carbon emissions in the West Nordic and Arctic
areas is the fishing industry. The use of renewable energy in the fishing industry
(vessels) is not very common. However, electric vessels (batteries or hydrogen fuel
cells) could very well be the future in this area.
The West Nordic and Arctic areas are very popular for tourists. This sector is
important for the local economies but also challenging with regards to the energy
consumption for these areas.
Within the next ten years the local coal mine at Svalbard is expected to be closed.
With this the backbone of the energy system at Svalbard – the coal fired power plant –
will be shut down. This calls for a more comprehensive reconstruction of the energy
system but also opens up the possibility for the implementation of renewable energy
systems.
These topics will all be presented and discussed in this report.
Energy in the West Nordics and the Arctic 112. Case 1: Land transport
Reducing carbon emissions from land transport is a challenge anywhere in the world,
but more so in the Arctic. Freezing temperatures limit the effectiveness of batteries.
Rough terrain and lack of infrastructure increase the dependence on off-road vehicles
– a class of vehicle that has typically seen very little attention from hybrid and electric
technology developers.
An interesting aspect in the Arctic is the relatively short ranges that land
transportation needs to cover, except in Iceland.
In some of more secluded areas distances can be significantly greater than the
expected range of electric vehicles. For Greenland this would concern most areas.
However, land transportation is rarely used at all outside the major towns of Greenland.
Iceland is a large island with a well-developed road system, so the possible travel
distances are long. However, as Reykjavík and the surrounding areas in the southwest
of the country are home to over two-thirds of the population, long distances should not
be a major problem in relation to everyday use of electric vehicles. The more stable and
milder (temperature wise) climate of Iceland and Faroe Islands, compared to the four
other regions, will also to some degree limit the challenges with freezing temperatures.
2.1 Current and upcoming technologies
To overcome the above-mentioned challenges in the efforts to reduce carbon
emissions from land transport, a first step could be to identify and gain insight into
current and upcoming technologies that have the potential to be practical under artic
conditions.
2.1.1 Climate hardened batteries and electronics
Intense efforts are being made in developing new and more efficient battery technology,
especially in terms of the ability to store more energy per unit volume, as well as lowering
the battery cost per energy unit (improvement of the performance-to-cost ratio). In
addition, other efforts to increase the performance of new battery technology are being
made, hereunder the development of batteries with the ability to operate at very low
temperatures – with still quite satisfying performance.
One apparently promising development in this area was recently made by
engineers at the University of California, San Diego. They claim to have developed a
breakthrough in electrolyte chemistry that enables lithium batteries to run at
Energy in the West Nordics and the Arctic 13temperatures as low as -60 °C, with excellent performance. The new electrolytes also
enable electrochemical capacitors to run as low as -80 °C.1
While the technology enables extreme low temperature operation, high
performance at room temperature is still maintained. The new electrolyte chemistry
could also increase the energy density and improve the safety of lithium batteries and
electrochemical capacitors.2
The batteries and electrochemical capacitors that were developed are especially
cold-hardy because their electrolytes are made from liquefied gas solvents — gases that
are liquefied under moderate pressures — which are more resistant to freezing than
standard liquid electrolytes.3
However, the technology is not yet mature enough for commercialisation. Thus
one of the researchers behind the technology is leading a UC San Diego-based team
working to bring it to market via a start-up (called South 8 Technologies).
Another promising development, initially made at Norwegian University of Science
and Technology, is now licensed and being further developed by the Norwegian
company Graphene Batteries AS. The company is working on a solution that will enable
lithium-ion based batteries to run at temperatures down to -50 °C. Other than this,
these batteries will have general properties like common standard lithium-ion based
batteries.4
The challenge that has been solved, is the development of a special membrane, or
rather coating of the usual graphite anode, that allows the use of a special electrolyte
with much broader temperature range than usual – an electrolyte that would otherwise
deteriorate the anode in absence of the coating/membrane.
Thus, the above mentioned membrane technology is still being developed and is
not yet mature for commercialisation. According to the company Graphene Batteries
AS, the next step will be the development of a prototype that could attract attention
from potential commercial partners that could be interested in production of such
batteries with the special membrane technology, based on a license.
2.1.2 Hydrogen fuel cells for vehicles
Until recently, cold-weather performance of fuel cells has been prohibitive for their use
in cold climates.
A fuel cell basically converts hydrogen into electricity through an electrochemical
reaction, with water as a by-product – and the fuel cell membranes can be damaged if
water in the cells turns to ice, i.e. under subfreezing temperatures. If ice forms, it can
1 http://ucsdnews.ucsd.edu/pressrelease/electrolytes_made_from_liquefied_gas_enable_batteries_to_run_at_ultra_low
2 The future aim of the researchers is to further improve the energy density and cyclability of both batteries and
electrochemical capacitors, and to run them at even lower temperatures.
3 In addition to their exceptional low temperature performance, these electrolytes apparently mitigate a problem called
thermal runaway, which is when the battery gets hot enough to set off a dangerous chain of chemical reactions that in turn
heat up the battery even further. With these new electrolytes, the battery will be unable to self-heat at temperatures much
higher than room temperature.
4 https://www.tu.no/artikler/denne-norske-teknologien-kan-gi-elbilbatterier-som-ikke-far-mindre-kapasitet-i-
kulda/408421?utm_source=newsletter-2017-10-03&utm_medium=email&utm_campaign=newsletter
14 Energy in the West Nordics and the Arcticreduce the fuel cell performance, damage the cell components, and lead to cold start
failure.5
However, in recent years, many efforts have been directed at addressing and
overcoming the problem with cold start and cold-weather performance of fuel cells.
Example – Toyota fuel cell vehicles have proven fully capable of operating under
cold-weather conditions:6
The company Proton OnSite, has 10 Toyota fuel cell hybrid vehicles and operates
a hydrogen station for the vehicles and a bus from a nearby community. Even with
temperatures as low as –16 °C, the cars are reported to start up with no issues and
the fuelling stations are running without any problems. The vehicles can be
fuelled in just a few minutes and can get a range of up to just below 500 km, even
in cold weather;
Also according to Toyota, the Toyota fuel cell vehicles have logged millions of
miles in some extreme climates, e.g. where temperatures reach -30 °C. Fuel cell
engineers spent long periods of testing vehicles under such conditions, verifying
cold weather start up, performance and durability.
Thus, most technological challenges seem to have been overcome.
However, there are still other challenges to overcome in the dissemination of fuel
cell vehicles, such as the current prices of producing hydrogen for fuel cells, and not
least the setting up of a sufficient infrastructure network of hydrogen filling stations.
2.1.3 Off-road vehicles and snowmobiles
Electric off-road vehicles
There are several off-road plug-in hybrid electric vehicles available on the market
already.
These vehicles combine the use of one or more electric motors and a petrol or diesel
engine that is also able to function as a generator. They can be used in combined mode
or all-electric mode alone.
Among those more common off-road plug-in hybrid electric vehicles already on the
market are the Mitsubishi Outlander PHEV, the Volvo XC90 T8 PHEV and the Audi Q7
e-tron quattro PHEV.7 They offer all-electric ranges from approximately 40 up to 55 km
– in many cases probably enough for daily use.
5 See e.g. “A Comprehensive Review of Solutions and Strategies for Cold Start of Automotive Proton Exchange Membrane
Fuel Cells”, Amanou et al, IEEE Volume 4, 2016.
6 https://www.autoblog.com/2014/02/06/toyota-says-freezing-temps-pose-zero-problems-for-fuel-cell-vehi/,
http://www.hybridcars.com/toyotas-fuel-cell-vehicles-can-handle-the-cold/
7 Other examples of vehicles in the class that are on the market are: Kia Niro, Lexus RX450h, Toyota RAV4 Hybrid, Range
Rover Sport Hybrid, Mercedes GLE500e, Lexus NX300h and BMW X5 xDrive40e.
Energy in the West Nordics and the Arctic 15Also regarding electric off-road vehicles, the W15, a so-called electric range-
extended plug-in pick-up truck is under development by the company Workhorse,8 a
company focusing on the market for so-called tools of the trade.9 The vehicle offers an
impressive all-electric range of up to approximately 130 km.
The world’s first all-electric all-wheel drive off-road sport utility truck, called B1, is
claimed to have been developed by the New York-based start-up company Bollinger
Motors.10 The vehicle is stated to be equipped with two options for battery packs,
providing ranges of either up to 195 km or around 320 km.
In addition to the above-mentioned developments, Ford has decided to redeploy a
significant amount of its development capital from internal-combustion engines to
investments in electrification – including the setting up of a dedicated electrification
team. Thus, Ford plans to deliver 13 new electrified vehicles in the next five years,
including F-150 and Mustang hybrids, a Transit Custom plug-in hybrid, and a fully
electric small SUV.11
See Table 1 below for a summary of more technical specifications of the above-
mentioned off-road vehicles.
Table 1: Summary of technical specifications – electric off-road vehicles
Brand/Model Type Battery pack [kWh] Power train [hp] Charging [hours ] Market state Practical
(range up to [km]) Fast-charging [min.] experience
Mitsubishi Plug-in hybrid 12 (52) 164 electric (combined 3.5 – 13 hrs. On market Marketed for
Outlander PHEV with 121 gasoline) 25 min. some years –
popular in
Norway
Volvo XC90 T8 Plug-in hybrid 10.4 (40) 87 electric (combined ~ 2.5 hrs. On market
PHEV with 320 gasoline) n/a
Audi Q7 e-tron Plug-in hybrid 17.3 (56) 126 electric (combined 2.5 – 8 hrs. On market
quattro PHEV with 258 diesel) n/a
Workhorse W15 Plug-in hybrid 60 (130) 460 n/a Prototype –
(range-extended) targeted for
production 2018
Bollinger B1 All-electric 60 / 100 (195 / 320) 360 7 / 12 hrs. Prototype (seeking
45 / 75 min. manufacturing
partner)
8 Where a gasoline engine – unusually – will function only as a generator to feed the electric drive-train/motors.
9 Carrying supplies for construction or utility projects, for instance, or getting workers and their tools from one job site to
the next.
10 http://www.roadandtrack.com/new-cars/car-technology/a10375356/this-electric-truck-is-the-future-of-off-roading/,
http://bollingermotors.com/
11 http://www.roadandtrack.com/new-cars/future-cars/a12844641/expect-more-off-road-and-electrified-vehicles-from-
ford/
16 Energy in the West Nordics and the ArcticElectric snowmobile
The Canadian start-up company Taiga Motors has developed an all-electric
snowmobile.
The company claims that its snowmobile is capable of running at 95% capacity at
temperatures as cold as -40 °C. The snowmobile has a claimed range of up to 100 km
and a capability to accelerate from 0 to 100 km/h in approximately 3 seconds.
Recharging the battery can apparently be done in as little as 50 minutes, thanks to a
“rapid recharge” capability. The stated weight is approximately 230 kg.12
Two Canadian adventure tour companies have initially tested a prototype of the
electric snowmobile this past winter, and a larger-scale test of up to 10 electric
snowmobiles will be undertaken this coming winter – primarily at ski resorts though,
where the area to cover is relatively limited and charging can be arranged at existing
facilities.13
2.1.4 Buses and Lorries
Electric or fuel cell powered buses
Several companies have introduced busses, primarily suited for bus transport in urban
areas where distances are short to moderate.
One of these companies is the Finnish company Linkker.14 They have constructed the
Linkker 12+, a fast-charging electric bus, in which batteries are charged at end stops while
passengers board (not only charged at depots overnight) – where the batteries only need
about 1.5–3 minutes to charge.
Due to the fast-charging system, the batteries of the buses are smaller in size, so the
buses are lighter and thus, the weight does not limit passenger capacity. In addition, the
buses have a full-aluminium body so they are light compared to buses made from steel.
The busses have a maximum capacity of up to 80 passengers, with a typical
configuration of 38 seats and up to 42 standing rooms.
The buses are claimed to be highly energy-efficient using only 1.05 kWh per kilometre
(compared to over 3 kWh per kilometre for traditional diesel buses).
The typical range amounts to a daily mileage of more than 300 km – 1 full charge gives
a range of 30–50 km, while every 2 minutes of fast-charging gives a range of
approximately 10 km. Fast-charging is done using a roof connected pantograph, while full
changing overnight is done using a traditional plug in connection.
According to the Linkker company, buses are claimed to be engineered for operation
in cold (as well as hot) climate conditions, hereunder operation below -25 °C. They are
equipped with energy efficient auxiliaries, to deal with heavy snowfall, and have insulated
and double-glazed bodies providing stable operation in harsh climatic conditions.
12 http://cs.amsnow.com/sno/b/news/archive/2017/04/21/electric-snowmobile-here-to-stay.aspx
13 https://electrek.co/2017/04/18/all-electric-snowmobiles-taiga-motors/
14 http://www.linkkerbus.com/technology/
Energy in the West Nordics and the Arctic 17These Linkker buses service one central bus line in Turku, Finland – 12.4 km in
length – and another bus line in Espoo, Finland – 19.2 km in length – with an average
energy consumption around 0.9 kWh/km. The buses are also operating on one bus line
in a pilot test project in Copenhagen, Denmark, and on two bus lines in Helsinki,
Finland. Recently the buses were introduced for field tests to gain experience on one
route in Berlin, Germany, and on a number of inner city routes in Moscow, Russia.15
The Swedish car, lorry and bus manufacturer Volvo has also developed a full-
electric bus, the Volvo 7900 electric citybus.16 This bus uses similar technological
principles, where fast-charging or opportunity charging and a lightweight aluminium
body means that a smaller and lighter battery pack can be used, resulting in higher
passenger capacity, and increasing both range and operational hours.
The passenger capacity is reported to be up to a maximum of 105 passengers,
though with a maximum number of 34 seats.
The energy efficiency of the electric buses is stated to be heavily dependent on the
driving pattern at the specific route, terrain/topography and loads, but would be
approximately in the order of 1.2 kWh/km (relatively flat terrain) to 1.4 kWh/km.17
Buses are primarily sold as part of a complete “electrification” project of e.g. a
specific route, thus including a number of buses and the necessary opportunity charging
infrastructure (at strategically selected stops) etc. Thus, prices will depend on a number
of factors. However, an approximate price for one bus is purported to be in the order of
EUR 505,000 to EUR 533,000, while an approximate price for one fast-charging facility
is claimed to be in the order of EUR 200,000.18
Since 2015, the buses have been operated on one bus line as part of the ElectriCity
pilot project in Gothenburg, Sweden, that was recently expanded. According to Volvo
Buses, these fully electric buses have also been ordered for operation in the cities
Malmö (Sweden), Differdange (Luxemburg), and Harrogate (UK). Recently an order has
been placed for 25 fully electric Volvo 7900 Electric buses for operation in the city of
Trondheim, Norway, starting in August 2019.19
The Volvo 7900 is also manufactured in two different hybrid bus versions.
Following another technological line, Toyota has unveiled a fuel cell bus concept,
that the company plans to introduce in over 100 fully functioning units to operate within
the Tokyo metropolitan area before the Tokyo 2020 Olympic and Paralympic Games.
The bus should be able to carry 78 passengers (22 seated, 56 standing) plus the
driver.20
See Table 2 below for a summary of more technical specifications of the above-
mentioned buses.
15 http://www.linkkerbus.com/updates/
16 http://www.volvobuses.co.uk/en-gb/our-offering/buses/volvo-7900-electric.html
17 Personal communication, Jan Bredo, Volvo Bus Denmark.
18 Personal communication, Jan Bredo, Volvo Bus Denmark.
19 http://www.volvobuses.com/en-en/news/2017/sep/Volvo-receives-largest-ever-order-of-fully-electric-buses-for-
trondheim.html
20 http://newsroom.toyota.co.jp/en/detail/15160167 , https://newatlas.com/toyota-sora-fuel-cell-bus-tokyo/51825/ ,
https://paultan.org/2017/10/20/toyota-sora-fuel-cell-bus-concept-with-200-km-range/
18 Energy in the West Nordics and the ArcticTable 2: Summary of technical specifications – electric and fuel cell buses
Brand/Model Type Battery Power Charging Market state Practical experience
pack/energy train [hp] [hours]
content [kWh] Fast-charging
(range up to [km]) [min.]
Linkker 12+ bus All- 55 / 63.5 240 6–8 hrs.1 On market Operates on selected
electric (30–50)3 1.5–3 min.2 bus lines in more cities.
Pilot testing and/or field
testing in several other
cities
Volvo 7900 All- 764 215 n/a On market Operated on pilot
electric citybus electric 3–6 min.2 project for several years.
Ordered for operation in
a number of cities
Toyota Sora Fuel cell 2355 2 x 152 n/a Prototype To be introduced in over
fuel cell bus (200) 10 min.6 100 fully functioning
units
1
Note: Full charge overnight at depots.
2
Opportunity-charging at selected stops.
3
One full charge.
4
A 250 kWh battery pack to be introduced in 2019.
5
Fuel tank energy storage capacity.
6
Refuelling of tanks.
Electric or fuel cell powered lorries/trucks
One of the first fully electric trucks has been presented by Mercedes-Benz, the so-called
Urban eTruck21 – primarily suited for distribution. Recently, it was decided to bring the
all-electric heavy-duty truck to market in a small series for delivery this year, to further
optimise the vehicle concept and the system configurations of the electric truck
through actual application scenarios.22
Previously, Mercedes-Benz introduced the Fuso Canter E-Cell, now called the Fuso
eCanter, a fully electric-powered small/light truck.23 Since April 2016, the German city
of Stuttgart and the parcel service provider Hermes have been testing five FUSO Canter
E-Cells. Stuttgart is a very topographically demanding urban environment, and these
tests should provide important insights to help the further development of the fully
electric drive in the Fuso eCanter.
Similar all-electric small and medium duty trucks have been introduced by the
Australian manufacturer SEA Electric – the SEA EV10 and the SEA EV14.24
Recently, Daimler unveiled a new all-electric heavy-duty concept truck called the
E-FUSO Vision ONE.25
21 https://www.daimler.com/products/trucks/mercedes-benz/world-premiere-mercedes-benz-electric-truck.html
22 https://www.mercedes-benz.com/en/mercedes-benz/next/e-mobility/e-truck-rolls-in-series/
23 https://www.daimler.com/products/trucks/fuso/ecanter.html
24http://www.sea-electric.com/ev-10/, http://www.sea-electric.com/ev-14/
25https://electrek.co/2017/10/25/daimler-heavy-duty-electric-truck-concept/,
https://www.daimler.com/innovation/case/electric/efuso-2.html
Energy in the West Nordics and the Arctic 19Also very recently, Tesla unveiled its Class 8 electric truck. Although not many
details about the exact technical specifications have been revealed yet.
Based on fuel cell technology Toyota has developed a heavy-duty truck (so-called
class 8 truck). A concept version of the truck is running short-haul routes at the Port of
Los Angeles as part of a feasibility study.26
And the American start-up company Nikola Motor Co. has announced plans to
begin field tests of its hydrogen fuel cell heavy truck next fall. Full production is
expected to start in 2021.27
See Table 3 below for a summary of more technical specifications of the above-
mentioned trucks.
Table 3: Summary of technical specifications – electric and fuel cell trucks
Brand/Model Type Battery Power train Charging [hours] Market state Practical experience
pack/energy [hp] Fast-charging [min.]
content [kWh]
(range up to [km])
Mercedes-Benz Urban All-electric 212 n/a 3 hrs.1 To be introduced in To be further optimised
eTruck (heavy-duty) (200) small series through actual application
scenarios
Mercedes-Benz Fuso All-electric 70 n/a 7 hrs. First trucks delivered Testing under actual
eCanter (light) (100) 60 min. application scenarios
SEA Electric, SEA All-electric 120 n/a 6 hrs. First trucks delivered
EV10 (light) (180)
SEA Electric, SEA All-electric 140 n/a 6–7 hrs. First trucks delivered
EV14 (medium) (180)
Daimler E-FUSO All-electric 300 n/a n/a Prototype – Market
Vision ONE (heavy- (350) entry within 4 years
duty)
Tesla Semi (heavy- All-electric n/a n/a n/a Expected in production More than 200 vehicles pre-
duty) (800) 80% of capacity by 2019 ordered by e.g. UPS and
within 30 min.2 PepsiCo
Toyota fuel cell truck Fuel cell n/a 675 30 min. Concept version Running short-haul routes
(heavy-duty) (385) at the Port of Los Angeles as
part of a feasibility study
Nikola One (heavy- Fuel cell n/a 1,000 15 min. Prototype – production Field tests planned from fall
duty) (1,300 – 1,900) expected from 2021 2018
1
Note: With special fast-charger.
2
With a special so-called “mega-charger”.
26 https://www.trucks.com/2017/04/19/toyota-project-portal-fuel-cell-truck-technology/,
https://www.theverge.com/2017/10/12/16461412/toyota-hydrogen-fuel-cell-truck-port-la
27 https://www.trucks.com/2017/11/09/nikola-fuel-cell-truck-field-test-2018/, https://arstechnica.com/cars/2017/09/nikola-
motor-company-and-bosch-team-up-on-long-haul-fuel-cell-truck/, https://nikolamotor.com/one
20 Energy in the West Nordics and the Arctic2.2 Segmentation and potential for new technology
2.2.1 Segmentation
Primarily based on data from official statistical bureaus of the Arctic regions under
consideration, we find the fleet of land/road transport vehicles reported below in Table 4.
Table 4: Number of vehicles according to vehicle type, 2016
Vehicle type Iceland Faroe Islands Greenland Svalbard Jan Mayen
Cars 240,490 22,293 4,375 754 11
Buses 2,862 211 76 0 0
Vans 24,508 3,685 993 0 0
Trucks/lorries 11,064 562 322 0 2
Snowmobiles 5,255 0 1,179 1,355 3
ATV & 4-whl.1 19,140 2,546 209 0 0
Total 303,319 29,297 7,154 2,109 16
1
Note: Including motorcycles and mopeds.
2
2014 data.
As in most other countries cars are the dominating vehicle type. In Iceland and the Faroe
Islands and to some degree Greenland there are also a significant number of vans. In
Iceland there are a relatively high number of trucks/lorries and buses.
Snowmobiles seem to play an important role in Greenland and Svalbard and to
some extent in Iceland. In Iceland, as well as the Faroe Islands, ATVs (including
motorcycles) seem to be of some importance.28
The overall energy consumption from land/road transport is reported below in
Table 5, based on data gathered in the main project. As can be seen from the table, we
have not been able to obtain or estimate data for Jan Mayen on the consumption of
energy specifically for land transport.
Table 5: Estimated energy consumption for land transport, 2016
[PJ] Iceland Faroe Islands Greenland Svalbard Jan Mayen
Diesel oil DSL 5.4340 0.8300 0.2500 0.0105 NA
Motor spirit GSL 5.6960 0.4500 0.2750 0.0637 NA
Biogas BGS 0.1090 0.0000 0.0000 0.0000 NA
28It should be noted that the category ATV and 4-wheeler does include a large number of motorcycles (app. 50%) and
some mopeds.
Energy in the West Nordics and the Arctic 21As the table shows, the absolutely dominating fuels are diesel oil and motor spirit. Only
in Iceland does there seem to be a minor use of biogas for land/road transport.
Potential for new technology
Based on the previous examination of the current state of technological development
regarding climate hardened batteries and fuel cells as well as electric or fuel cell based
vehicles, it appears that such technologies and vehicle types are developing rapidly.
Thus, we will assume that technologies/vehicles will be further developed and
matured for market entry, within a reasonable time horizon. Nevertheless, although
costs are assumed to decline as technologies are developing, our data sources indicate
that cost levels will still be above cost levels of conventional technologies.
Following a general segmentation of vehicles in the relevant regions under
consideration, and an estimation of the overall energy consumption for land/road
transport, we will estimate the potential for carbon emissions reductions and the
associated extra socio-economic costs.
This estimate will be based on the assumption that it will be possible to replace the
entire fleet of conventional land/road transport vehicles in all the relevant Arctic
regions, with emissions-free land/road transport vehicles based on electric or fuel cell
technology.
2.3 Potential for reductions in carbon emissions
Based on the above assumption, we could estimate the potential for reductions in
carbon emissions from conventional land/road transport as the carbon emissions from
the overall fossil based energy consumption for land/road transport.
However, we estimate the potential for reductions in carbon emissions from
conventional land/road transport according to type of vehicle and fuel used.
2.3.1 Methodology for estimation of reduction potential and associated costs
Thus, based on the segmentation of numbers and overall types of vehicles in each
of the relevant regions, we estimate the number of vehicles according to type of
vehicle and type of fuel. It has only been possible to obtain small amounts of data
on the exact distribution of certain vehicle types according to fuel. Thus, our
estimation is to some extent based on rough assumptions on the distribution of
specific conventional vehicles according to fuel; e.g. assumptions that buses and
lorries/trucks are running on diesel only, and that snowmobiles are running on
gasoline/motor spirit only.
Thus, having estimated the number of vehicles according to type of vehicle and
type of fuel, we calculate a “bottom-up” approximation of the total energy
consumption of land/road transport vehicles according to vehicle type and type of
fuel. The calculation will be based on standard assumptions on the annual driven
22 Energy in the West Nordics and the Arcticdistance for each type of vehicle, as well as data on the specific energy consumption
for standard vehicles of the relevant type.29
This bottom-up calculated energy consumption is then used as a key to relatively
distribute the actual overall energy consumption for land/road transport according to
vehicle type and type of fuel.
Based on standard emission factors for the relevant types of conventional fuels
used for land/road transport we then estimate the actual carbon emissions from
land/road transport according to vehicle type and type of fuel. These actual carbon
emissions also represent the emissions reduction potential, based on the initially
mentioned assumption that it will be possible to replace the entire fleet of conventional
land/road transport vehicles in all the relevant Arctic regions with emissions-free
land/road transport vehicles based on electric or fuel cell technology.
A similar approach is then used for calculating the projected energy consumption
and carbon emissions/reduction potential in 2020 and 2035, taking the projected
development in energy efficiency of conventional standard vehicles into account
(keeping number and distribution of vehicles as well as assumed annual driven distance
constant).
Finally, we will try to estimate the annual extra socio-economic costs associated
with a total replacement of the entire fleet of conventional land/road transport vehicles
in the relevant Arctic regions with emissions-free road transport vehicles based on
electric or fuel cell technology:
First, we estimate the total annual socio-economic costs (including fuels) of operating
the current fleet of conventional land/road transport vehicles in each of the relevant
Arctic regions. The estimate is based on annualized expected/projected costs of
standard conventional vehicles according to each relevant type of vehicle and fuel
type as well as expected/projected costs of relevant fuels;
Second, we similarly estimate the total annual socio-economic costs (including
fuels) of operating a corresponding fleet of emissions-free land/road transport
vehicles based on electric or fuel cell technology in each of the relevant Arctic
regions. We base this estimate on an assumption that the majority of
conventional vehicles will be replaced with electric vehicles, although some
conventional vehicles are replaced with fuel cell vehicles better suited for longer
distances. Further, we base the estimate on annualized expected costs of
emissions-free land/road transport based on electric or fuel cell technology
according to relevant types of vehicles and fuels, taking into account projected
development of such vehicle costs and fuel costs. These expected vehicle costs
are adjusted by assumed additional costs of climate-hardened technologies;
29 As we have not been able to obtain specific data on e.g. annual average distances driven these are the best available
data. And as the bottom up calculated energy consumption based on these data does, in most cases, reasonably fit
the actual estimated energy consumption, we find it a fair approximation. Further, as the bottom up calculated energy
consumption is used as a key for distribution of the actual estimated energy consumption, the absolute numbers are of less
importance than the relative numbers.
Energy in the West Nordics and the Arctic 23 Third, the extra annual socio-economic costs associated with a total replacement
of the entire fleet of conventional land/road transport vehicles with emissions-free
land/road transport vehicles based on electric or fuel cell technology, is estimated
as the difference between the two abovementioned cost estimates.
2.3.2 Iceland
Regarding Iceland, we have obtained data on the number of cars and vans and divided
them according to diesel, gasoline and other fuels. Thus, based on the overall
segmentation of conventional vehicles according to vehicle type we estimate the
number of land/road transport vehicles according to vehicle type and type of fuel as
shown below in Table 6.
Table 6: Number of vehicles according to vehicle type and fuel, Iceland
Vehicle type Diesel oil Motor spirit Biogas Total
DSL GSL BGS
Cars 67,337 170,748 2,405 240,490
Buses 2,862 0 0 2,862
Vans 17,401 7,107 0 24,508
Trucks/lorries 11,064 0 0 11,064
Snowmobiles 0 5,255 0 5,255
ATV & 4-whl. 0 19,140 0 19,140
Total 98,664 202,250 2,405 303,319
Energy consumption and related emissions
Based on the above outlined methodology we then estimate the current and
projected energy consumption by land/road transport according to vehicle type and
type of fuel in Iceland shown below in Table 7.
Table 7: Current and projected energy consumption by land transport [TJ], Iceland
2016 2020 2035
[TJ]
DSL GSL BGS Total DSL GSL BGS Total DSL GSL BGS Total
Cars 1,470 5,173 109 6,752 1,425 4,698 100 6,223 1,261 4,176 88 5,525
Buses 798 0 0 798 742 0 0 742 632 0 0 632
Vans 600 392 0 993 577 351 0 927 511 310 0 821
Trucks/lorries 2,566 0 0 2,566 2,371 0 0 2,371 2,054 0 0 2,054
Snowmobiles 0 38 0 38 0 34 0 34 0 30 0 30
ATV & 4-whl. 0 93 0 93 0 85 0 85 0 75 0 75
Total 5,434 5,696 109 11,239 5,115 5,168 100 10,383 4,457 4,592 88 9,137
As can be seen from the table, more than half of the energy consumed by land/road
transport vehicles in 2016 is estimated to be consumed by cars, followed by
trucks/lorries consuming almost one-fourth of the energy consumed by land/road
transport vehicles in 2016. Further, it is seen that energy consumption by conventional
24 Energy in the West Nordics and the Arcticvehicles is projected to decline from approximately 11.2 PJ in 2016 to 10.4 PJ in 2020
and 9.1 PJ in 2035.
Today, there is a small proportion of cars being powered by biogas. Over time this
consumption is expected to fall due to two factors. The energy efficiency of gas
powered cars is expected to increase slightly, and the price of electric vehicles is
expected to fall more than gas powered vehicles.
The associated projected carbon-emissions will decline from approximately 755
thousand tonnes CO₂ in 2020 to approximately 664 thousand tonnes CO₂ in 2035, as
shown below in Table 8.
Table 8: Projected CO₂-Emissions by land transport [th. tonnes CO₂], Iceland
2020 2035
[th. ton. CO2]
DSL GSL BGS Total DSL GSL BGS Total
Cars 105 342 0 447 93 304 0 397
Buses 55 0 0 55 47 0 0 47
Vans 43 26 0 68 38 23 0 60
Trucks/lorries 175 0 0 175 152 0 0 152
Snowmobiles 0 2 0 2 0 2 0 2
ATV & 4-whl. 0 6 0 6 0 5 0 5
Total 379 376 0 755 330 334 0 664
The above-mentioned projected CO₂ emissions also represent the emissions reduction
potential from conventional land/road transport in Iceland, assuming that emissions-
free vehicles can replace the entire fleet of conventional vehicles.
Estimated costs of obtaining emissions reduction potential
Estimates of the associated costs of obtaining the above-mentioned emissions
reduction potential are reported below in Table 9.
Table 9: Projected total yearly vehicle costs incl. fuels [m. EUR], Iceland
2020 2035
[m. EUR]
Conv. Altern. Diff. Conv. Altern. Diff.
Cars 758 942 184 771 756 -15
Buses 161 293 132 163 202 39
Vans 95 116 21 97 93 -4
Trucks/lorries 589 599 9 594 446 -148
Snowmobiles 9 14 5 9 11 2
ATV & 4-whl. 35 51 16 36 40 5
Total 1,648 2,015 367 1,670 1,548 -122
Note: Abbreviations: Conv. = Projected total yearly vehicle costs incl. fuels [m. EUR], Iceland.
Altern. = Alternative fuel vehicles.
Diff. = Difference between conventional and alternative fuel vehicles.
Energy in the West Nordics and the Arctic 25Based on expected costs and cost development it appears that annual extra costs
associated with replacement of the entire fleet of conventional vehicles with emissions-
free vehicles in Iceland would amount to almost EUR 370 million in 2020, corresponding
to a CO₂ reduction cost of EUR 487 per tonnes CO₂.
Very remarkable though is that in 2035 there will apparently not be any extra costs
associated with replacement of vehicles but rather a socio-economic gain amounting
to approximately EUR 120 million, corresponding to a CO₂ reduction cost of EUR -184
per tonnes CO₂. It is mainly trucks and lorries that cause this socio-economic gain.
This reflects – as shown by the above Table 9 – that annual costs of conventional
vehicles are projected to increase slightly over the period of 2020 to 2035, primarily
caused by a projected increase in prices of conventional fuels. At the same time,
assumed rapid technological development of emissions-free vehicles will mean
significantly decreasing vehicle costs (in combination with quite low electricity prices,
and thus hydrogen, in Iceland in particular).
2.3.3 The Faroe Islands
Based on the overall segmentation of conventional vehicles according to vehicle type,
and assumptions regarding the distribution of vehicles according to fuel type, we
estimate the number of land/road transport vehicles for the Faroe Islands according to
vehicle type and type of fuel as shown below in Table 10.
Table 10: Number of vehicles according to vehicle type and fuel, Faroe Islands
Vehicle type Diesel oil Motor spirit Biogas Total
DSL GSL BGS
Cars 11,147 11,147 0 22,293
Buses 211 0 0 211
Vans 3,317 369 0 3,685
Trucks/lorries 562 0 0 562
Snowmobiles 0 0 0 0
ATV & 4-whl. 0 2,546 0 2,546
Total 15,236 14,061 0 29,297
Energy consumption and related emissions
As before, we then estimate the current and projected energy consumption by
land/road transport according to vehicle type and type of fuel on the Faroe Islands
shown below in Table 11.
26 Energy in the West Nordics and the ArcticTable 11: Current and projected energy consumption by land transport [TJ], the Faroe Islands
2016 2020 2035
[TJ]
DSL GSL BGS Total DSL GSL BGS Total DSL GSL BGS Total
Cars 364 413 0 777 353 375 0 728 312 333 0 645
Buses 92 0 0 92 85 0 0 85 73 0 0 73
Vans 171 25 0 196 164 22 0 187 146 20 0 165
Trucks/lorries 203 0 0 203 188 0 0 188 163 0 0 163
Snowmobiles 0 0 0 0 0 0 0 0 0 0 0 0
ATV & 4-whl. 0 13 0 13 0 11 0 11 0 10 0 10
Total 830 450 0 1,280 790 408 0 1,199 693 363 0 1,056
In the Faroe Islands, also more than half of the energy consumed by land/road transport
vehicles in 2016 is estimated to be consumed by cars. Trucks/lorries together with vans
account for almost one-third of the energy consumed by land/road transport vehicles
in 2016. Further, it can be seen from the table, that energy consumption by
conventional vehicles is projected to decline from approximately 1.3 PJ in 2016 to
approximately 1.2 PJ in 2020 and below 1.1 PJ in 2035.
The associated projected carbon-emissions from land transport will decline from
almost 90 thousand tonnes CO₂ in 2020 to almost 80 thousand tonnes CO₂ in 2035, as
shown below in Table 12.
Table 12: Projected CO₂ emissions by land transport [th. tonnes CO₂], the Faroe Islands
2020 2035
[th. ton. CO2]
DSL GSL BGS Total DSL GSL BGS Total
Cars 26 27 0 53 23 24 0 47
Buses 6 0 0 6 5 0 0 5
Vans 12 2 0 14 11 1 0 12
Trucks/lorries 14 0 0 14 12 0 0 12
Snowmobiles 0 0 0 0 0 0 0 0
ATV & 4-whl. 0 1 0 1 0 1 0 1
Total 58 30 0 88 51 26 0 78
Estimated costs of obtaining emissions reduction potential
Estimates of the associated costs of obtaining the above-mentioned emissions
reduction potential in the Faroe Islands are reported below in Table 13.
Energy in the West Nordics and the Arctic 27Table 13: Projected total yearly vehicle costs incl. fuels [m. EUR], the Faroe Islands
2020 2035
[m. EUR]
Conv. Altern. Diff. Conv. Altern. Diff.
Cars 73 96 24 74 77 3
Buses 12 22 10 12 16 3
Vans 15 20 5 15 16 1
Trucks/lorries 30 34 4 31 25 -5
Snowmobiles 0 0 0 0 0 0
ATV & 4-whl. 5 7 2 5 5 1
Total 134 179 45 137 140 3
Note: Abbreviations: Conv. = Conventional fuel vehicles.
Altern. = Alternative fuel vehicles.
Diff. = Difference between conventional and alternative fuel vehicles.
Based on expected costs and cost development it is estimated that annual extra socio-
economic costs associated with replacement of the entire fleet of conventional vehicles
in the Faroe Islands would amount to approximately EUR 45 million in 2020 and decline
to around EUR 3 million in 2035.
This corresponds to a CO₂ reduction cost of EUR 509 per tonnes CO₂ in 2020
declining to EUR 35 per tonnes CO₂ in 2035.
2.3.4 Greenland
Following the same methodology as explained above, we estimate for Greenland the
number of land/road transport vehicles according to vehicle type and type of fuel as
shown below in Table 14.
Table 14: Number of vehicles according to vehicle type and fuel, Greenland
Diesel oil Motor spirit Biogas Total
DSL GSL BGS
Cars 1,094 3,281 0 4,375
Buses 76 0 0 76
Vans 248 745 0 993
Trucks/lorries 322 0 0 322
Snowmobiles 0 1.179 0 1,179
ATV & 4-whl. 0 209 0 209
Total 1,740 5,414 0 7,154
Energy consumption and related emissions
Again, we estimate the current and projected energy consumption by land/road
transport according to vehicle type and type of fuel in Greenland. These estimates are
shown below in Table 15.
28 Energy in the West Nordics and the ArcticTable 15: Current and projected energy consumption by land transport [TJ], Greenland
2016 2020 2035
[TJ]
DSL GSL BGS Total DSL GSL BGS Total DSL GSL BGS Total
Cars 45 184 0 229 44 167 0 211 39 149 0 187
Buses 42 0 0 42 39 0 0 39 33 0 0 33
Vans 16 76 0 92 16 68 0 84 14 60 0 74
Trucks/lorries 147 0 0 147 136 0 0 136 118 0 0 118
Snowmobiles 0 13 0 13 0 12 0 12 0 11 0 11
ATV & 4-whl. 0 2 0 2 0 1 0 1 0 1 0 1
Total 250 275 0 525 234 249 0 483 203 221 0 424
In Greenland, cars have a less dominate share of energy consumed by land/road
transport vehicles in 2016 than in Iceland and the Faroe Islands. However, cars still
consume around 45%, while trucks/lorries consume around 30% and vans consume
almost 20% of the energy consumed by land/road transport vehicles in 2016. Energy
consumption by conventional vehicles is projected to decline from 525 TJ in 2016 to just
above 480 TJ in 2020 and around 425 TJ in 2035.
The associated projected carbon-emissions will decline from approximately 35
thousand tonnes CO₂ in 2020 to approximately 31 thousand tonnes CO₂ in 2035, as
shown below in Table 16.
Table 16: Projected CO₂ emissions by land transport [th. tonnes CO₂], Greenland
2020 2035
[th. ton. CO2]
DSL GSL BGS Total DSL GSL BGS Total
Cars 3 12 0 15 3 11 0 14
Buses 3 0 0 3 2 0 0 2
Vans 1 5 0 6 1 4 0 5
Trucks/lorries 10 0 0 10 9 0 0 9
Snowmobiles 0 1 0 1 0 1 0 1
ATV & 4-whl. 0 0 0 0 0 0 0 0
Total 17 18 0 35 15 16 0 31
Estimated costs of obtaining emissions reduction potential
Estimates of the associated costs of obtaining the above-mentioned emissions
reduction potential in Greenland are reported below in Table 17.
Energy in the West Nordics and the Arctic 29Table 17: Projected total yearly vehicle costs incl. fuels [m. EUR], Greenland
2020 2035
[m. EUR]
Conv. Altern. Diff. Conv. Altern. Diff.
Cars 14 23 9 14 18 4
Buses 4 9 4 4 6 2
Vans 4 7 3 4 5 1
Trucks/lorries 17 24 7 18 18 0
Snowmobiles 2 3 1 2 3 1
ATV & 4-whl. 0 1 0 0 0 0
Total 42 66 24 43 51 8
Note: Abbreviations: Conv. = Conventional fuel vehicles.
Altern. = Alternative fuel vehicles.
Diff. = Difference between conventional and alternative fuel vehicles.
Annual socio-economic extra costs associated with replacement of the entire fleet of
conventional vehicles in Greenland in 2020 are estimated to amount to around
EUR 24 million and decline to approximately EUR 8 million in 2035.
Corresponding CO₂ reduction costs are EUR 682 per tonnes CO₂ in 2020 declining
to EUR 266 per tonnes CO₂ in 2035. These relatively higher CO₂ reduction costs,
particularly in 2035, reflect to some extent that electricity prices are relatively high in
Greenland compared to Iceland and, to some degree, the Faroe Islands.
2.3.5 Svalbard
For Svalbard, we estimate the number of land/road transport vehicles according to
vehicle type and type of fuel, shown below in Table 18.
Table 18: Number of vehicles according to vehicle type and fuel, Svalbard
Diesel oil Motor spirit Biogas Total
DSL GSL BGS
Cars 299 455 0 754
Buses 0 0 0 0
Vans 0 0 0 0
Trucks/lorries 0 0 0 0
Snowmobiles 0 1,355 0 1,355
ATV & 4-whl. 0 0 0 0
Total 299 1,810 0 2,109
Energy consumption and related emissions
Estimates of current and projected energy consumption from land/road transport
according to vehicle type and type of fuel in Svalbard are shown below in Table 19.
30 Energy in the West Nordics and the ArcticTable 19: Current and projected energy consumption by land transport [TJ], Svalbard
2016 2020 2035
[TJ]
DSL GSL BGS Total DSL GSL BGS Total DSL GSL BGS Total
Cars 11 40 0 51 10 36 0 47 9 32 0 41
Buses 0 0 0 0 0 0 0 0 0 0 0 0
Vans 0 0 0 0 0 0 0 0 0 0 0 0
Trucks/lorries 0 0 0 0 0 0 0 0 0 0 0 0
Snowmobiles 0 24 0 24 0 21 0 21 0 19 0 19
ATV & 4-whl. 0 0 0 0 0 0 0 0 0 0 0 0
Total 11 64 0 74 10 58 0 68 9 51 0 60
In Svalbard land/road transport vehicles are basically cars and snowmobiles.
Thus cars are estimated to consume less than 70% of the energy consumed by
land/road transport vehicles in 2016, while snowmobiles consequently consume around
30%. Energy consumption by conventional vehicles is projected to decline from 74 TJ in
2016 to almost 70 TJ in 2020 and around 60 TJ in 2035.
The associated projected carbon emissions will decline from approximately 5
thousand tonnes CO₂ in 2020 to approximately 4.5 thousand tonnes CO₂ in 2035, as
shown below in Table 20.
Table 20: Projected CO₂ emissions by land transport [th. tonnes CO₂], Svalbard
2020 2035
[th. ton. CO2]
DSL GSL BGS Total DSL GSL BGS Total
Cars 0.8 2.7 0.0 3.4 0.7 2.4 0.0 3.0
Buses 0.0 0.0 0.0 0.0 0.0 0.0 0.0 0.0
Vans 0.0 0.0 0.0 0.0 0.0 0.0 0.0 0.0
Trucks/lorries 0.0 0.0 0.0 0.0 0.0 0.0 0.0 0.0
Snowmobiles 0.0 1.6 0.0 1.6 0.0 1.4 0.0 1.4
ATV & 4-whl. 0.0 0.0 0.0 0.0 0.0 0.0 0.0 0.0
Total 0.8 4.2 0.0 5.0 0.7 3.7 0.0 4.4
Estimated costs of obtaining emissions reduction potential
In Table 21 below, the estimated annual extra costs associated with replacement of the
entire fleet of conventional vehicles in Svalbard are reported. Thus, the annual extra
costs are estimated to amount to approximately EUR 1.4 million in 2020 and decline to
just around EUR 0 million in 2035 (to be more precise EUR 0.044 million).
Energy in the West Nordics and the Arctic 31You can also read