OUR RESILIENT FUTURE: A FRAMEWORK FOR CLIMATE AND ENERGY SECURITY - Bristol ...
←
→
Page content transcription
If your browser does not render page correctly, please read the page content below

OUR RESILIENT FUTURE: A FRAMEWORK FOR CLIMATE AND ENERGY SECURITY

Description:       This document defines the strategy and action plan for improving the resilience of
                   the City of Bristol in addressing the threat of climate change through the
                   sustainable use and generation of energy. It sets out our existing commitments;
                   progress to date against these and what more must be done to meet them. Future
                   actions which are to be led or enabled by Bristol City Council are defined as well
                   as a broader range of initiatives which are in progress across the city.

Authors:           Alex Minshull, Andrew Luke, Sean     Sponsor:            Stephen Hilton
                   Shiels, Joe Phillips, Mark Leach

Document Status:   DRAFT for Cabinet approval           Version:            Cabinet 1.0

Classification:    Public                               Approval body:      Cabinet

Creation date:     21/10/15                             Date to be          03/11/15
                                                        approved: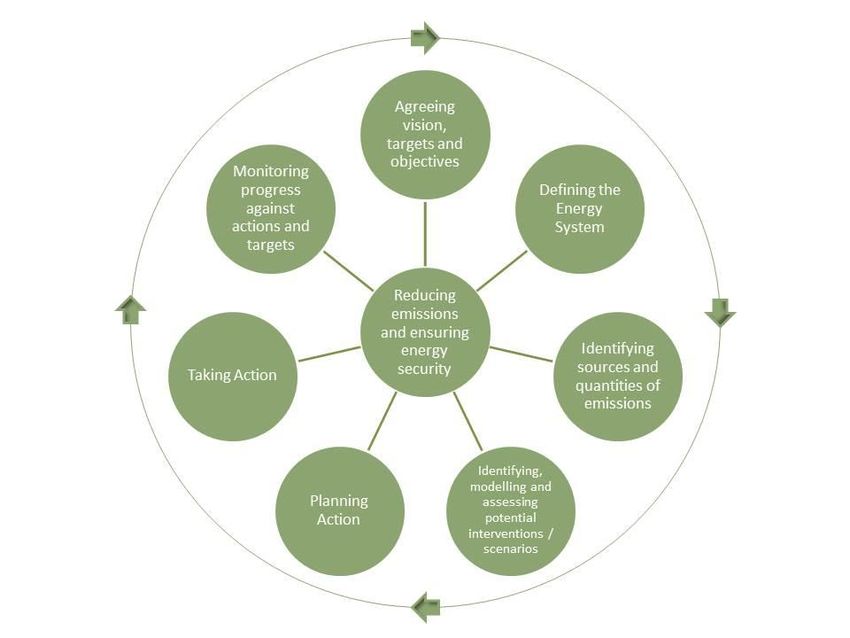
A FRAMEWORK FOR CLIMATE AND ENERGY SECURITY

OUR RESILIENT ENERGY FUTURE
Foreword by Mayor George Ferguson
As Mayor of Bristol I am focused on how to make the city a great place to live, work and play. I am
implementing many local initiatives to do this – whether these are improving our streets for walking
and cycling, investing in modern public transport or increasing our energy efficiency.

Bristol has long been an inclusive yet outward facing, international city that has helped shape our
shared global future. We are a key trading port, home to leaders in green businesses that are
creating the solutions to today’s challenges, and European Green Capital 2015.

Climate change and the security of energy are both global and local issues, which affect every part
of our city. I am proud that Bristol is both helping to secure a global climate agreement and leading
the UK in reducing carbon emissions and our reliance on imported fossil fuels, and doing this in
ways that make our city a better place to live by simultaneously achieving more and better jobs,
active travel options, improved health outcomes and recognises that the poorest and most
vulnerable in Bristol as well as globally will be most affected by climate change.

The people, businesses, organisations and politicians of Bristol are concerned about climate
change and are taking action right now to take us towards a sustainable future where we can live
well and do business without further damaging the climate that we rely upon.

In 2009 Bristol City councillors unanimously adopted ambitious targets to reduce CO 2 emissions
and energy use. Since then we have made good progress and we have a strong programme for
the coming years which is set out in this framework. Through this updated framework I am
reaffirming the City Council’s commitment to those targets and setting our interim targets for 2025
and 2035.

Achieving these targets will require significant action from the city council and I set out some of the
major projects we will lead to achieve this. However it also needs action from every person,
community and business in the city and so in this document I describe some of the ways in which
the city council will help enable action by others in Bristol. We also know that we do not yet fully
understand all the challenges and opportunities which realising the ambitious targets set in 2009
will entail – I therefore describe areas which we want to explore with partners, locally, regionally,
nationally and internationally to create the next generation of projects which will be implemented
over the next 10-20 years.

Making Bristol a low carbon city will improve our environment, will improve our citizen’s quality of
life, it makes sound economic sense and will create thousands of new jobs. I look forward to
realising these opportunities.

                                                     i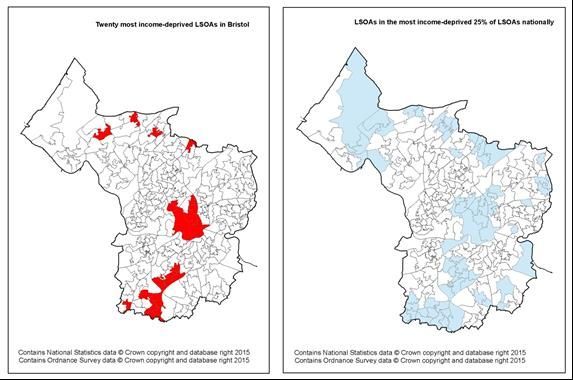
OUR RESILIENT FUTURE

                       THIS PAGE IS INTENTIONALLY BLANK

                                      ii
A FRAMEWORK FOR CLIMATE AND ENERGY SECURITY
Executive Bristol is well placed to become a happy, healthy, low carbon city. Our residents and
Summary businesses care about climate change and are taking action within their
communities, we’re a leading centre of business and academic expertise in
sustainable development and we have a clear shared ambition to become a
sustainable, inclusive, low carbon city.
Climate change and energy security are important issues to the people of Bristol.
Across the whole city 70% of residents are concerned about the effects of climate
change and in every Neighbourhood Partnership area the majority of residents are
concerned about these impacts. Bristol is the UK’s leading centre for sustainability
expertise. We have the largest cluster of environmental technology and service
businesses in the core cities and we have two leading universities with excellent
research and teaching capabilities in climate, energy and sustainability issues.
Bristol has the shared ambition to become a sustainable city, as illustrated through
our green capital journey. Some 10 years ago the public, private and voluntary
sector in Bristol agreed a common goal - to be a green capital in Europe. Our
achievement of “European Green Capital 2015” was the result of many people
working in their own areas and working collectively, with both small and large
initiatives to make Bristol a greener city.
Bristol City Council unanimously adopted targets to reduce the city’s energy use by
30% and carbon dioxide emissions by 40% 2005-2020 and we have made good
progress. By 2013, the last year of data, we have reduced energy use by 20% and
carbon dioxide emissions by almost 18%. This performance is affected by local,
national and international factors.
This Framework summarises some key initiatives that are already underway which
will contribute to the achievement of our targets. However, significant additional
investment and action is needed, by all sectors, to achieve the 2020 targets and to
plan for and deliver our longer term targets leading to the decarbonisation of the city.
This Framework sets out some of the areas of future development which we need to
explore.
This framework also translates our existing 2050 CO2 reduction target of 80% into
key milestones of 50% reduction by 2025 and 60% by 2035, and associated energy
efficiency improvement targets. This will help to provide a more tangible long-term
pathway towards the substantial decarbonisation of Bristol whilst also aligning with
planning horizons for other functions within the City, which are crucial to achieving
our targets. In this document, Bristol City Council (BCC) also commits to new targets
for its own corporate energy efficiency and CO2 emissions having almost achieved its
2020 target 5 years early.
Decarbonising the city will require significant financial investment and the University
of Bristol has conducted ‘The Economics of Low Carbon Cities: A Mini Stern Review
for the City of Bristol’, to identify the opportunities in terms of their energy and carbon
reduction potential and their economic impacts and job creation potential. The key
challenges and opportunities are:
Bristol’s population is forecast to continue to grow, increasing by approximately
5% by 2020, and 20% by 2036 on 2015 levels. This will increase the overall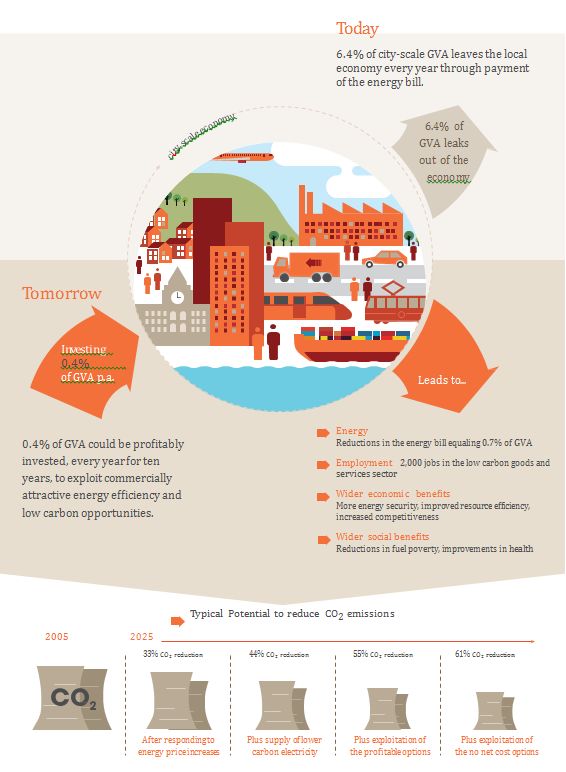
OUR RESILIENT FUTURE
demand for energy, and could impact upon our ability to meet targets.
Approximately 13% of all households in the City of Bristol lived in fuel poverty
during 2012, and whilst levels of fuel poverty vary greatly across the City, in the
worst affected ward 27% of households were considered as being fuel poor.
The Sustainability, low carbon environmental goods and services, and
environmental technology sectors make up an increasing component of Bristol’s
economy, contributing jobs and wealth, and this can be developed.
National action alone will not achieve Bristol’s targets and local action is needed.
Bristol’s targets for 2020 and 2025 are achievable through the implementation of
relatively simple, individually cost beneficial measures.
Bristol’s targets for 2035 are achievable if a basket of measures are implemented
and these could collectively be cost neutral to the Bristol economy.
The total cost-neutral investment potential for Bristol to 2025 is £2.2Bn. Many of
the measures make sound commercial sense and would pay for themselves in a
relatively short period of time, and if done well there may be a wide range of
indirect benefits.
These investments would generate significant levels of employment and
economic growth in the process, with 2000 jobs created by the cost effective
measures, and a further 8000 will full implementation of the cost neutral
measures.
The cost-neutral measures would reduce Bristol’s annual energy bills by £300m.
Significant investment opportunities exist within the most deprived parts of the
City of Bristol, and taking action to implement energy improvement measures in
these areas provide a greater return on investment, as well improving the health
and quality of life of residents.
Changing how we use energy in the city creates huge opportunities to make the city
a better place to live for everyone – with cleaner air, warmer homes and a higher
quality of life. It enables us to address some key social and health issues, in
particular fuel poverty, but also creates some threats which could increase inequality.
In preparing this framework we have considered the other benefits and the social
impact of a range of key measures. The Framework analyses these opportunities
and risks and identifies a set of priority measures. They have been clustered into 4
complementary themes; domestic, commercial, industrial and transport.
This Framework sets out an action plan for Bristol City Council which reflects the city
council’s role in the city. The initiatives have been organised into three groups where
the city council will Lead action, Enable action by others, and will Explore
opportunities and future action with others. This provides both appropriate
accountability for the city council and inclusion of initiatives which are being led by or
in partnership with Bristol communities, the business community, public bodies and
wider civil society.
Finally, a robust monitoring and review framework is defined here to clearly define
transparent criteria for success and to ensure the plan is flexible to changes in
technology, society and the economy.
iv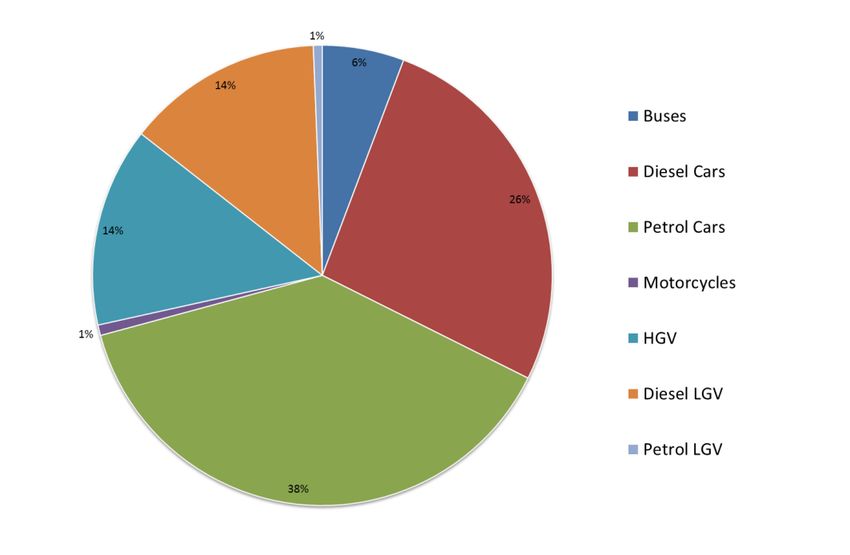
A FRAMEWORK FOR CLIMATE AND ENERGY SECURITY

            *Gross Value Added (GVA) is a productivity metric that measures the difference between output and
             intermediate consumption. It provides ‘£’ value for the amount of goods and services that have been
             produced, less the cost of all inputs and raw materials that are directly attributable to that production.

Figure i: The City of Bristol’s Energy Economy
                                                            v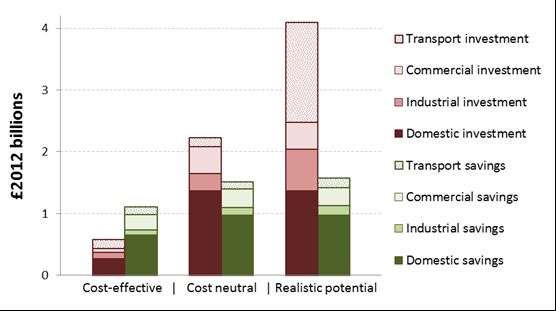
OUR RESILIENT FUTURE

 4 THEMES
 143 INITIATIVES

                                BCC CLIMATE AND ENERGY FRAMEWORK
                        4 THEMES                         8535 kT CO2
                        143 INITIATIVES

                                                                                 Transport
                                                                                14 Measures
                                                                                 385 kT CO2

                                                         Commercial
                                                         27 Measures
                                                         1552 kT CO2

                                        Industrial
                                                                       This graph summarises an
                                       72 Measures                     analytical analysis of 143
                                       1560 kT CO2                     possible interventions to
                                                                       reduce the City of Bristol’s
                                                                       carbon dioxide emissions.
                                                                       They have been ranked from
                                                                       most to least cost effective
                                                                       (left to right), where negative
                                                                       values on the vertical axis
                                                                       denote interventions which
                         Domestic                                      would pay for themselves
                        30 Measures                                    over a reasonable economic
                        5038 kT CO2                                    lifetime. The width of the
                                                                       bars represents the quantity
                                                                       of CO2 that can be saved as a
                                                                       result of implementing each
                                                                       of the interventions within
                                                                       the City of Bristol.

Figure ii: Marginal Abatement Cost Curve for All Interventions in All Sectors to 2035

                                                vi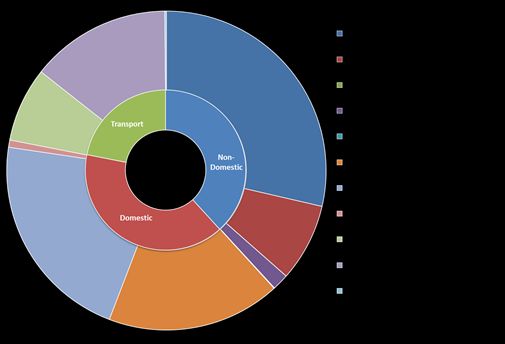
OUR RESILIENT FUTURE

Table of      EXECUTIVE SUMMARY ................................................................................ III
Contents       Table of Contents ........................................................................................ vii
              INTRODUCTION ............................................................................................. 1
              OUR TARGETS:
              WHAT DO WE WANT TO ACHIEVE? ............................................................ 5
               National & International Targets .................................................................... 5
               Playing our part: Bristol’s Existing Targets .................................................... 5
               Other Cities’ Targets ..................................................................................... 6
               Bristol’s New Targets .................................................................................... 7
              OUR CURRENT PERFORMANCE:
              BRISTOL’S ENERGY USE AND EMISSIONS ................................................ 9
               The City of Bristol .......................................................................................... 9
               Bristol’s Energy System ................................................................................ 9
               City of Bristol Energy Use, Energy Generation and Carbon Emissions ....... 10
               Bristol City Council Energy Consumption and Carbon Emissions ................ 14
              OUR PROGRESS SO FAR:
              WHAT WE’VE DONE TO REDUCE EMISSIONS.......................................... 17
               Progress against targets ............................................................................. 17
               Action taken to date .................................................................................... 19
              OUR OPPORTUNITIES FOR ACTION:
              HOW CAN WE FURTHER REDUCE OUR EMISSIONS? ............................. 22
               Analysis of Evidence ................................................................................... 22
               Results ........................................................................................................ 22
               Energy Bill Savings ..................................................................................... 27
               National & International Frameworks ........................................................... 29
               Energy & Climate Security .......................................................................... 29
               Integration with Other Bristol initiatives ........................................................ 30
               Conclusions ................................................................................................ 31
              OUR PLAN:
              WHAT WILL BRISTOL CITY COUNCIL DO? ............................................... 34
               Lead: BCC Shall Plan and Deliver ............................................................... 35
               Enable: We’ll Support Others to Deliver ...................................................... 46
               Explore: We’ll Research & Deliver More ...................................................... 50
              STAYING CURRENT:
              MONITORING AND REVIEWING THIS FRAMEWORK................................ 58
               Monitoring & Review ................................................................................... 58
               Governance ................................................................................................ 59
              APPENDIX 1: THE ECONOMICS OF LOW CARBON CITIES:
              A MINI-STERN REVIEW FOR THE CITY OF BRISTOL ............................... 60
              APPENDIX 2: THE ECONOMICS OF LOW CARBON CITIES:
              SUMMARY OF INTERVENTIONS ................................................................ 66
OUR RESILIENT FUTURE
Figures Figure 1: Developing Our Climate And Energy Security Framework .................... 2
Figure 2: Bristol’s Energy Consumption by Sectors (2013) ................................ 11
Figure 3: Fuel Vehicle Use for City of Bristol (2013) .......................................... 11
Figure 4: City of Bristol CO2 Emissions (2013)................................................... 13
Figure 5: Bristol City Council’s Carbon Emission Profile .................................... 14
Figure 6: Bristol City Council CO2 Emissions 2005-2015 ................................... 15
Figure 7: Graph of Progress against Target ....................................................... 17
Figure 8: Timeline of Some of BCC’s Climate Change Activities ........................ 20
Figure 9: Investment Scenarios and their Return Between 2015-2025 .............. 23
Figure 10: Investment Scenarios And Their Return Between 2015-2035 ........... 23
Figure 11: The City of Bristol’s Energy Economy ............................................... 24
Figure 12: City of Bristol CO2 Emissions and Intervention Scenarios ................. 25
Figure 13: Marginal Abatement Cost Curve for All Interventions in
all Sectors to 2035 ............................................................................................. 26
Figure 14: Deprived Areas within the City of Bristol ........................................... 28
Figure 15: CCESF Review and Reporting Cycle ................................................ 58
Tables Table 1: Bristol, UK & European Emission Targets from 1990 Baseline .............. 6
Table 2: City Of Bristol Proposed Reduction Targets ........................................... 7
Table 3: Bristol City Councils Proposed Reduction Targets ................................. 7
Table 4: Local Renewable Electricity Generation ............................................... 12
Table 5: Local Renewable Electricity Generation ............................................... 12
viiiA FRAMEWORK FOR CLIMATE AND ENERGY SECURITY
INTRODUCTION
Framew ork This document outlines the action that Bristol City Council (BCC) will undertake
Scope directly, or indirectly to enable action by others, to tackle the City of Bristol’s carbon
dioxide (CO2) emissions. Through further consultation and development in early 2016
it will develop into a more comprehensive plan which takes into account the action
being taken across the city by a wide range of stakeholders. This will help ensure that
future policy making in the area is truly “joined-up” – avoiding duplication, capitalising
on synergies and increasing investor confidence in Bristol as a global leader in city-
scale action on climate change.
The City of Bristol uses energy directly, for example in our homes, and indirectly, as
embodied energy, for example through the food or products that we purchase or
dispose of. The targets and the data presented in this framework relate to our direct
energy use, and the associated CO2 emissions, from homes, other commercial and
industrial buildings and transport. The Framework focuses on these direct activities,
but also recognises the need to better understand and reduce our indirect emissions.
As a result, the Framework includes a number of actions relating to food, waste and
other indirect emissions.
The focus of the framework is on climate change mitigation, i.e. reducing CO2
emissions, identifying action to address how the city sources, consumes, and
produces energy. However, in mitigating CO2 emissions the city will influence, and be
influenced by, a range of other issues and strategies including energy security, fuel
poverty, climate adaptation and resilience. These strategies will need to be well
integrated to reduce duplication, share resources and costs, and maximise co-
benefits.
Whilst the framework is focused on action within the administrative area of BCC, it
recognises that energy systems extend beyond administrative boundaries and as
such BCC will continue to work with neighbouring authorities in the West of England
to progress towards a low carbon and energy secure future.
Our energy system is complex, and our energy use and the resultant CO2 emissions
Our
we generate, are constantly influenced and affected by the decisions of many people,
Approach
communities, organisations and industries in Bristol and beyond. The approach to
developing and implementing this framework follows a number of distinct but iterative
stages. These are described below and shown in Figure 1:
• Reviewing current targets, agreeing the vision, and creating clear long term
targets and objectives;
• Defining and developing our understanding of the energy system;
• Identifying sources and gathering data to quantify our emissions;
• Identifying and assessing the costs and benefits of potential interventions;
• Planning and using our knowledge to inform the application of interventions to
reduce emissions;
• Implementing interventions and influencing plans and strategies across other
the city to reduce emissions; &,
1OUR RESILIENT FUTURE
• Monitoring progress and using our learning to adjust plans to respond to
societal, economic and technological change.
Figure 1: Developing Our Climate And Energy Security Framework
Whilst development of this framework has been informed by data, knowledge and
other inputs from a wide range of sources, two key projects have underpinned our
work:
• The Systems Thinking for Efficient Energy Planning (STEEP) project, through
its research into the use of group model-building workshops with
stakeholders to reach a shared understanding of complex energy systems,
has greatly influenced the development of this framework; and
• ‘The Economics of Low Carbon Cities: A Mini Stern Review for the City of
Bristol’, (hereafter referred to as the ‘Mini-Stern’) conducted by the University
if Bristol (UoB), which provides a comprehensive economic assessment of
the cost and carbon effectiveness of a wide range of the low carbon
interventions that could be applied across the City of Bristol in the domestic,
commercial, industrial and transport sectors.
In addition to the these inputs the framework also draws on the experience of
officers and senior managers from across BCC, as well from the STEEP and UoB
project teams, and a range of other stakeholders.
2A FRAMEWORK FOR CLIMATE AND ENERGY SECURITY
However, to further build upon the work undertaken to date, and given the iterative
nature of the framework development process, broader stakeholder engagement is
required in order to obtain wider ‘buy in’ and better influence City wide decisions to
tackle CO2 emissions and improve energy security. Especially since most of the
council action described in this Framework is developed and implemented through
other strategies and plans, for example on transport, land use, housing and strategic
resilience.
Therefore, stakeholder engagement will continue after the adoption of this
framework for consultation, and in early 2016 broader consultation will capture and
incorporate the views of key stakeholders. This will be informed by the stakeholder
mapping undertaken for STEEP and the economic modelling conducted by the UoB.
This engagement and consultation will seek to develop and refine the strategy for
achieving the city’s targets and reflect and encourage action by key organisations in
the city.
The Framework will be adopted for Consultation in November 2015, and consultation
will take place during January, February and March 2016. The revised framework
will be adopted in the summer of 2016, and will be subject to continuous review.
3OUR RESILIENT FUTURE
THIS PAGE IS INTENTIONALLY BLANK
4A FRAMEWORK FOR CLIMATE AND ENERGY SECURITY
OUR TARGETS:
WHAT DO WE WANT TO ACHIEVE?
National & The European Union has set targets to cut greenhouse gas emissions by 20% by
International 2020, 40% by 2030, and 85-95% by 2050, based on a 1990 emissions baselinei.
Targets These are supplemented with targets for raising the share of EU energy
generated from renewable resources to 20% and for a 20% improvement in the
EU's energy efficiency, by 2020.
In the UK, the Climate Change Act 2008 commits the UK to reducing emissions by
at least 80% on 1990 levels by 2050. This target represents an appropriate UK
contribution to global emission reductions consistent with limiting global
temperature rise to as little as possible above 2°C. The UK Government has also
set further short term limits for greenhouse gas emissions, through legally binding
carbon budgets, equating to a reduction of 23% by 2012, 29% by 2017, 35% by
2020, and 50% by 2025, all from 1990 levels.
It is planned that a new global agreement and set of climate targets will be agreed
in December 2015 at the United Nations Framework Convention on Climate
Change (UNFCCC), Conference of Parties 21 (COP21) in Paris. The aim of this
agreement will be to reduce global emissions to limit global temperature rise to
2°Cii.
Playing our Towns and cities account for more than half of all of society’s greenhouse gas
part: (GHG) emissionsiii. Interestingly and very importantly, whilst there is no duty on
Bristol’s UK local government under the ‘Climate Change Act 2008’ to reduce the GHG
Existing emissions or energy use of their cities, there is a statutory requirement to consider
Targets the provisions and objectives of the Climate Change Act 2008 in the National
Planning Policy Framework (NPPF) and the associated official guidance. This
includes the requirements for local authorities to adopt proactive strategies to
mitigate and adapt to climate change in line with the provisions and objectives of
the Act and to co-operate to deliver strategic priorities which include climate
change. It is clear that without securing reductions in the areas under the
influence of local authorities, the UK would not be able to achieve the reduction in
GHG emissions required to meet carbon budgetsiv.
In recognition that local governments share the responsibility and are uniquely
placed to lead in combatting climate change, BCC is committed to demonstrating
effective decentralised action and to supporting businesses, individuals and
communities in reducing greenhouse gas emissions. As such, BCC has committed
to achieving the following city and council wide targets, from a 2005 baseline tov:
Reduce energy use 30% by 2020;
Reduce CO2 emissions 40% by 2020; &,
Reduce CO2 emissions 80% by 2050.
2005 was selected as the baseline year for Bristol targets because this is the first
5OUR RESILIENT FUTURE
year for which reliable local data on emissions published by the Department of
Energy & Climate Change (DECCvi) where available.
A simple estimate of Bristol’s 1990 emissions suggests that emissions were
reduced by approximately 10% between 1990 and 2005. This means that Bristol’s
targets equate to approximately 45% for 2020 and 82% for 2050, when compared
to a 1990 baseline.
Table 1: Bristol, UK & European Emission Targets from 1990 Baseline
2020 2050
European 20% 85-95%
UK 35% 80%
Bristol c.45% c.82%
BCC has signed a number of international commitments to reporting and taking
action on climate change in support of these targetsvii. This requires BCC to
demonstrate that action is being taken on climate change by adopting an action
plan identifying targets, resource requirements, administrative structures and firm
time-bound commitments to action over the next 3-4 years. This Framework
currently meets those commitments and will be developed further to meet future
commitments.
Other Cities’ The UK Core Citiesviii, and other West of England authorities, have also adopted
Targets targets to reduce CO2 emissions, and whilst there are differences in their baseline
years, the targets adopted and target years chosen, on average roughly equate to
a 33% reduction in CO2 emissions by 2020, and 80% by 2050, from a 2005
baseline.
The European Green Capitals have also all set their own climate targets, which
are influenced by their progress in the decarbonisation journey. The most
ambitious targets are set by Copenhagen, which aims to be Carbon Neutral by
2025, and Stockholm, which aims to be fossil fuel free by 2050. Whilst Bristol’s
targets are not as challenging as Copenhagen’s and Stockholm’s, they are as
ambitious as those of Hamburg, Vittoria Gasteiz and Essen, and are broadly
considered to be challenging given the current UK economy and policy context.
6A FRAMEWORK FOR CLIMATE AND ENERGY SECURITY
Bristol’s BCC has reviewed its existing commitments, has reflected upon our progress
New Targets against these commitments, and has decided to incorporate milestone targets for
citywide emissions and energy demand reduction. At the citywide level these
targets are designed to broadly align with the West of England’s (WoE) Joint Local
Transport PlanTransport (2011-2026) and the WoE Joint Spatial Plan (2036) cycles
so that the contributions of these processes can be measured against the revised
targets.
BCC proposes to adopt the following targets from the 2005 baseline, in the context
of those targets already adopted for 2020 and 2050:
Table 2: City Of Bristol Proposed Reduction Targets
2020 2025 2035 2050
Citywide CO2 emissions 40% 50% 60% 80%
Citywide Energy consumption 30% 35% 45% 55%
Citywide Renewable Energy To be developed thorough consultation
(New targets shown in Bold)
Table 3: Bristol City Councils Proposed Reduction Targets
2020 2025 2035 2050
BCC CO2 emissions 50% 60%
(was 40%)
BCC Energy use 40% 50%
(was 30%)
(New targets shown in Bold)
i
1990 is the baseline for the previous global agreement on climate change – the Kyoto Protocol adopted in 1997.
ii
An impact of less than 2°C would exacerbate impacts already observed and other impacts would be triggered. 2-
4°C would lead to worsening impacts at all scales. If sustained this could lead to several metres of sea level rise
(Source: Committee on Climate Change https://www.theccc.org.uk/tackling-climate-change/the-science-of-
climate-change/setting-a-target-for-emission-reduction/)
iii
See: http://www.eumayors.eu/IMG/pdf/covenantofmayors_text_en.pdf
iv
See: https://www.theccc.org.uk/archive/aws/Local%20Authorites/LA%20Report_summary.pdf
v
Targets are set against a 2005 baseline and as an ‘absolute reduction’, and approved by full Bristol City Council
in 2009 and 2010
vi
CO2 emissions within the scope of influence of Local Authorities excludes emissions from Road Transport
(Motorways), Diesel Railways, Land Use, Land Use Change and Forestry sectors and EU Emissions trading
system sites have been removed from the “Large industrial installations” sector with the exception of energy
suppliers (e.g. power stations), whose emissions are indirectly included via the end-user estimates for electricity
use.
7OUR RESILIENT FUTURE
vii
For example: Covenant of Mayors, Compact of Mayors, The Carbonn Climate Registry, The Nantes Declaration
of Mayors and sub-national Leaders on Climate Change.
viii
The UK’s Core Cities are Birmingham, Bristol, Cardiff, Glasgow, Leeds, Liverpool, Manchester, Newcastle,
Nottingham and Sheffield.
8A FRAMEWORK FOR CLIMATE AND ENERGY SECURITY
OUR CURRENT PERFORMANCE:
BRISTOL’S ENERGY USE AND EMISSIONS
The Cit y of Bristol is one of UK’s ten core cities and the largest city in the South West region. The
Bristol City Council’s administrative area covers approximately 110km² with a population of
over 440,0009 people.
Bristol’s population is forecast to increase by approximately 5% by 2020, and by 20%
by 2036 on 2015 levels10. On the basis of recent demographic trends the number of
households is also predicted to rise by approximately 10,000 (5%) by 2020 and by
40,000 by 2036 (c.20%). These changes in population will increase the overall
demand for energy, will impact upon Bristol’s ability to meet its emission targets, may
impact upon the quality of life of Bristol’s residents, and could affect Bristol’s status as
the UK’s most liveable city.
The latest data available shows that approximately 13% of all households in the City of
Bristol lived in fuel poverty during 201211, and whilst levels of fuel poverty vary greatly
across the City, in the worst affected ward 27% of households were considered as
being fuel poor.
There is no direct code for the low carbon sector in the Standard Industry
Classification (SIC) system, however data available on the Low Carbon Environmental
Goods and Services (LCEGS) sector12 has been collated to measure growth in the
‘green economy’. This data indicates that between 2007 -13, the LCEGS sector
accounted for an average of 4.7% of all jobs in Bristol, with an additional 3.6% of jobs
made up from the environmental technology category.
Bristol’s At present, the majority of Bristol’s energy is supplied from the national energy
Energ y infrastructure and the ability to meet carbon reduction targets depends heavily on the
System decarbonisation of the national electricity network. As a result overall energy mix and
uptake of energy efficiency, low carbon and renewable measures is heavily impacted
by policy, regulation and incentives set at the national level.
There are many stakeholders with different roles within the energy system including
users, generators, suppliers, distributors, transportation and storage providers,
traders, service providers, financial investors and advisers, land owners and third
sector organisations. These have been mapped as part of the STEEP project.
This section describes the Bristol energy system in terms of the type and quantity of
fuels and energy consumed. It looks at how energy is used within Bristol, and presents
the current understanding of local energy generation.
9OUR RESILIENT FUTURE
What We Bristol has been monitoring its energy use and carbon dioxide emissions at the City
Measure? and Council level since 2005. The scope of Bristol’s monitoring program has changed,
and will continue to change as our understanding of the Bristol energy system evolves,
and in response to BCC’s international commitments under initiatives such as the
‘Covenant of Mayors’13 and the ‘Compact of Mayors’.
BCC currently uses data collected by the UK Government Department for Energy and
Climate Change (DECC)14 to monitor and reports on the CO2 emissions arising from
within the City of Bristol and CO2 emissions associated with grid supplied electrical
energy consumed within the City of Bristol, but generated elsewhere, for:
Domestic buildings;
Non-domestic buildings, equipment/facilities including commercial, industrial,
education, public administration but excluding some major industrial
operations;
Road Transport within the local authority area (excluding traffic on motorways);
and,
Residual fuel consumption.
BCC also collects energy consumption and CO2 emissions data for Council activity
including energy used for operating buildings, street lighting, running vehicle fleet and
business travel. In recognition that full and up to date data will better inform action to
reduce emissions, BCC will keep the scope of its monitoring framework under review.
In response to commitments to international initiatives including the Compact of
Mayors, future data reporting will include:
Emissions data in metric tonnes of CO2e (carbon dioxide equivalents);
Emissions from additional sectors (i.e. waste, industrial processes and product
use (IPPU) & agriculture, forestry and other land use);
More Greenhouse gases (methane (CH4) and nitrous oxide (N2O)); &,
GHG emissions that occur outside the city boundary as a result of consumption
activities (e.g. food production) taking place within the city boundary15.
Cit y of ENERGY USE
Bristol
Based on most comprehensive and current DECC data available16 a total of 6,602
Energ y Use,
GWh of energy was consumed by the City of Bristol in 2013. 27% of all energy was
Energ y
consumed in the transport sector, 32% in non-domestic, and 41% in the domestic
Generation
sector.
and Carbon
Emissions The City of Bristol uses more gas than electricity, with gas accounting for
approximately 40%, and electricity for approximately 28% of all fuel consumed. Gas
was the dominant energy source for the domestic sector accounting for 72% of the
all energy consumed, whilst electricity was the dominant energy source for the non-
10A FRAMEWORK FOR CLIMATE AND ENERGY SECURITY
domestic sector accounting for 63% of all energy consumed.
Figure 2: Bristol’s Energy Consumption by Sectors (2013)
For transport, approximately 130 thousand tonnes of fuel were consumed in 2013 of
which 40% was petrol and 60% diesel17 (See Figure 3 below). DECC statistics
indicate that total energy consumption for transport declined by 9% over 2005-2013.
Within this, personal transport declined by 13%, while freight transport increased by
2%.
Figure 3: Fuel Vehicle Use for City of Bristol (2013)
11OUR RESILIENT FUTURE
ENERGY GENERATION
Research shows that the City of Bristol has a total installed generation capacity of
renewable electricity of 60.5MW, and an installed renewable heat capacity of 20MW.
In terms of non-renewable sources, there is 4.92MWe of gas CHP and 1,145MW of
conventional power generation (at one site, Seabank, which feeds directly into the
national transmission network).
Bristol is a dense urban area and the options for the deployment of large scale
renewable installations are limited. This said, in recent years there has been rapid
growth in the amount of renewable energy generated, albeit from a very low base,
and this growth has seen renewable energy contribute ~ 3% of Bristol’s current
energy demand 18 (See tables 4 and 5 below).
Table 4: Local Renewable Electricity Generation19
Technology Installations Capacity Estimated annual
(MW) output (GWh)
Anaerobic digestion 2 5.750 Not known
Biomass 1 12.936 Not known
Energy from waste 3 13.110 Not known
Sewage gas20 1 5.75 Not known
Solar photovoltaic 3,128 12.769 7.7
Wind 3 23 49.9
Total electricity 3,318 60.546
Table 5: Local Renewable Heat Generation
Technology Installations Capacity (MW)
Anaerobic digestion 2 4.25
Biomass 27 7.64
Heat pumps 54 0.572
Sewage gas 1 7
Solar thermal 140 0.61
Total heat 224 20.072
Research conducted as part of the STEEP project has highlighted that there are
significant opportunities for further deployment of renewable energy technologies in
the City of Bristol21:
12A FRAMEWORK FOR CLIMATE AND ENERGY SECURITY
Whilst there is limited scope for significant additional generation of wind
energy within Bristol, up to 30 15kW turbines could be constructed in
Avonmouth giving an additional capacity of 450kW.
Roughly 640 oven dry tonnes (odt) per year of biomass could be expected
from woodlands, with woodchip from tree surgery activities in Bristol’s parks
and streets, and in a survey undertaken for the Bristol Biomass Study (CSE,
2003) around 270 odt per year of untreated wood residues were identified
from 10 joinery/sawmill firms in Bristol, generating 0.4 MW (heat-only).
A report produced in 2011 as part of the Bristol Solar Rooftop Mapping
Project identifies potential solar PV capacity of at least 322MW.
CO 2 EMISSIONS
Based on emissions data available from DECC22 for the year 2013:
A total of 1,968,000t CO2 was emitted through activity within the local
authority area.
Of Bristol’s CO2 emissions, 22% are from the transport sector, 38% from non-
domestic, and 40% from the domestic sector. This compares to the national
breakdown of 24%, 41% and 35% respectively.
Figure 4: City of Bristol CO2 Emissions (2013)
13OUR RESILIENT FUTURE
Bristol Cit y Whilst directly responsible for only a small fraction of overall city emissions, Bristol
Council City Council (BCC) is a key player in delivering emissions reductions and has
Energ y scope to influence and facilitate action and engage partners beyond its immediate
Consumption responsibilities. It is therefore important that BCC demonstrates leadership and is
and Carbon transparent and supportive in its approach to reducing its own greenhouse gas
Emissions emissions and addressing climate risk. BCC collects information annually on its
energy consumption and carbon emissions for the purposes of its Annual
Environmental Statement, which are verified by an independent auditor.
Data indicates that electricity accounts for 55% of energy consumed, 41% by
council buildings and 14% by street lighting. Gas use within buildings accounts for
44% of energy consumed.
With regards to transport, BCC consumed approximately 52,400 litres of petrol and
678,444 litres of bio-blend diesel. This equates to approximately 7% of BCC’s total
energy use.
BCC’s CO2 emissions for the 2014/15 financial year were 35,635 tonnes. Of the
total emissions, 72% are attributed to the operation of Local Authority buildings
(e.g. offices, museums and libraries), 21% from the operation of street lighting and
7% from business travel.
Figure 5: Bristol City Council’s Carbon Emission Profile
Bristol City Council has successfully reduced its emissions by 38% from a 2005
baseline, thus almost achieving its 2020 emission reduction target 5 years early
(See Figure 6 below)
14A FRAMEWORK FOR CLIMATE AND ENERGY SECURITY
Figure 6: Bristol City Council CO2 Emissions 2005-2015
9
Population Estimates for UK, England and Wales, Scotland and Northern Ireland, Mid-2014
http://www.ons.gov.uk/ons/publications/re-reference-tables.html?edition=tcm%3A77-368259
10
Source: Table 2: 2012-based Subnational Population Projections for Local Authorities in England -
http://www.ons.gov.uk/ons/taxonomy/index.html?nscl=Sub-national+Population+Projections#tab-data-tables
11
A fuel poor household is one in which a household has required fuel costs that are above the median level; and
were the household to spend that amount, they would be left with a residual income below the official poverty line
( https://www.gov.uk/government/collections/fuel-poverty-sub-regional-statistics)
12
The definition is broad and includes activities that may appear under the overlapping headings of
Environmental, Eco, Renewables, Sustainable, Clean Tech, Low Carbon or No Carbon. The threshold for
including a company in the analysis is if at least 20% of estimated sales activity can be attributed to the LCEGS
Sector.
13
The Covenant of Mayors and Mayors Adapt are merging and the in the future the Sustainable Energy Action
Plans (SEAPs) will include an adaptation/resilience component and will be called a Sustainable Energy and
Climate Plane (SECAP). It will need to be submitted every two years.
14
The DECC data show emissions allocated on an “end-user” basis where emissions are distributed according to
the point of energy consumption (or point of emission if not energy related). Except for the energy industry,
emissions from the production of goods are assigned to where the production takes place. Therefore, emissions
from the production of goods which are exported will be included, and emissions from the production of goods
which are imported are excluded. See: https://www.gov.uk/government/organisations/department-of-energy-
climate-change/about/statistics#emissions-and-climate-change-statistics
15
UK evidence suggests that emissions occurring outside the city, but driven by the consumption of materials
within cities are significant, and may in some instances be twice as large as those arising from the use of
electricity, gas, solid fuel and transportation within the city. See: John Barrett , Glen Peters , Thomas Wiedmann ,
Kate Scott , Manfred Lenzen , Katy Roelich & Corinne Le Quéré (2013) Consumption-based GHG emission
15OUR RESILIENT FUTURE
accounting: a UK case study, Climate Policy, 13:4, 451-470, DOI: 10.1080/14693062.2013.788858 To link to this
article: http://dx.doi.org/10.1080/14693062.2013.788858
16
Source: https://www.gov.uk/government/statistical-data-sets/total-final-energy-consumption-at-regional-and-
local-authority-level-2005-to-2010
17
Source: DECC Sub-national road transport fuel consumption statistics -
https://www.gov.uk/government/collections/road-transport-consumption-at-regional-and-local-level
18
Source: STEEP website and The Bristol Solar Rooftop Mapping Project
(http://www.bristol.gov.uk/sites/default/files/documents/environment/climate_change/5%20Bristol%20Sunshine%2
0-%20An%20Analysis%20of%20Rooftop%20Solar%20Mapping.pdf)
19
Data sourced from Regen SW's annual renewable energy survey (http://www.regensw.co.uk/wp-
content/uploads/2014/08/progressreport_2014_web_26a4646ced906a17.pdf) , the Feed-In Tariff register
(https://www.ofgem.gov.uk/environmental-programmes/feed-tariff-fit-scheme/feed-tariff-reports/installation-
reports) , and the Renewable Energy Guarantees of Origin report :
https://www.renewablesandchp.ofgem.gov.uk/Public/ReportManager.aspx?ReportVisibility=1&ReportCategory=0.
20
Renewable Energy Guarantee of Origin data puts sewage gas capacity at 5.55MW, while Regen SW survey
puts it at 5.75MW
21
Source: http://tools.smartsteep.eu/wiki/Bristol_Energy_Plan_System_Description
Note: Table includes Energy from Waste which is defined as partially renewable and only the energy contribution
from the biogenic portion would count towards renewable energy targets
(https://www.gov.uk/government/uploads/system/uploads/attachment_data/file/284612/pb14130-energy-waste-
201402.pdf)
22
NOTE: Current data available is from DECC. It incorporates LA emissions for transport, domestic and industrial
and commercial activity. It excludes waste and waste water, and excludes shipping, aviation and military
transport. BCC is in the process of updating its emissions inventory and in doing so is reviewing the scope.
Ideally we would be using local data to refine these figures. These are decisions we need to make on the scope
of the inventory.
16A FRAMEWORK FOR CLIMATE AND ENERGY SECURITY
OUR PROGRESS SO FAR:
WHAT WE’VE DONE TO REDUCE EMISSIONS
Progress TRENDS AND PERFORMANCE AGAINST CURRENT TARGETS
against
targets Businesses, public bodies, NGOs and citizens have undertaken a range of
interventions within Bristol in recent years. This combined with grid decarbonisation
and other external factors, such as the 2008 recession, has significantly reduced
energy demand and carbon dioxide emissions in the City (see Figure7). This
reduction has been achieved in the context of a growing population.
Figure 7: Graph of Progress against Target
CO2 emissions in any year are subject to a wide range of factors – including
changes in the mix of energy used in UK power stations and the weather.
DECC23 data shows that for the years 2005-2013:
Absolute emissions fell 17.4%, from 2,383,000 to 1,968,000 t CO2.
Per Capita Emissions decreased 23.5%, from 5.9 to 4.5 t CO2
The industrial and commercial sector, followed by domestic and then
transport, saw the biggest reduction in CO2 emissions.
The City of Bristol has achieved an average reduction in emissions of 2.3%
a year. It had previously been identified that a 3% year on year reduction
was required to meet the 2020 target.
17OUR RESILIENT FUTURE
At its current average rate the City of Bristol would achieve a 40% reduction
from 2005 levels in around 2022, two years later than planned (See below).
In order to achieve the 40% target by 2020, a further 22.6% reduction is
required, equating to a year on year reduction of approximately 4.5% (See
below).
Energy consumption for the City of Bristol fell from 8,300 Gigawatt Hours
(GWh) in 2005 to 6,789 GWh in 2012. This amounted to a reduction of
approximately 18%, achieved at an average rate of 2.8% per year. A further
12% reduction is required in order to attain the 30% target by 2030.
With over 50% of the human population living in urban areas cities have a major
role to play in reducing greenhouse gas emissions, and the City of Bristol is
committed to playing its part in achieving wider UK targets for reducing emissions,
through setting city-wide targets for reducing emissions by 40% by 2020, and 80%
by 2050.
Reviewing our status leads to some key factors to consider in planning for the next
phase of action:
The City Council is on course to achieve a reduction from its own activities
in line with the city-wide target for 2020 and is providing leadership in this
field.
The City of Bristol has achieved an average reduction in emissions of 2.3%
a year. This is marginally faster than the UK average but not sufficient to
achieve the targets on time.
Some of the reductions in CO2 emissions are likely to be a result of the
recession; however Bristol has succeeded in significantly reducing the
carbon emissions per pound of GVA.
Bristol’s economy and population are growing and this is driving an
increased demand for energy, and CO2 emissions.
In the last few years there is has been significant action by BCC and others
which is creating a pipeline of projects and interventions which are not yet
reflected in the data.
Many of the savings have been achieved by relatively easy “quick wins”,
however we are aware there is still more to do.
Progress so far has been achieved thanks to action from all sectors and
many businesses, public bodies and citizens. Achieving our future targets
will require an even greater substantial contribution from all sectors, and a
scale of action, investment and collaboration significantly beyond what we
have seen to date.
Annual monitoring and reporting through our Eco-Management and Audit
Scheme (EMAS) is a key mechanism to help drive improvements.
18A FRAMEWORK FOR CLIMATE AND ENERGY SECURITY
Action taken In February 2010, Cabinet adopted the Climate Change and Energy Security
to date Framework incorporating actions aimed at meeting the adopted targets for
emissions reduction.
Subsequently, in March 2012 Cabinet updated the Framework for the period 2012-
15. This set out a range of actions across eight sectors to be undertaken by BCC
alongside delivery partners.
Significant progress has been made against a number of the key actions identified
within the 2012-2015 framework and by other action taken by citizens and
organisations across the city. The diagram below illustrates some of the key actions
taken to date which have assisted in reducing Bristol’s emissions.
23
Source: Sub-national total final energy consumption in the United Kingdom 2005-2012 (DECC)
19OUR RESILIENT FUTURE Figure 8: Timeline of Some of BCC’s Climate Change Activities
A FRAMEWORK FOR CLIMATE AND ENERGY SECURITY

THIS PAGE IS INTENTIONALLY BLANK

               21
OUR RESILIENT FUTURE
OUR OPPORTUNITIES FOR ACTION:
HOW CAN WE FURTHER REDUCE OUR EMISSIONS?
Anal ysi s of The University of Bristol (UoB) have conducted a ‘Mini-Stern’ review to identify and
Evidence assess the range of interventions and scenarios available to reduce the City of
Bristol’s CO2 emissions. The study reviews the cost and carbon effectiveness of a
wide range of the low carbon options (143 in total) that could be applied at the local
level in households (30), industry (72), commerce (27) and transport (14), shown in
the appendix of this report. The review used nationally available datasets including
estimates for Gross Domestic Product (GDP), discount rates, interest rates, energy
prices, population and new building activity, to estimate savings emerging from
different measures (energy, cost and carbon), future energy prices, and the rate of
decarbonisation of the UK electricity grid. For assessing business-led mitigation
scenarios a typical, yet relatively conservative, interest rate of 8% is applied. When
considering more ambitious scenarios the maximum potential for the deployment of
interventions is assumed.
The interventions have been selected based upon previous work by the UK
Committee on Climate Change and the inputs have been refined using Bristol
specific information provided by the STEEP project and Bristol City Council (BCC) in
order to improve the accuracy of the models. Interventions have been assessed on
their scope for deployment, the associated investment needs, financial returns and
carbon savings, and the implications for the economy and employment. The study
covers the City of Bristol (CoB), an area with a population of 450,000 people, an
economy worth £14 billion a year and an energy bill of £0.9 billion a year. All
calculations have been based upon Gross Value Added (GVA), a productivity metric
that measures the difference between output and intermediate consumption. GVA
provides a pound (£) value for the amount of goods and services that have been
produced, less the cost of all inputs and raw materials that are directly attributable to
that production.
Preliminary results indicate that by 2025, compared to 2005 levels, the City of Bristol
Results
could reduce its carbon emissions above and beyond the expected reductions
forecast from, for example, the decarbonisation of the national grid and increases in
the price of energy (sometimes termed ‘business-as-usual’) by:
12% through cost effective investments that would pay for themselves (on
commercial terms) over their lifetime. This would require an investment of
£580 million across Bristol’s economy, generating average annual savings of
£175 million, paying back the investment in 4 years before generating further
savings for the lifetime of the measures.
17% through cost neutral investments that could be paid at no net cost to the
city’s economy if the benefits from cost effective measures were captured
22A FRAMEWORK FOR CLIMATE AND ENERGY SECURITY
and re-invested in further low carbon measures. This would require an
investment of £2.2billion, generating average annual savings of £240 million,
paying back the investment in 10 years before generating further savings for
the lifetime of the measures. This includes the cost effective measures listed
above.
18% with the exploitation of all of the realistic potential of the different
measures. This would require an investment of £4.1 billion, generating annual
savings of £250 million, paying back the investment within the lifetime of the
measures. This includes the cost effective and cost neutral measures listed
above.
Figure 9: Investment Scenarios and their Return Between 2015-2025
Figure 10: Investment Scenarios And Their Return Between 2015-2035
23OUR RESILIENT FUTURE
However, this assumes that all measures are implemented simultaneously where in
reality it has been assumed in many instances that the actual deployment rate is
approximately 10% per annum over ten years, thus achieving full deployment within
10 years. This is why figures 10 and 11 don’t show all returns on investment
immediately, and in reality the savings take place over a much long period of time.
Figure 11: The City of Bristol’s Energy Economy
24A FRAMEWORK FOR CLIMATE AND ENERGY SECURITY
Whilst many of the cost effective interventions for households and commercial make
significant returns on their investments over the 10 year period, 2015 to 2025 (figure
10), interventions in the industry and transport sectors only break even. When
considered over a longer period, from 2015 to 2035 (Figure 11), households,
commercial and industrial interventions all produce a significant return on
investment, whereas the transport sector interventions again only break even. This
is because some of the industry and all the transport interventions have very long
payback periods. Furthermore, transport intervention investments often have other
benefits which provide a compelling case for their implementation, for example
reducing congestion, improving air quality, increasing productivity, which are not
considered within this analysis.
Meeting Our Under a business as usual scenario assuming central energy prices and taking into
Targets? account projected grid decarbonisation (the blue line on figure 12) the City of Bristol
will not meet any of its future emission targets (shown in green). However, the City
of Bristol can meet its 2020 and 2025 emission targets (a 40% and 50% reduction on
2005 baseline respectively) through implementing the majority of the cost effective
measures. To achieve its 2035 emission target (60% reduction in CO 2 on 2005
baseline), the City of Bristol will have to implement all cost neutral measures. It is
also worth mentioning that the business as usual scenario (the blue line) is by no
means guaranteed and if government policy does not deliver broad national grid
decarbonisation, or increased prices, then greater efforts will be needed at the local
level for the City of Bristol to achieve its carbon dioxide emission commitments.
Figure 12: City of Bristol CO2 Emissions and Intervention Scenarios
25OUR RESILIENT FUTURE
BCC CARBON MANAGEMENT OPPORTUNITIES
4 THEMES
143 INITIATIVES
8535 kT CO2
SAVED
Transport
14 Measures
385 kT CO2
Commercial
27 Measures
1552 kT CO2
Industrial
72 Measures
1560 kT CO2 This graphic summarises an
analytical analysis of 143 possible
interventions to reduce the City
of Bristol’s carbon dioxide
emissions. They have been
ranked from most to least cost
effective (left to right), where
negative values on the vertical
axis denote interventions which
Domestic would pay for themselves over a
30 Measures reasonable economic lifetime.
The width of the bars represents
5038 kT CO2 the quantity of CO2 that can be
saved as a result of implementing
each of the interventions within
the City of Bristol.
Figure 13: Marginal Abatement Cost Curve for All Interventions in All Sectors to 2035
26You can also read