Biomass for Energy in the North West European Region: statistics, targets and regional case studies - Update of the ARBOR benchmark report ...

Page created by Evelyn Mccormick
 
CONTINUE READING
Biomass for Energy in the North West European Region: statistics, targets and regional case studies - Update of the ARBOR benchmark report ...
Update of the ARBOR benchmark report

Biomass for Energy in
the North West European
Region: statistics, targets
and regional case
studies.
June 2015
Biomass for Energy in the North West European Region: statistics, targets and regional case studies - Update of the ARBOR benchmark report ...
Summary                                                                                5   Chapter 3: Regional case studies                                                 38
    Table of contents
                        Project results                                                                        6   3.1 Belgium – Flanders                                                           39
                                                                                                                       3.1.1 Innovative case 1: Biogas Boeye - co-digestion in agricultural areas   39
                        List of figures                                                                        8       3.1.2 Innovative case 2: Ecowerf: digestion before composting                39
                                                                                                                       3.1.3 Innovative case 3: Small digestion at Hendrickx dairy farm             42
                        List of tables                                                                        10
                                                                                                                   3.2 Germany – Saarland                                                           40
                        List of abbreviations                                                                 11       3.2.1 Innovative case 1: Methavalor                                          40
                                                                                                                       3.2.2 Innovative case 2: Bioenergie Merzig GgmbH                             41
                        Introduction                                                                          13       3.2.3 Innovative case 3: Biomass cogeneration plant Warndt                   41
                                                                                                                   3.3 Ireland – South East Region                                                  41
                        Chapter 1: Statistics and targets of renewable energy and bio-energy                  14
                                                                                                                       3.3.1 Innovative case 1: Inchydoney Island Lodge and Spa                     42
                        1.1   Targets for renewable energy and bio-energy to 2020                             14       3.3.2 Innovative case 2: Teagasc Crops Research Centre                       43
                        1.2   Targets for renewable energy and bio-energy to 2030 and 2050                    16       3.3.3 Innovative case 3: Gartan Outdoor Education Centre                     43
                        1.3   Renewable (bio-)energy for electricity, heating or cooling and biogenic fuels   17
                                                                                                                   3.4 Luxembourg                                                                   43
                        1.4   Overview biomass targets divided in three categories: renewable electricity,    18
                                                                                                                       3.4.1 Innovative case 1: Naturgas Kielen                                     43
                              renewable heating and cooling and renewable transport
                                                                                                                       3.4.2 Innovative case 2: Valortech                                           44
                                                                                                                       3.4.3 Innovative case 3: Factory of the Future                               44
                        Chapter 2: Origin and sustainability of biomass                                       22
                                                                                                                       3.4.4 Innovative case 4: Kiowatt                                             47
                        2.1 Evolution of local available biomass                                              22
                                                                                                                   3.5 The Netherlands – region Gelderland                                          47
                            2.1.1 Reference and target scenario                                               22
                                                                                                                       3.5.1 Innovative case 1: A. van de Groep en Zonen                            47
                            2.1.2 Developments after 2006                                                     24
                                                                                                                       3.5.2 Innovative case 2: Simon Zwarts                                        48
                                                                                                                       3.5.3 Innovative case 3: Region Arnhem - Nijmegen                            48
                        2.2 Imported biomass                                                                  26
                                                                                                                       3.5.4 Innovative case 4: Municipality Nijmegen                               48
                            2.2.1 Europan Union                                                               26
                            2.2.2 Belgium                                                                     27   3.6 UK – Stoke-on-Trent and Staffordshire                                        49
                            2.2.3 Germany                                                                     27       3.6.1 Innovative case 1: John Pointon and Sons Ltd                           49
                            2.2.4 Luxembourg                                                                  28       3.6.2 Innovative case 2: Staffordshire County Council                        49
                            2.2.5 Ireland                                                                     28       3.6.3 Innovative case 3: Veolia Environmental Services                       50
                            2.2.6 The Netherlands                                                             28
                            2.2.7 United Kingdom                                                              29
                                                                                                                   Appendix                                                                         52
                        2.3 Sustainability criteria for biomass use                                           29   Appendix 1: Overview of relevant biomass projects
                            2.3.1 European framework                                                          29
                        		         2.3.1.1 Biofuels                                                           29
                        		         2.3.1.2 Solid and gaseous biomass                                          30
                        		         2.3.1.3 Framework for 2030                                                 30
                            2.3.2 Belgium                                                                     30
                            2.3.3 Germany                                                                     30
                            2.3.4 Luxembourg                                                                  32
                            2.3.5 Ireland                                                                     33
                            2.3.6 The Netherlands                                                             34
                            2.3.7 United Kingdom                                                              35

2                                                                                                                                                                                                        3
Biomass for Energy in the North West European Region: statistics, targets and regional case studies - Update of the ARBOR benchmark report ...
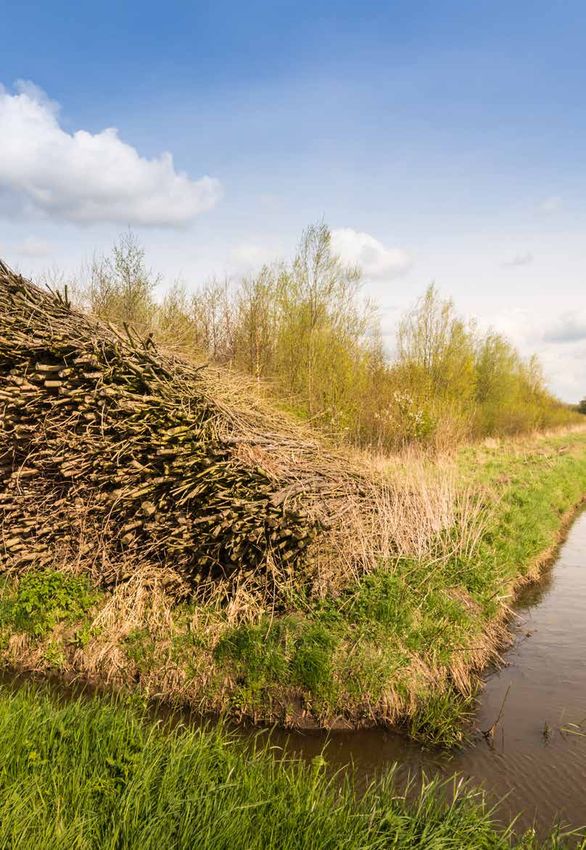
ARBOR (an acronym for Accelerating Renewable Energies through valorisation of

                                                                                                                         Summary
                                                                                                                                   Biogenic Organic Raw Material) is an Interreg IVB project for North-West Europe
                                                                                                                                   and consists of a partnership between Belgium, Germany, Ireland, Grand Duchy of
                                                                                                                                   Luxembourg, The Netherlands and the United Kingdom. This report was set up to
                                                                                                                                   summarize, list and compare the current situation concerning bio-energy of these six
                                                                                                                                   countries. In 2012 the first version of the benchmark report was published. This report
                                                                                                                                   gives an update of the development of bio-energy and of the evolution towards the
                                                                                                                                   targets set for 2020.

                                     Improving sustainable biomass                                                                 In the first chapter, an overview is given of the current national statistics on renewable
                                                                                                                                   and bio-energy. The state-of-the-art situation for renewable (bio-)energy is compared
                                     utilisation in North West Europe                                                              to the 2020 targets. It appears that all countries except for The Netherlands and Ireland
                                                                                                                                   have achieved the intermediate bio-energy target for 2013 and are well on track for their
                                                                                                                                   2020 targets. Furthermore, it can be seen that bio-energy plays an important role in the
                                                                                                                                   production of renewable energy and in all countries, except for Ireland, it attributes to
               This report was compiled in the framework of action 2 of the ARBOR* project.                                        more than half of the renewable energy production.
    Colophon

               Editors: Brecht Annicaert (Ghent University, BE), Lien Loosvelt (POM West-Vlaanderen, BE)                           Chapter 2 elaborates on the origin of biomass. It lists how much biomass is expected to
               Authors: Brecht Vanhecke & Lien Loosvelt (POM West-Vlaanderen, BE), Anke De Dobbelaere (Inagro, BE),                be locally available. Furthermore, it goes into detail on the share of imported biomass
               Brecht Annicaert (Ghent University)                                                                                 and on the sustainability criteria of biomass at the European level as well as at the
                                                                                                                                   member state level, restricted to the partner countries.
               This report further received input from the other ARBOR partners on specific aspects related to the
               regional transferability of the investigated case study results. Willem Dhooge (FlandersBio, BE) also               In the last chapter, for each country from the partnership at least two case studies
               helped with text corrections and lay-out.                                                                           that can serve as an innovative example in producing bio-energy in their country are
                                                                                                                                   mentioned. The cases were initially mentioned in the 2012 Benchmark report and are
               *
                Arbor is an Interreg IVB NWE project with 13 partners from 6 European regions dealing with the                     now updated presenting their progress and experiences. Also a comprehensive table
               development of technological solutions and regional strategy development for improved sustainable                   was made of all ongoing bio-energy projects in the project region.
               biomass utilisation. ARBOR is cofunded by local authorities from the United Kingdom, Flanders,
               Saarland, Luxemburg, The Netherlands, and Ireland.

               Publication Date: 05 June 2015

               Please check www.arbornwe.eu for the other reports that have been compiled within ARBOR:
               • Five case study reports on a diversity of subjects like nutrient recovery, low impact energy crops,
                  agro side streams, synergy parks and biomass closed-loop systems.
               • An update of the 2012 Benchmark report on biomass for energy use in NWE
               • A strategies report on biomass for energy for regional authorities in the North West European region.

4                                                                                                                                                                                                                               5
Biomass for Energy in the North West European Region: statistics, targets and regional case studies - Update of the ARBOR benchmark report ...
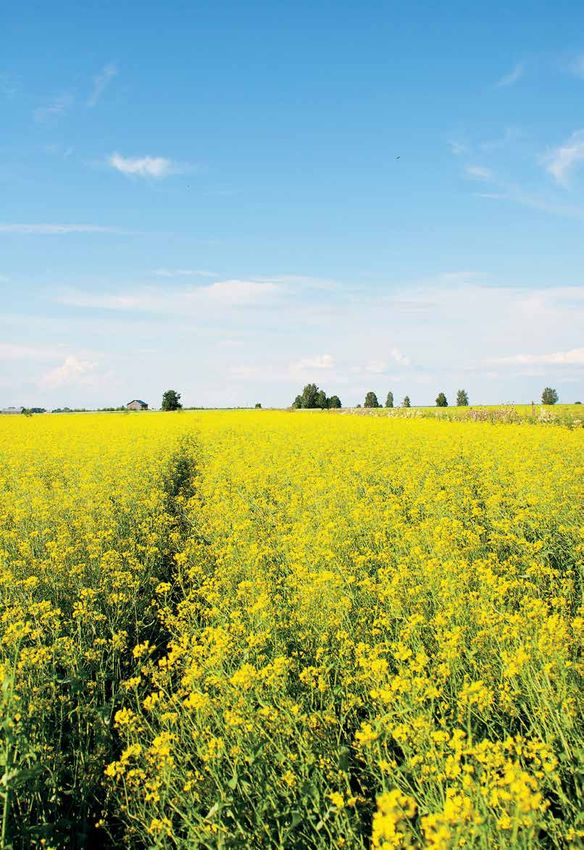
Details about the results of the ARBOR project can be found in separate thematic reports.        Strategy development report
    Project results
                      An overview of the reports that were published within the ARBOR project is given below.
                      These reports can also be consulted online on www.arbornwe.eu.                                   Development of regional strategies for the acceleration of bioenergy in Northwest
                                                                                                                       Europe
                                                                                                                       Based on the findings from numerous case studies as described in the case study reports,
                      Pilots and investment report                                                                     a comprehensive biomass strategy for the region of Northwest Europe was developed.
                                                                                                                       For the different fields of application, including municipal, agricultural and industrial
                      Biomass for Energy in the Northwest European Region: An overview of pilots and                   waste streams, strategic guidelines are formulated within the report. It is described how
                      investments                                                                                      the biomass streams can be used for energy production and which challenges have to
                      A number of pilots and investments were realized within the ARBOR project in order to            be dealt with.
                      showcase good practice examples of biomass utilization that contribute towards the EU
                      20 20 20 targets in a sustainable way. This report gives a description of the different pilots
                      and investments carried out within the project.                                                  Inventory reports

                                                                                                                       Inventory: techniques for nutrient recovery from digestate
                      Case study reports                                                                               The report gives an overview of the inventory made of existing nutrient recovery
                                                                                                                       techniques from digestate in North-West Europe. It also shows how digestate can be
                      Development of Low-Impact Energy Crops                                                           used as a sustainable source of nutrients. A distinction is made between currently used
                      Four types of low-impact energy crops were identified: short rotation coppice, cover             digestate processing techniques and nutrient recovery techniques.
                      crops, biomass-buffer strips, and energy crops on marginal land. These crops were tested
                      at a pilot scale with regard to the multifunctional use, such that the competition for food      Inventory: biomass conversion technologies
                      production is minimized. The applied technology, biomass yield, bottlenecks and other            The report gives an overview of existing methods for gas, liquid and solid biomass
                      aspects are discussed in the report.                                                             conversion in the partner countries. Well-established methods involve producing steam,
                                                                                                                       which is then used to drive a steam engine or turbine generator. Gas turbines have been
                      Development of agro-side streams for bio-energy                                                  used with biomass as well, but have a lower thermal efficiency. In addition to direct
                      The report describes how agricultural residues (straw from maize, leaves from leek               combustion, biomass can be converted into gas fuel via gasification or pyrolysis. For all
                      and stems from Brussels sprouts) can be applied in anaerobic digestion and the use               other biomass with higher moisture content like slurry, it can either be processed in a
                      of manure in small scale digestion. Special attention is given to the challenges related         fermentation or anaerobic digestion system producing biogas.
                      to the collection on-field, the pre-treatment, the storage and the biogas production
                      potential of the different agro-side streams.                                                    Physicochemical characterisation and market analysis of recovered nutrients from
                                                                                                                       digestate
                      Development of synergy parks                                                                     A report was dedicated to the physicochemical properties of digestate and its
                      The report aims to offer insights on collaborative biomass usage within individual               derivatives, as derived from field experiences. The following products were used in the
                      ARBOR-regions. In particular, the report brings together information on common and               ARBOR field trials: ammonium sulphate, the liquid fraction (LF) of digestate, a mixture
                      divergent policies and practices on biomass usage, with a focus on national and regional         of digestate and the LF of digestate, struvite and the effluent of constructed wetlands.
                      policies, applied technologies and potentials for enhanced biomass valorizations.                Results of the field trials and market analysis are described in the report.

                      Nutrient recovery from digestate
                      Different types of recovered products were used in an open field trial and a greenhouse
                      trial. The impact of applying digestate derivatives instead of mineral fertilizers and/or
                      animal manure (traditional fertilization) on crop yield and soil quality were evaluated.
                      Results of the field trials, and the relevant legislation can be found in this report.

                      Development of closed loop systems from biomass valorization by local
                      authorities
                      By means of pilots in different regions, closed loop systems were evaluated: a supply
                      chain of woody biomass by using own wood waste resources and dry digestion of grass
                      from verges by commercial composting units. For the utilization of sewage sludge,
                      greenery cuttings and landscape material, a sustainable strategy was developed. Further,
                      it was investigated how social economy can be integrated in biomass sourcing. Methods
                      and results are described in the report.

6                                                                                                                                                                                                                  7
Biomass for Energy in the North West European Region: statistics, targets and regional case studies - Update of the ARBOR benchmark report ...
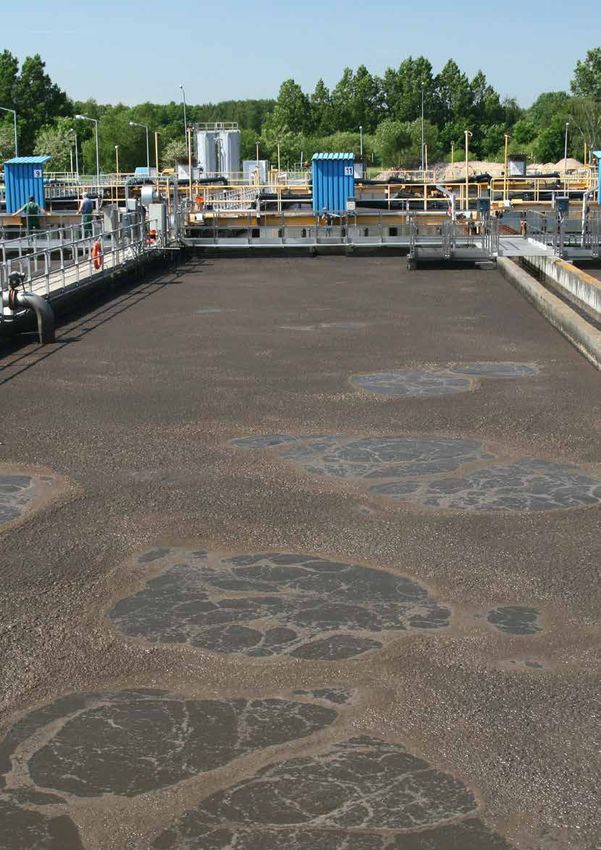
Figure 1:       Evolution of the share renewable energy according (a) to the targets specified
    List of figures
                         		              in the RED (ref. incl. av. red.) and (b) in reality

                         Figure 2:       Evolution of the share renewable energy from biomass according (a) to the targets
                         		              specified in NREAP (ref. incl. av. red.) and (b) in reality

                         Figure 3:       Production of renewable energy (from biomass (shaded areas)) for electricity (yellow),
                         		              heating & cooling (red) and transport (green) in Belgium, Germany, Ireland,
                         		              The Netherlands and United Kingdom for 20131

                         Figure 4:       Planned distribution for Belgium of multiple inputs for renewable energy in 2005,
                         		              2010, 2015 and 2020, divided over three categories: renewable electricity, renewable
                         		              heating & cooling and renewable transport.

                         Figure 5:       Planned distribution for Germany of multiple inputs for renewable energy in 2005,
                         		              2010, 2015 and 2020, divided over three categories: renewable electricity, renewable
                         		              heating & cooling and renewable transport.

                         Figure 6:       Planned distribution for Ireland of multiple inputs for renewable energy in 2005, 2010,
                         		              2015 and 2020, divided over three categories: renewable electricity, renewable heating
                         		              & cooling and renewable transport.

                         Figure 7:       Planned distribution for the Grand Duchy of Luxembourg of multiple inputs
                         		              for renewable energy in 2005, 2010, 2015 and 2020, divided over three categories:
                         		              renewable electricity, renewable heating & cooling and renewable transport.

                         Figure 8:       Planned distribution for The Netherlands of multiple inputs for renewable energy in 2005,
                         		              2010, 2015 and 2020, divided over three categories: renewable electricity, renewable
                         		              heating & cooling and renewable transport.

                         Figure 9:       Planned distribution for the United Kingdom of multiple inputs for renewable energy in 2005,
                         		              2010, 2015 and 2020, divided over three categories: renewable electricity, renewable heating &
                         		              cooling and renewable transport.

             1
                 These diagrams are based on most recent available estimates delivered by the partners of the ARBOR project and Eurostat: for Germany
                 data was retrieved from Bundesministerium for Wirtschaft und Energie (2014), for Ireland from the SEAI (2014), for Luxembourg from STATEC
                 and “Statictics from Institut Luxembourgeois de Régulation et Administration de l’Environnement” (2014), for United Kingdom from the
                 Department of Energy and Climate Change (2014), for The Netherlands Centraal bureau voor de statistiek (2014) .

8                                                                                                                                                            9
Biomass for Energy in the North West European Region: statistics, targets and regional case studies - Update of the ARBOR benchmark report ...
Table 1:    Overall renewable energy targets from the RED (share renewable energy in gross final energy 		                           ARBOR      Accelerating Renewable Energies    LNG		    Liquified natural gas
     List of tables

                                                                                                                                   List of abbreviations
                      		          consumption (%).
                                                                                                                                                           		         through valorisation of Biogenic   LPG		    Liquified petroleum gas
                      Table 2:    NREAP targets for biomass specified by countries to achieve the targets for renewable energy                             		         Organic Raw Material               LoW		    European List of waste
                      		          by 2020 (%).
                                                                                                                                                           AEBIOM     European Biomass Assocation        MAP		    Market incentive program
                      Table 3:    Renewable energy efforts (presented as a factor=(target 2020)/(situation 2010 or 2013)) still
                      		          to be made by the countries till 2020.                                                                                   Av. red.   Aviation reduction                 NGO		    Non-governmental organisation
                                                                                                                                                           BOS		      Biofuel Obligation Scheme          NREAP    National renewable energy
                      Table 4:    Bio-energy efforts (presented as a factor=(target 2020)/( situation 2010 or 2013)) still to be
                      		          made by the countries till 2020.                                                                                         CHP		      Combined heat and power            		       action plan

                      Table 5:    Domestic resource of biomass in 2006 (ktoe)                                                                              DECC       Department of Energy and           NTA		    Netherlands Technical Approach
                                                                                                                                                           		         Climate Change                     ORC		    Organic Rankine Cycle
                      Table 6:    Expected amount (best scenario) of domestic resource in 2015 (ktoe)
                                                                                                                                                           EC		       European Commission                PEFC     Programme for the Endorsement
                      Table 7:    Expected amount (best scenario) of domestic resource in 2020 (ktoe)
                                                                                                                                                           EEG		      German Renewable Energy Act        		       of Forest Certification
                      Table 8:    Domestic resource of biomass in 2009 (ktoe)                                                                              EU		       European Union                     Ref		    Reference scenario

                      Table 9:    Domestic resource of biomass in 2010 (ktoe)                                                                              FIT		      Feed-in tarif                      SRC		    Short rotation coppice
                                                                                                                                                           FQD		      Fuel Quality Directive             SRF		    Solid recovered fuels
                      Table 10:   Domestic resource in 2011 (ktoe)
                                                                                                                                                           FSC		      Forest stewardship council         SEI		    Sustainable Energy Ireland
                      Table 11:   Domestic resource in 2012 (ktoe)
                                                                                                                                                           GEC		      Green electricity certificates     SEAI		   Sustainable Energy Authority
                      Table 12:   Land used in 2006-2009-2010 for low-impact energy crops
                                                                                                                                                           GHG		      Greenhouse gas                     		       Ireland
                      Table 13:   Net savings of GHG emission by use of renewable energy in Belgium (t CO2 eq.)                                            GWh		      Gigawatthour                       RED		    Renewable energy directive

                      Table 14:   Net savings of GHG emission by use of renewable energy in Germany (Mt CO2 eq.)                                           HWRC       Household waste recycling centre   		       2009/28/EC
                                                                                                                                                           KGW		      Kitchen and Garden Waste           RES		    Share of renewable energy
                      Table 15:   Net savings of GHG emission by use of renewable energy in Luxembourg (t CO2 eq.)
                                                                                                                                                           Ktoe		     kiloton oil equivalent             RHI		    Renewable Heat Initiative
                      Table 16:   Net savings of GHG emission by use of renewable energy in Ireland (t CO2 eq.)
                                                                                                                                                           ILUC		     Indirect land-use change           RO		     Renewable Obligation
                      Table 17:   Net savings of GHG emission by use of renewable energy in The Netherlands (t CO2 eq.)
                                                                                                                                                           IPPC		     Integrated Pollution Prevention    WFQA     Wood Fuel Quality Assurance
                      Table 18:   Net savings of GHG emission by use of renewable energy in the United Kingdom (t CO2 eq.)                                 		         Control                            		       Certification
                                                                                                                                                           ISCC		     International sustainability       WFTC     Wood Fuel Trading and Consulting
                                                                                                                                                           		         carbon certification

10                                                                                                                                                                                                                                                   11
Biomass for Energy in the North West European Region: statistics, targets and regional case studies - Update of the ARBOR benchmark report ...
This report describes the framework for the development of biomass use in North West Europe and

     Introduction
                    is the starting point of the concluding documents for ARBOR, an Interreg IVB project for North-West
                    Europe. ARBOR stands for Accelerating Renewable Energies through valorisation of Biogenic Organic
                    Raw Material. It was approved in March 2011 as a strategic initiative for a duration of 4 years. The
                    different ARBOR-partners are:

                    • From Belgium: FlandersBio, Ghent University, Inagro, Provincial Development Agency West
                      Flanders (POM West-Vlaanderen), Flemish Coordination Centre for Manure Processing (VCM)
                    • From Germany: Institute for Future Energy Systems (IZES) gGmbH
                    • From Ireland: University College Dublin (NUID - UCD)
                    • From Luxembourg: Luxembourg Institute of Science and Technology (LIST), formerly known as
                      the Public Research Centre Henri Tudor (CRP Henri Tudor)
                    • From The Netherlands: DLV Plant BV, Province of Utrecht, Wageningen University
                    • From the UK: Stoke-on-Trent city Council, Staffordshire University (lead partner)
                    Total budget for ARBOR is € 7 361 959.

                    The framework for ARBOR are the EU 202020 targets in order to mitigate climate change and the fact
                    that biomass accounts for 50% of the renewables in Europe. Although a lot of expertise concerning
                    biomass is available, it is noted that this information is not disseminated in a coordinated way, nor is
                    it related to commercial exploitations. That is why the ARBOR-mission is to accelerate the sustainable
                    development and use of biomass in North West Europe, to facilitate the achievement of the EU 20 20
                    20 objectives and to realise a world-class utilisation of biomass.

                    The aim of this document, as a part of the total ARBOR-project, is to get a comprehensive assessment
                    on the use of biomass for bio-energy in the project regions prior to the project take-off (2005) and at
                    the final stage of the project, based on the most recent data available (2013).

                    Data was gathered by means of a questionnaire that was filled out by the different partners. Another
                    important source of information was the National Renewable Energy Action Plans (NREAP) that every
                    Member State had to make in order to comply with article 4 of the Renewable Energy Directive
                    (2009/28/EC) and the data available throughout SHARES, short assessment of renewable energy
                    sources, from Eurostat.

                    Other frequently consulted documents/websites, are:

                    - Beurskens, L.W.M., Hekkenberg, M. & Vethman, P. (2011). Renewable Energy Projections as
                      published in the National Renewable Energy Action Plans of the European Member States
                      covering all 27 EU Member States with updates for 20 Member States.
                      Version of 28th November 2011. European Environment Agency, 270p.
                    - Directive 2009/28/EC of the European Parliament and of the Council of 23 April 2009 on the
                      promotion of the use of energy from renewable sources and amending and subsequently
                      repealing Directives 2001/77/EC and 2003/30/EC
                    - www.aebiom.org

                    The initial report and the update was composed by Inagro (Greet Ghekiere, Anke De Dobbelaere,
                    Brecht Annicaert) and POM West-Vlaanderen (Geert Dangreau, Viooltje Lebuf, Brecht Vanhecke,
                    Lien Loosvelt). FlandersBio (Willem Dhooge) took care of the final lay-out.

12                                                                                                                             13
Biomass for Energy in the North West European Region: statistics, targets and regional case studies - Update of the ARBOR benchmark report ...
Chapter 1 – Statistics and targets of
     renewable energy and bio-energy                                                                                                                                                                                                            Targets NREAP
                                                                                                                                                                                                                                                         Targets
                                                                                                                                                                                                                                                               %NREAP
                                                                                                                                                                                                                                                                 renewable
                                                                                                                                                                                                                                                                      % renewable
                                                                                                                                                                                                                                                                           energy energy
                                                                                                                                                                                                                                                                               (reference scenario
                                                                                                                                                                                                                                                                                           (reference
                                                                                                                                                                                                                                                                                                   + av.
                                                                                                                                                                                                                                                                                                      scenario
                                                                                                                                                                                                                                                                                                         red.) + av. red.)
                                                                                                                                                                                                                                                                                                                                                                                                 Renewable
                                                                                                                                                                                                                                                                                                                                                                                                        Renewable
                                                                                                                                                                                                                                                                                                                                                                                                           energy share
                                                                                                                                                                                                                                                                                                                                                                                                                   energy share

                                                                                                                                                                                        Share in renewable energy in total

                                                                                                                                                                                                                                                                                                                                                 share in renewable energy in total
                                                                                                                                                                                        national energy consumption (%)

                                                                                                                                                                                                                                                                                                                                                 natioanl energy consumption (%)
                                                                                                                                                                                                                                    20              20                                                                                              20                                     20
                                                                                                                                                                                                                                    18              18                                                                                              18                                     18
                                                                                                                                                                                                                                    16              16                                                                                              16                                     16
                                                                                                                                                                                                                                    14              14                                                                                              14                                     14
                                                                                                                                                                                                                                    12              12                                                                                              12                                     12
                                                                                                                                                                                                                                    10              10                                                                                              10                                     10
     1.1 Targets for renewable energy and bio-energy to 2020                                                                                                                                                                         8                      8                                                                                                8                              8
                                                                                                                                                                                                                                     6                      6                                                                                                6                              6
     In table 1 the targets for renewable energy from the renewable energy directive 2009/28/EC (RED) are shown,                                                                                                                     4                      4                                                                                                4                              4
     including the trajectories to be followed.                                                                                                                                                                                      2                      2                                                                                                2                              2
                                                                                                                                                                                                                                     0                      0                                                                                                0                              0
                                                                                                                                                                                                                                         2005                           2005
                                                                                                                                                                                                                                                                          2010              2010
                                                                                                                                                                                                                                                                                              2015            2015
                                                                                                                                                                                                                                                                                                                2020            2020                                     2005             2008 2005
                                                                                                                                                                                                                                                                                                                                                                                                 2010 2008
                                                                                                                                                                                                                                                                                                                                                                                                        2013 2010
                                                                                                                                                                                                                                                                                                                                                                                                               2015 2013
                                                                                                                                                                                                                                                                                                                                                                                                                      2018 2015
                                                                                                                                                                                                                                                                                                                                                                                                                             2020 2018       2020
                                       Table 1: Overall renewable energy targets from the RED
                                 (share of renewable energy in gross final energy consumption (%)).2                                                                                                                                                                                        Year (a)        Year (a)                                                                                         Year (b)      Year (b)

                                                                                                                                                                                                                                                                                        Figure 1: Evolution
                                                                                                                                                                                                                                                                                                       Figure
                                                                                                                                                                                                                                                                                                            of the
                                                                                                                                                                                                                                                                                                               1: Evolution
                                                                                                                                                                                                                                                                                                                   share renewable
                                                                                                                                                                                                                                                                                                                            of the share
                                                                                                                                                                                                                                                                                                                                     energy
                                                                                                                                                                                                                                                                                                                                         renewable
                                                                                                                                                                                                                                                                                                                                            according
                                                                                                                                                                                                                                                                                                                                                   energy
                                                                                                                                                                                                                                                                                                                                                      (a) toaccording
                                                                                                                                                                                                                                                                                                                                                             the targets
                                                                                                                                                                                                                                                                                                                                                                      (a)specified
                                                                                                                                                                                                                                                                                                                                                                          to the targets
                                                                                                                                                                                                                                                                                                                                                                                   in    specified in
           			                                2005           2010                                 2015   2020                                                                                                                             Figure 1: Evolution of the share in renewable energy according (a) to the targets specified
           Belgium		                           2.2                4.4                             7.1    13.0                                                                                                                                                     in the RED (ref. incl. av. red.) and (b) in reality
           Germany		                           5.8                8.2                             11.3   18.0
           Ireland		                           3.1                5.7                             8.9    16.0
           Luxembourg		                        0.9                2.9                             5.4    11.0
           The Netherlands                     2.4                4.7                             7.6    14.0
                                                                                                                                                                                                                                            Targets
                                                                                                                                                                                                                                   Targets NREAP    NREAP % renewable
                                                                                                                                                                                                                                                 % renewable           energy
                                                                                                                                                                                                                                                             energy from      from biomass
                                                                                                                                                                                                                                                                         biomass                                                                                                                    Bio-energyBio-energy
                                                                                                                                                                                                                                                                                                                                                                                                               share     share

                                                                                                                                                                                        Share renewable energy from biomass in

                                                                                                                                                                                                                                                                                                                                                 Share renewable energy from biomass in
                                                                                                                                                                                         total national energy consumption (%)
           United Kingdom                      1.3                4.0                             7.5    15.0

                                                                                                                                                                                                                                                                                                                                                  total national energy consumption (%)
                                                                                                                                                                                                                                                                                        (reference
                                                                                                                                                                                                                                                                           (reference scenario + av.scenario
                                                                                                                                                                                                                                                                                                     red.) + av. red.)
                                                                                                                                                                                                                                                                                                                                                 20                                        20
                                                                                                                                                                                                                                    12                   12
                                                                                                                                                                                                                                                                                                                                                 18                                        18
     In their National Renewable Energy Action Plan (NREAP) countries have specified till 2020 how much of the
                                                                                                                                                                                                                                    10                   10                                                                                      16                                        16
     renewable energy will be coming from biomass. In table 2 these ‘targets for bio-energy’ are summarised. 3
                                                                                                                                                                                                                                                                                                                                                 14                                        14
                                                                                                                                                                                                                                     8                           8                                                                               12                                        12
                                                                                                                                                                                                                                                                                                                                                 10                                        10
                              Table 2: NREAP targets for bio-energy specified by countries to achieve                                                                                                                                6                           6
                                                                                                                                                                                                                                                                                                                                                        8                                    8
                                          the targets for renewable energy by 2020 (%).                                                                                                                                              4                           4                                                                                      6                                    6
                                                                                                                                                                                                                                                                                                                                                        4                                    4
           			                                2005           2010                                 2015   2020                                                                                                                        2                           2
                                                                                                                                                                                                                                                                                                                                                        2                                    2

           Belgium		                           1.7                3.1                              5.2   8.9                                                                                                                         0                           0                                                                                      0                                    0
                                                                                                                                                                                                                                         2005                               2005
                                                                                                                                                                                                                                                                             2010            2010
                                                                                                                                                                                                                                                                                             2015              2015
                                                                                                                                                                                                                                                                                                                2020             2020                                2005                 2008 2005
                                                                                                                                                                                                                                                                                                                                                                                                2010 2008
                                                                                                                                                                                                                                                                                                                                                                                                      2013 2010
                                                                                                                                                                                                                                                                                                                                                                                                           2015        2013
                                                                                                                                                                                                                                                                                                                                                                                                                       2018 2015
                                                                                                                                                                                                                                                                                                                                                                                                                             2020     2018   2020
           Germany		                           4.5                6.9                              7.8   9.9
                                                                                                                                                                                                                                                                                            Year (a)         Year (a)                                                                                       Year (b)       Year (b)
           Ireland		                           1.5                2.8                              5.4   6.9
           Luxembourg		                        0.5                1.6                              3.2   6.7
           The Netherlands                     2.0                3.1                              5.3   7.5
           United Kingdom                      0.9                1.7                              3.3   7.3                                                                                                                                      Figure 2: Evolution of the share in renewable energy from biomass according (a)
                                                                                                          Total national energy consumption                                                                                                                              Total national
                                                                                                                                                                                                                                                        to the targets specified in NREAPenergy     consumption
                                                                                                                                                                                                                                                                                           (ref. incl. av. red.) and (b) in reality
                                                                                                               (reference scenario + aviation reduction)                                                                                                                                      (additional energy efficiency scenario + aviation reduction)
     Based on the most recent available national statistic,125
                                                            an overview can be made of the current share of renewable                                                                                                            On the basis of the national
                                                                                                                                                                                                                                                       125     statistics (figure 1) and the targets (table
     energy and bio-energy. This can be seen in figure 1b and 2b and compared with the targetted shares in figure                                                                                                                1) it can be concluded   that all countries except The Netherlands are
                                                           120                                                                                                  Belgium                                                                                120
     1a and 2a for the different partner countries. It is clear that bio-energy will account for an important share of                                                                                                           well on track in reaching the targets for renewable energy according                                                                                                                   Belgium
                                                              amount of energy in 2005 (=100%)

                                                                                                                                                                                                                                                 amount of energy in 2005 (=100%)
                                                              Amount of energy (%) against the

                                                                                                                                                                                                                                                 Amount of energy (%) against the
     renewable energy in the near future.                  115                                                                                                                                                                   to their intermediate115targets of 2010 and 2013. Nevertheless most
                                                                                                 110                                                            Germany                                                          countries predicted 110an exponential growth in renewable energy                                                                                                                       Germany
                                                                                                                                                                                                                                 production and thus the largest rise in share for the period 2015-
                                                                                                 105                                                                                                                                                   105
                                                                                                                                                                Ireland                                                          2020 this is, however, not reflected in the statistics. This can be                                                                                                                    Ireland
                                                                                                 100                                                                                                                             seen in table 3 where 100the efforts for the year 2010 and 2013 in
     2
         The targets shown for 2010 and 2015 are these calculated for the95 respective trajectory periods 2011-2012 and 2015-2016 following the                                                                                  comparison with the target
                                                                                                                                                                                                                                                          95    for 2020 are displayed. The data gives a
                                                                                                                                                                Grand Duchy of                                                                                                                                                                                                                                          Luxembourg
         equations defined in the RED: S2005+0,20*(S2020-S2005) for 2011-2012 and S2005+0,45*(S2020-S2005) for 2015-2016. The share of renewable
                                                                                                                                                                Luxembourg                                                       clear indication that in 2013 the United Kingdom, The Netherlands
                                                                         90
         energy is the amount of renewable energy in gross final energy consumption   after a reduction for aviation is applied for some countries as                                                                            and Luxembourg have90achieved a third of their renewable energy
         defined in the RED.                                             85                                                                                     Netherlands                                                      target for 2020 while Ireland
                                                                                                                                                                                                                                                          85      is halfway and Belgium and Germany                                                                                                                    Netherlands
     3
                                                                              80 of bio-energy in final energy consumption according to the reference
         The targets for bio-energy, as we will call them here, are the amounts
                                                                                                                                                                                                                                 have reached almost two  80 thirds   of their targets.
         scenario without aviation reduction (when applicable) (reference: Beurskens      2005               2010 the data for
                                                                                            et al. (2011)), since           2015              2020 did not
                                                                                                                               the actual situation                    United Kingdom                                                                                                                2005                 2010                  2015                                             2020                   United Kingdom
         include aviation reduction and are based on final energy consumption. When comparing the shares of renewable energy with those of
         bio-energy this means that for some countries the share of biomass in gross final energy consumption           Year
                                                                                                                          would be a bit smaller than the                                                                                                                                                                                 Year
         shares based on final energy consumption. In short: when comparing the shares of renewable energy with bio-energy, bio-energy can be
         a little underestimated for some countries. The Netherlands don’t have a reference scenario so numbers are based on the additional energy
                                                                         Figure 3: Evolution of gross final energy consumption in the reference scenario, incl. aviation reduction.                                                              Figure 4: Evolution of gross final energy consumption in the additional energy efficiency scenario, incl. aviation reduction.
         efficiency scenario.
14                                                                                                                                                                                                                                                                                                                                                                                                                                                  15
Biomass for Energy in the North West European Region: statistics, targets and regional case studies - Update of the ARBOR benchmark report ...
Table 3: Renewable energy efforts (presented as a factor = (target 2020)/(situation 2010 or 2013))                   1.3 Renewable (bio-)energy for electricity, heating or cooling
                                      still to be made by the countries till 2020.
                                                                                                                                     and biogenic fuels
                                                                                                                                 Biomass and other renewable sources are used to produce electricity, heat (or cooling) and biogenic fuels.
          Efforts               Belgium      Germany         Ireland      Luxembourg          The Netherlands   United Kingdom   In figure 3 it is shown how inputs are divided over these three categories:

          Renewable                2,3           1,7           2,9              3,8                 3,8              4,6
          energy                                                                                                                      Figure 3: Production of renewable energy (from biomass (shaded areas)) for electricity (yellow),
          Situation 2010                                                                                                                heating & cooling (red) and transport (green) in Belgium, Germany, Ireland, The Netherlands
                                                                                                                                                                       and United Kingdom for 2013 6
          Renewable                1,6           1,5           2,1              3,1                 3,1              2,9
          energy
          Situation 2013                                                                                                                                United Kingdom: 2013                                Germany: 2013
                                                                                                                                                                     3%                                       5% 1%
                                                                                                                                                         13%

      For bio-energy Germany, Belgium, Luxembourg and the United Kingdom are well on track as can be seen from
                                                                                                                                                                                        29%
     table 2 and figure 2. Ireland and The Netherlands do not reach their intermediate targets for bio-energy set out in                          10%
     the NREAP. Similar conclusions can be drawn towards the bio-energy statistics and targets where the fastest growth                                                                                                             33%
     of renewables is foreseen for the period in 2015-2020 but on the other hand statistics show a slower growth or                                                                           36%
     even a stagnation for bio-energy production. In table 4 this is demonstrated by putting the effort needed to reach
     the targets of 2020 for bio-energy. For Germany, Ireland and Netherlands this data shows a small progress in regard
     to the efforts made between 2010 and 2013 for reaching the targets in 2020.
                                                                                                                                                                                                                            15%
                                                                                                                                                        69%           46%                             61%        10%

                  Table 4: Bio-energy efforts (presented as a factor=(target 2020)/( situation 2010 or 2013))
                                          still to be made by the countries till 2020.                                                                  The Netherlands: 2013                               Ireland: 2013
                                                                                                                                                                      1%                                      5% 0,5%
                                                                                                                                                              8%

          Efforts               Belgium      Germany         Ireland      Luxembourg          The Netherlands   United Kingdom                                                          21%
                                                                                                                                                                                               24%

          Renewable                2,0           1,4           2,3              2,9                 3,3              3,0                                                                                                            54%
                                                                                                                                                 34%
          energy from
          Biomass
          Situation 2010                                                                                                                                                                22%
                                                                                                                                                                                                    12%

          Renewable                1,5           1,3           2,1              2,4                 3,1              2,3                                                                                    5%
                                                                                                                                                        69%               13%                         41%
          energy from
          Biomass
          Situation 2013                                                                                                                                  Luxembourg: 2013                                  Belgium: 2013
                                                                                                                                                                   3% 2%                                         2% 1%
                                                                                                                                                                                  15%
                                                                                                                                                                                                                              19%

                                                                                                                                                                                        6%
     1.2 Targets for renewable energy and bio-energy to 2030 and 2050                                                                             36%

                                                                                                                                                                                              51%
     For 2030 the EU stated that the share of renewable energy should be at least 27 %, and together with a increased                                                                                                               33%
     energy efficiency achieving a 40 % reduction in greenhouse gas (GHG) emissions. In this 2030 framework it is
     further mentioned that in regard to biomass use the focus is on the deployment of second and third generation
     biofuels and on the development of an improved biomass policy to maximise the resource efficient use of biomass
                                                                                                                                                                                                                            12%
     in order to deliver robust and verifiable GHG savings.4                                                                                            80%                 38%                       78%

     The EU 2050 roadmap towards a low carbon economy attributes a great role for renewable energy from domestic
     resources such as local biomass in achieving the 80 % reduction of GHG emission.5
                                                                                                                                 From these diagrams it can be concluded that for all six countries, with exception of Ireland, biomass is used to
                                                                                                                                 produce more than half of the renewable energy. In the United Kingdom, biomass is mainly used for electricity
                                                                                                                                 production, while in Belgium, Germany and Ireland it is mainly used for heating and cooling. In Luxembourg the
     4
         COM(2014)15 “A policy framework for climate and energy in the period from 2020 to 2030”                                 largest share of biomass goes to the production biofuels.
         eur-lex.europa.eu/legal-content/EN/ALL/?uri=CELEX:52014DC0015

     5
         COM(2011) 112 “A Roadmap for moving to a competitive low carbon economy in 2050”                                                Renewable electricity        Renewable heating and cooling         Renewable transport       Energy from biomass
         eur-lex.europa.eu/legal-content/EN/TXT/?uri=CELEX:52011DC0112
16                                                                                                                                                                                                                                                          17
Biomass for Energy in the North West European Region: statistics, targets and regional case studies - Update of the ARBOR benchmark report ...
1.4 Overview biomass targets divided in three categories: renewable                                                                                                                                           Germany: planned distribution of multiple inputs for renewable energy
                                          electricity, renewable heating and cooling and renewable transport                                                                                                                                                          in 2005, 2010, 2015 and 2020.

                                      In the following figures for the three categories (electricity, heating & cooling and transport) an overview 7 (for the
                                      six countries) is given of the evolution of the distribution of renewable energy coming from multiple inputs for the
                                      years 2005, 2010, 2015 and 2020. Again it can be concluded that biomass is expected to produce a large share of the
                                      renewable energy in the future. Next to the planned evolution the actual situation 8 in 2013 is given for comparison.                                                                                             Renewable electricity                        Renewable heating                                Renewable transport
                                                                                                                                                                                                                                                                                                        and cooling
                                                                                                                                                                                                                                                20000                                       250                                             250
                                                                                                                                                                                                                                                18000

                                                                                                                                                                                                   Amount of energy (TWh)
                                                               Other renewables                                            Solid biomass                           Biodiesel                                                                    16000                                       200                                             200

                                                                                                                                                                                                                   Amount of energy (TWh)
                                                                                                                                                                                                                                                14000
                                                               Biogas                                                      Other biofuels                                                                                                       12000                                       150                                             150
                                                                                                                                                                                                                                                10000
                                                               Liquid biomass + other biogenic                             Bioethanol                                                                                                           8000                                        100                                             100
                                                                                                                                                                                                                                                6000
                                                                                                                                                                                                                                                4000                                         50                                              50
                                                                                                                                                                                                                                                2000
                                                                                                                                                                                                                                                   0                                          0                                                0
                                                                                                                                                                                                                                                         2005 2010 2015 2020 Statistics           2005 2010 2015 2020 Statistics                    2005 2010      2015 2020 Statistics
                                                      Belgium: planned distribution of multiple inputs for renewable energy                                                                                                                                                    2013                                     2013                                                   2013

                                                                         in 2005, 2010, 2015 and 2020.                                                                                                                                                              Year                                          Year                                                Year

                                                                                                                                                                                                            Figure 5: Planned distribution for Germany of multiple inputs for renewable energy in 2005, 2010, 2015
                                                                                                                                                                                                                                     Figure 8: Planned distribution for Germany of multiple inputs for renewable energy in 2005, 2010, 2015 and 2020,
                                                                                                                                                                                                               divided overand    2020, divided
                                                                                                                                                                                                                            three categories:             over three
                                                                                                                                                                                                                                              renewable electricity,        categories:
                                                                                                                                                                                                                                                                     renewable                 renewable
                                                                                                                                                                                                                                                                               heating & cooling                 electricity,
                                                                                                                                                                                                                                                                                                 and renewable transport.          renewable
                                                                                                                                                                                                                                                                                                                          Comparison                  heating
                                                                                                                                                                                                                                                                                                                                       with state-of-the-art        & 2010.
                                                                                                                                                                                                                                                                                                                                                             data from
                                                                                                                                                                                                                           cooling and renewable transport. Comparison with state-of-the-art data from 2013.
                                               Renewable electricity                                   Renewable heating                               Renewable transport
                                                                                                          and cooling
                                 35                                                   3500                                                  35

                                 30                                                   3000                                                  30
                         (TWh)

                                                                                                                                                                                                                                                        Ireland: planned distribution of multiple inputs for renewable energy
                       (TWh)

                                 25                                                   2500                                                  25
                                                                                                                                                                                                                                                                           in 2005, 2010, 2015 and 2020.
                energy
             of energy

                                 20                                                   2000                                                  20
      Amount of

                                 15                                                   1500                                                  15
                                                                                                                                                                                                                                                                                                      Renewable heating
     Amount

                                                                                                                                                                                                                                                          Renewable electricity                                                                        Renewable transport
                                 10                                                   1000                                                  10                                                                                                                                                           and cooling
                                                                                                                                                                                                                                                  16                                         16                                              16
                                  5                                                     500                                                  5                                                                                                                                               14
                                                                                                                                                                                                                                                  14                                                                                         14

                                                                                                                                                                                                   Amount of energy (TWh)
                                  0                                                       0                                                  0                                                                                                    12                                         12                                              12

                                                                                                                                                                                                                       Amount of energy (TWh)
                                            2005    2010   2015    2020 Statistics              2005    2010    2015     2020 Statistics           2005     2010      2015     2020   Statistics
                                                                          2013                                                  2013                                                    2013                                                      10                                         10                                              10
                                                           Year                                                   Year                                                  Year                                                                                                                  8
                                                                                                                                                                                                                                                   8                                                                                          8

                                                                                                                                                                                                                                                   6                                          6                                               6
                                          Figure 4: Planned
                                                        Figuredistribution          forforBelgium
                                                               7: Planned distribution                 of multiple
                                                                                           Belgium of multiple              inputsenergy
                                                                                                               inputs for renewable   for inrenewable
                                                                                                                                              2005, 2010, 2015energy
                                                                                                                                                              and 2020, in 2005, 2010, 2015
                                                           divided over three categories: renewable electricity, renewable heating & cooling and renewable transport.
                                                    and 2020,     divided over three categories: renewable electricity, renewable heating &                                                                                                        4                                          4                                               4
                                                                                           cooling and renewable transport.                                                                                                                        2                                          2                                               2

                                                                                                                                                                                                                                                   0                                          0                                               0
                                                                                                                                                                                                                                                        2005 2010    2015 2020 Statistics          2005    2010 2015 2020 Statistics                 2005 2010      2015 2020 Statistics
                                                                                                                                                                                                                                                                                 2013                                       2013                                                2013

                                                                                                                                                                                                                                                                    Year                                           Year                                                Year
                                      6
                                          These diagrams are based on most recent available estimates delivered by the partners of the ARBOR project and Eurostat: for Germany
                                          data was retrieved from Bundesministerium for Wirtschaft und Energie (2014), for Ireland from the SEAI (2014), for Luxembourg from STATEC
                                                                                                                                                                                                                                                           Figure 9: Planned distribution for Ireland of multiple inputs for renewable energy in 2005, 2010, 2015 and 2020,
                                          and “Statictics from Institut Luxembourgeois de Régulation et Administration de l’Environnement” (2014), for United Kingdom from the                                                      divided over three categories: renewable electricity, renewable heating & cooling and renewable transport. Comparison with state-of-the-art data from 2010.
                                          Department of Energy and Climate Change (2014), for The Netherlands Centraal bureau voor de statistiek (2014) .                                                            Figure 6: Planned distribution for Ireland of multiple inputs for renewable energy in 2005, 2010, 2015
                                      7
                                          Data are based on the data mainly coming from the NREAP according to: Beurskens et al. (2011).
                                      8
                                          EUROSTAT SHARES, short assessment of renewable energy sources (2014)
                                                                                                                                                                                                                        and 2020, divided over three categories: renewable electricity, renewable heating & cooling and
                                          ec.europa.eu/eurostat/web/energy/data/shares                                                                                                                                              renewable transport. Comparison with state-of-the-art data from 2013.

18                                                                                                                                                                                                                                                                                                                                                                                                19
Luxembourg: planned distribution of multiple inputs for renewable energy                                                                                         United Kingdom: planned distribution of multiple inputs for renewable energy
                                                                   in 2005, 2010, 2015 and 2020.                                                                                                                                      in 2005, 2010, 2015 and 2020.

                                                       Renewable electricity                     Renewable heating                       Renewable transport                                                                                                                            Renewable heating                      Renewable transport
                                                                                                    and cooling                                                                                                                              Renewable electricity                         and cooling
                                                                                                                                                                                                                                       140                                      140                                      140

                                                3,0                                       3,0                                      3,0
        Amount of energy (TWh)

                                                                                                                                                                                        Amount of energy (TWh)
                                                                                                                                                                                                                                       120                                      120                                      120

                                                2,5                                       2,5                                      2,5                                                                                                 100                                      100                                      100
                       Amount of energy (TWh)

                                                                                                                                                                                                            Amount of energy (TWh)
                                                2,0                                       2,0                                      2,0                                                                                                  80                                       80                                       80

                                                1,5                                       1,5                                      1,5                                                                                                  60                                       60                                       60

                                                1,0                                       1,0                                      1,0                                                                                                  40                                       40                                       40

                                                0,5                                       0,5                                      0,5                                                                                                  20                                       20                                       20

                                                0,0                                       0,0                                      0,0                                                                                                   0                                        0                                        0
                                                      2005 2010    2015 2020 Statistics         2005   2010 2015 2020 Statistics         2005 2010     2015 2020 Statistics                                                                  2005 2010   2015 2020 Statistics         2005   2010 2015 2020 Statistics         2005   2010   2015   2020 Statistics
                                                                               2013                                     2013                                       2013                                                                                              2013                                     2013                                         2013

                                                                     Year                                     Year                                      Year                                                                                             Year                                      Year                                      Year

      Figure 7: Planned distribution for Luxembourg of multiple inputs for renewable energy in 2005, 2010,                                                                             Figure 9: Planned distribution for the United Kingdom of multiple inputs for renewable energy in 2005,
      Figure 10: Planned distribution for Luxembourg of multiple inputs for renewable energy in 2005, 2010, 2015 and 2020, divided over three categories: renewable electricity,            Figure 12: Planned distribution for the United Kingdom of multiple inputs for renewable energy in 2005, 2010, 2015 and 2020, divided over three categories:
      2015 and 2020, divided                   over
                                        renewable      three
                                                  heating        categories:
                                                          & cooling                renewable
                                                                    and renewable transport. Comparisonelectricity,      renewable
                                                                                                         with state-of-the-art              heating & cooling and
                                                                                                                               data from 2005.                                         2010, 2015 and         2020,electricity,
                                                                                                                                                                                                           renewable    divided       overheating
                                                                                                                                                                                                                                  renewable   three    categories:
                                                                                                                                                                                                                                                   & cooling  and renewablerenewable        electricity,
                                                                                                                                                                                                                                                                              transport. Comparison           renewable
                                                                                                                                                                                                                                                                                                    with state-of-the-art         heating
                                                                                                                                                                                                                                                                                                                          data from 2009.     & cooling
                                renewable transport. Comparison with state-of-the-art data from 2012.                                                                                                      and renewable transport. Comparison with state-of-the-art data from 2013.

                                           The Netherlands: planned distribution of multiple inputs for renewable energy
                                                                 in 2005, 2010, 2015 and 2020.

                                                      Renewable electricity                       Renewable heating                       Renewable transport
                                                                                                     and cooling

                                                 60                                        60                                       60
        Amount of energy (TWh)

                                                 50                                        50                                       50
                      Amount of energy (TWh)

                                                 40                                        40                                       40

                                                 30                                        30                                       30

                                                 20                                        20                                       20

                                                 10                                        10                                       10

                                                  0                                         0                                        0
                                                      2005 2010    2015 2020 Statistics         2005   2010 2015 2020 Statistics         2005   2010   2015    2020 Statistics
                                                                               2013                                     2013                                          2013

                                                                  Year                                        Year                                        Year

                                                                                                                                                                                                                                     Biomass is expected to produce a large share
                                                                                                                                                                                                                                     of the renewable energy in the future.
     Figure 11: Planned distribution for the Netherlands of multiple inputs for renewable energy in 2005, 2010, 2015 and 2020, divided over three categories: renewable electricity,
         Figure 8: Planned distribution for The Netherlands of multiple inputs for renewable energy in 2005,
                                         renewable heating & cooling and renewable transport. Comparison with state-of-the-art data from 2010.
       2010, 2015 and 2020, divided over three categories: renewable electricity, renewable heating & cooling
                      and renewable transport. Comparison with state-of-the-art data from 2013.

20                                                                                                                                                                                                                                                                                                                                                                    21
Chapter 2 - Origin and sustainability of biomass

     2.1 Evolution of local biomass                                                                                                          Table 7: Expected amount (best scenario) of domestic resource in 2020 (ktoe) 9

     2.1.1 Reference and target scenario
                                                                                                                                                    Belgium    Germany      Ireland     Luxembourg       The Netherlands        United Kingdom
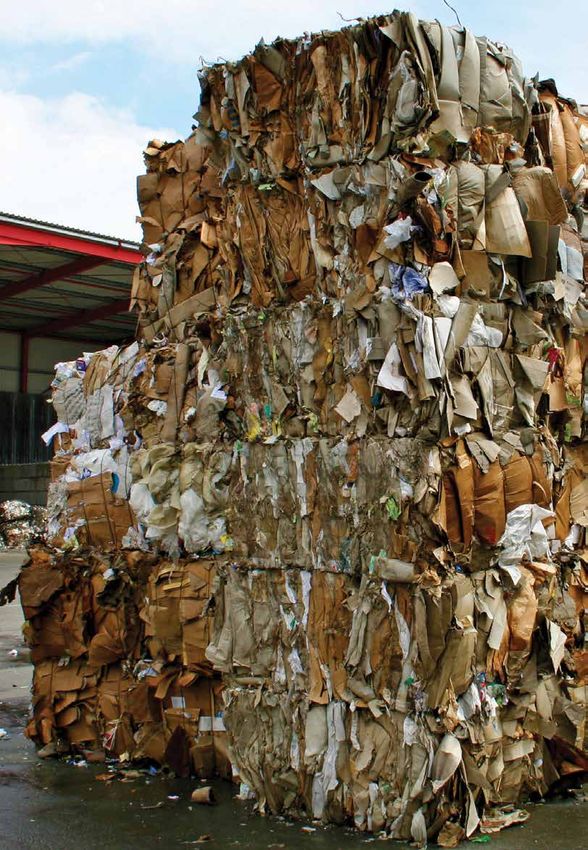
     The supply of biomass for heating and electricity in the year 2006 is shown in Table 5. Three categories of biomass
     are distinguished: woody biomass (including both direct supply, e.g. forests, and indirect supply, e.g. wood waste),        Woody                869        11966        258            107                868                   1789
     agriculture and fisheries (including direct supply and by-products) and waste (including municipal waste, industrial        biomass
     waste and sewage sludge). The expected supply of biomass in the years 2015 and 2020 as given by the NREAPs is
     given in Table 6 and Table 7, respectively.                                                                                 Agriculture         1030        9482         775             39                2754                  5296
                                                                                                                                 and fisheries

                                         Table 5: Domestic resource of biomass in 2006 (ktoe) 9                                  Waste                457        2317         435             27                2965                 18142

                                Belgium      Germany       Ireland       Luxembourg         The Netherlands   United Kingdom

          Woody                    450         9410          224              217                     644          558
          biomass                                                                                                                 Summary

                                                                                                                                  In 2006, Germany possessed the largest amount of domestic resources of woody biomass, as well as
          Agriculture              84          5359           15              4.6                     450          412
                                                                                                                                  biomass from agriculture and fisheries. The UK possessed the largest domestic resource of biomass
          and fisheries                                                                                                           coming from waste. In Belgium, Germany, Ireland and Luxembourg, the major part of the biomass input
                                                                                                                                  stems from woody products. In The Netherlands and the UK, waste is the main source of biomass for
          Waste                    267         1058           6.8              49                 1354            2196            energy and heat production.

                                                                                                                                  Concerning the availability of biomass in 2015 and 2020, a large increase in all input categories is expected,
                                                                                                                                  especially between 2006 and 2015. In Belgium, Luxembourg, The Netherlands and the UK, the amount of
                         Table 6: Expected amount (best scenario) of domestic resource in 2015 (ktoe) 9                           biomass from agriculture and fisheries is attributed a high growing potential, whereas in the UK also the
                                                                                                                                  amount of biomass from waste products is expected to largely increase in the future. After 2015, further
                                                                                                                                  increases in the biomass supply are expected, with exception of Germany for which a slight decrease of
                                                                                                                                  woody biomass and biomass from waste is expected.
                                Belgium      Germany       Ireland       Luxembourg         The Netherlands   United Kingdom

          Woody                    723         12349         170               49                     545         1226
          biomass
                                                                                                                               It should be noted that for the Netherlands, the expected amounts in 2015 and 2020 are highly variable: a huge,
                                                                                                                               almost impossible, increase of biomass from agriculture and fisheries is expected,...., whilst woody biomass is
          Agriculture              440         7978          382               25                 1587            1424
                                                                                                                               expected to decrease with 40% between 2006 and 2015. This trend is not coherent with the available data for the
          and fisheries                                                                                                        years 2009-2012. Hence, these figures should be interpreted with caution.

          Waste                    483         2126          235               23                 2354            12694

     9
         Source: National renewable energy plan (ec.europa.eu/energy/renewables/action_plan_en.htm)

22                                                                                                                                                                                                                                                 23
2.1.2 Developments after 2006                                                                                                                                  Table 11: Domestic resource in 2012 (ktoe) 12

     Since 2006, the evolution in the supply of biomass is recorded by the EU countries in a progress report on                                       Belgium Germany 14 Ireland               Luxembourg         The Netherlands           United Kingdom
     renewable energy that is published by the European Commission every two years. Tables 8 to 11 summarize the
     availability of biomass in the period 2009-2012. In addition, the evolution in the domestic agricultural land use for        Woody                1139          9372          143               NA                   831                      1410
     the production of crops for energy production is given in Table 12.                                                          biomass

                                  Table 8: Domestic resource of biomass in 2009 (ktoe) 10                                         Agriculture            94           NA            33               NA                   331                      633
                                                                                                                                  and fisheries

                          Belgium     Germany     Ireland     Luxembourg       The Netherlands       United Kingdom               Waste                 522          1270           75               NA                  1361                      3118

       Woody                648          NA         149            NA                828                   1086
       biomass

                                                                                                                             Based on the progress reports and the expectations for 2020, following observations concerning the domestic
       Agriculture          175          NA         4.5            NA                192                   477
                                                                                                                             resources of biomass van be made:
       and fisheries
                                                                                                                             • Belgium: the supply of biomass from woody products and waste has gradually increased following the expect-
       Waste                361          NA         60             NA                1157                  4029                ed trajectory, while the amount of biomass from agriculture and fishery has considerably decreased between
                                                                                                                               2010 and 2012 towards an amount reaching 1/10th of the expected amount in 2020.

                                                                                                                             • Germany: the Progress report from Germany states that there has been no substantial change to the avail-
                                                                                                                               ability of biomass in Germany between 2006 and 2013. There has been an increase in area under cultivation for
                                  Table 9: Domestic resource of biomass in 2010 (ktoe)      10
                                                                                                                               biogas substrates, in particular maize. Well over a quarter of the area planted with maize is used for energy in
                                                                                                                               Germany at the present time.

                          Belgium Germany 11 Ireland          Luxembourg       The Netherlands       United Kingdom          • Ireland: all biomass inputs remained low over the last years, with the waste input being a fifth of the expected
                                                                                                                               amount in 2020. The largest single stream, which is forest based biomass (although increasing in absolute
       Woody                789         5492        159            50‡               808                   1224                terms), remained at a consistent 45% of total biomass for bio-energy over the period 2008-2010. The contribu-
       biomass                                                                                                                 tion from liquid biofuels has increased from 20% of total biomass in 2008 to 26% in 2010.

       Agriculture                                                                                                           • Luxembourg: available data are scarce such that it is difficult to evaluate the evolution in biomass supply.
                            210         3255        4.1            25‡               358                   439
       and fisheries                                                                                                           Based on the data from 2010, it is observed that the supply from woody products has decreased but this was
                                                                                                                               compensated by an increasing biomass supply from agriculture, fishery and waste.

       Waste                494         7040        64             84‡               1168                  4139              • The Netherlands: similar as in 2006, most biomass for electricity generation and heating comes from waste from
                                                                                                                               the Dutch domestic market. In addition, a great deal of waste wood is made available for energy purposes, for use
                                                                                                                               both in The Netherlands and in other EU States. Another important stream is the importation of wood pellets for
                                                                                                                               co-incineration in power stations. A large proportion of these comes from North America.
                                       Table 10: Domestic resource in 2011 (ktoe) 12
                                                                                                                             • UK: the biomass supply is steady with slight fluctuations, especially concerning the waste stream. The single
                                                                                                                               largest feedstock for renewable energy in UK transport in 2009 and 2010 was soy with 1120 and 907 ktoe sup-
                          Belgium Germany 13 Ireland          Luxembourg       The Netherlands       United Kingdom            plied, respectively. This was all imported from outside the EU. Sugar cane, primarily from Brazil also contributed
                                                                                                                               a significant proportion of the energy. Oilseed rape is the largest EU feedstock with over 200 ktoe supplied in
       Woody                1050         NA         138            NA                728                   1487                each year. The largest UK feedstock was sugar beet with 92 and 129 ktoe supplied in 2009 and 2010, respective-
                                                                                                                               ly. There was a significant increase in the amount of used cooking oil (UCO) reported from all sources in 2010
       biomass
                                                                                                                               reflecting the removal of the duty differential for all biofuels except those derived from UCO in April that year.

       Agriculture           87          NA         41             NA                356                   492
       and fisheries

       Waste                487         1167        68             NA                1269                  2894              12
                                                                                                                                Source: Renewable Energy Progress Reports – Data for 2011-2012 (ec.europa.eu/energy/renewables/reports/2013_en.htm)
                                                                                                                             13
                                                                                                                                Source: BMU 2013, Zeitreihen zur Entwicklung der erneuerbaren Energien in Deutschland – unter Verwendung von Daten der Arbeitsgruppe
                                                                                                                                Erneuerbare Energien-Statistik (A-GEE-Stat), Berlin.
                                                                                                                             14
                                                                                                                                Source: Mantau (2013), Umsatzentwicklung energetischer Holzverwendung in Deutschland 2000 bis 2012. Studie im Auftrag der AGEE-Stat.
                                                                                                                                Hamburg 2013

24                                                                                                                                                                                                                                                                     25
Table 12: Land used in the period 2006-2012 for low-impact energy crops 9,10,12                            According to the EC renewable energy progress report (COM(2013)175) on the feedstock needs for biodiesel
                                                                                                                                     production in the EU, 60% of the biodiesel is produced within the EU. Biodiesel is the main biofuel for road transport
                                                                                                                                     in the EU, accounting for 79% of the total biofuel consumption on energy content base in 2013 (Eurobserv’ER,
                                                                                                                                     2014) The share for bio-ethanol is larger: about 80% of all used feedstock for bio-ethanol serving transport is
                                                                                                                                     covered by EU resources.
                           Land for short rotation coppice (ha)                         Land for other energy crops (ha)
                                                                                        (reed canary grass, switch grass,
                                                                                                                                     Since imported volumes of biomass vary largely among the partner countries, the current and future expected
                                                                                        Miscanthus, sorghum, ... )
                                                                                                                                     imports of biomass for the ARBOR-countries are outlined below, in addition to the abovementioned overview of
                                                                                                                                     biomass imports for the EU as a whole.
               		          2006       2009      2010       2011        2012             2006       2009       2010    2011    2012

               BE            0         78         139       145        165                0          81       82       138    190    2.2.2 Belgium
               DE           1200      2300       3600      4000        4900             1100        1800     2100      2000   3000
               IE            63        360        548       689         839              617        2101     2166      2349   2413   The imported amount of wood pellets increased more than three times between 2010 and 2012: from 315 000
               LU             0        NA         NA        NA          NA                0          50        0        84     145   tonnes in 2010 to 972 000 tonnes in 2012 (Eurostat, 2013). In 2012 the total consumption in Belgium was 1,7 million
               NL            0         12          8        13           6             10000        8193     10715     6091   6224   tonnes of pellets, so 57% was imported. Most pellets are consumed by large scale power plants, minor volumes for
               UK           4196       NA         NA       2720        2551             5316         NA       NA       8075   7517   residential use. Since the Flemish government stopped temporarily (March-September 2013) the issuing of Green
                                                                                                                                     Electricity Certificates to the largest biomass power plant in Belgium and since another big biomass power plant
                                                                                                                                     in the Walloon region also temporarily stopped production, imported and consumed quantities in 2013 decreased
                                                                                                                                     to respectively 896 000 and 800 000 tonnes (an import rate of almost 90%).

            Summary                                                                                                                  In the Flemish region the government decided in mid-2014 to stop granting abovementioned Green Electricity
                                                                                                                                     Certificates for new biomass power plants with a capacity larger than 20 MW, except for two new large biomass
            In general there has been an increase in the availability of biomass for energy and heating between 2006                 power plants which were already granted permission. The Flemish Energy Agency VEA foresees that power
            and 2012 with woody biomass and waste as the main suppliers. For these inputs the target amounts                         production out of biomass will double from 2016 due to these two new plants which rely almost only on imported
            for 2020 will be reached as only a slight deficit is present. On the contrary, the supply of biomass from                biomass (wood pellets and energy crops). For the trajectory 2020-2030 three scenarios were forecasted (VITO,
            agriculture and fishery has not yet reached the target capacity and does not show further growing                        2014): the ‘low bio’ scenario stipulates a stand still in biomass use against 2030 compared to 2012 and assumes
            potential.                                                                                                               that two thirds of the biomass will be produced locally. In contrary, the ‘medium’ (25% renewable energy) and ‘high’
                                                                                                                                     (30% renewable energy) scenarios need both an increase of imported biomass.
            With exception of The Netherlands, all countries show an increase in the land used for energy production.
            Energy crops generally comprise most of the land use, while short rotation coppice is clearly less popular.
            Only in Germany, more land is made available for short rotation coppice than for energy crops.                           2.2.3 Germany

                                                                                                                                     Electricity: In Germany several studies have dealt with the acceleration scenarios of renewable energies in Germany
                                                                                                                                     up to the target year 2050. Summarizing the findings, Germany has no strategy to import biomasses and is so far
                                                                                                                                     not calculating with net-imports from energetically used biomass despite the sectors biomass fuels for transport
                                                                                                                                     and partly biomethane. Different studies prospect different energy demand coverages, as summarized in the
     2.2 Imported biomass                                                                                                            German study: ”Langfristszenarien und Strategien für den Ausbau der erneuerbaren Energien in Deutschland bei
                                                                                                                                     Berücksichtigung der Entwicklung in Europa und global, 2012 17”:
     2.2.1 European Union
                                                                                                                                     •     Biofuels 2050: between 436-2369 PJ/a
     The European Commission Staff Working Document SWD (2014) 259 mentions a gap in 2020 of 21,4 Mtoe between                       •     EE methane 2050: 0-266 PJ/a
     primary energy from domestic (EU) biomass supply for electricity, heating and cooling and the total supply needs.
     This is equal to over 15% of EU primary bio-energy supply in 2020. This is likely to be met by imports from out of              Germany is the third largest wood pellet producer in the world
     the EU and largely in the form of wood chips and densified wood, e.g. pellets. According to expert opinions wood                after the United States and Canada. The total domestic production
     pellets can be classified as the main traded commodity of solid biofuels 15. The EU-27 is currently the largest global          in 2013 was 2,25 million tonnes of which about 2 million tonnes
     producer of wood pellets (10,5 million tonnes in 2012) and is also a net importer of wood pellets: in 2009 imports              were produced from residues of the timber industry. The market for
     from non-member countries were about 1,7 million tonnes, by 2012 this amount increased to 4,5 million tonnes                    pellets in Germany depends mostly on domestic production: the
     (Eurostat, 2013). According to AEBIOM 16 the consumption of wood pellets in the EU should rise to 18,3 million                  total import of pellets is rather low (about 450 000 tonnes in 2013)
     tonnes in 2013, compared to a global consumption of 23,2 million tonnes. EU production in 2013 was 12,2 million                 compared to EU countries as the UK, Denmark and Italy (USDA, 2014).
     tonnes in 2013, meaning that the EU imported one third of its consumption that year. Imports will further increase
     strongly and are expected to be in the range of 15-30 million tonnes (equal to 6-12 Mtoe) by 2020 (Pelkmans et al.,
     2012). The Impact assessment of the energy and climate policy up to 2030 foresees a continuous increasing
     biomass demand for heating and electricity after 2020, primarily through imports.

     15
          Pelkmans et al. (2012), Benchmarking biomass sustainability criteria for energy purposes, VITO consortium
     16
          European Biomass Association, European Bioenergy Outlook 2014, consulted in the solid biomass barometer
                                                                                                                                     17
                                                                                                                                          http://www.dlr.de/dlr/Portaldata/1/Resources/bilder/portal/portal_2012_1/leitstudie2011_bf.pdf
          January 2015 of Eurobserv’ER

26                                                                                                                                                                                                                                                            27
2.2.4 Luxembourg                                                                                                        2.2.7 United Kingdom

     According to Eurostat-figures import of wood pellets in Luxembourg is negligible (4000 tonnes in 2010). No further      In the initial Benchmark Report (2012) we stated that there was an expectation for the UK “ to have sufficient
     data is available, except from the NREAP: in 2006 the import of woody biomass from forestry was 1,6 ktoe. It is         biomass resource potential to meet the demand for heat and power”. Despite this, import of wood pellets increased
     expected that this amount will increase up to 45 ktoe in 2020. A large share of the renewable energy targets is         from 551 000 tonnes in 2010 up to about 1,5 million tonnes in 2012 (Eurostat, 2013) and 3,4 million tonnes in 2013.
     planned to be obtained by biofuel imports, since the transport sector currently represents more than half of the        Based on the imported amounts in 2013 and the consumption in 2014 the UK is the largest pellet importer and
     country’s final consumption (Resch, G., 2014).                                                                          consumer in the EU (USDA, 2014). The share of imported wood pellets for 2013 is about 40%. As set out in the 2011
                                                                                                                             UK Renewable Energy Roadmap, electricity and heat from biomass and renewable transport are technologies
                                                                                                                             will play an important role in the plans to meet the RED directive in 2020. The following UK Bio-energy Strategy
     2.2.5 Ireland                                                                                                           Analytical Index 21 indicates in its restricted supply scenario 22 an increase in the utilisation of resources between
                                                                                                                             2015 and 2020 (to meet the RED target) and a declining amount from 2040 up to 2050. This is reflected in the
     Data for precise numbers and ratios of imports of biomass into Ireland are not recorded by government. In the           amounts of used imported woody biomass: about 6000 ktoe in 2020, 9500 ktoe in 2030 and 7700 ktoe in 2050. In
     NREAP of Ireland one scenario estimates that imported biomass will account for about 350 ktoe of total required         the ambitious supply scenario 23, one expects increasing amounts of the available resources until 2045, the largest
     biomass supply of 1100 ktoe or 32% by 2020. A second scenario estimates higher amounts: 510 ktoe will be                increase being from imports of woody biomass: about 17 000 ktoe in 2040 and 26 000 ktoe in 2045.
     imported of the total biomass supply of 1260 ktoe by 2020 (40%). The forestry research agency COFORD recorded
     in 2006 a small import of 2 182 m³ fellings compared to 15 316 m³ domestically resourced (12% imported). Almost
     all other biomass from forestry had a domestic origin.
                                                                                                                             2.3 Sustainability criteria for biomass use
     As part of the NREAP for Ireland, an estimation of the total contribution expected from all renewable energy
     technologies in Ireland to meet the binding 2020 targets and the indicative interim trajectory for the shares of
     energy from renewable resources (in electricity, heating and cooling and transport) was presented. Extraction from      2.3.1 European framework
     this data shows a percentage of bio-energy in the Ireland energy mix of about 3 to 4% in the trajectory 2010-2020,
     while the large majority of Ireland renewable energy projected to come from wind power. The SEAI report ‘Energy         2.3.1.1 Biofuels
     forecast for Ireland to 2020’ points a growth in the use of biomass for electricity generation, with a maximum of
     5% to Irelands electricity mix in 2020. It shows in its predictions also clearly the Irish Government focus on wind     The European biofuel policy is largely designed by two important instruments. The Renewable Energy Directive
     energy. It is therefore highly likely that biomass based energy will not become a significant contributor to Irelands   (RED, 2009/28/EC) stipulates the target to achieve 10% renewable energy in road transport by 2020 and the
     electricity generation mix in the next 10-20 years.                                                                     Fuel Quality Directive (FQD, 2009/30/EC) includes the binding 2020-target to reduce lifecycle greenhouse gas
                                                                                                                             emissions of fuels by 6%. Both directives include sustainability criteria (e.g. conserving biodiversity and carbon
     Estimated figures for biomass utilisation beyond 2020 are included in the Ireland energy roadmap to 2050, published     stocks) and minimum greenhouse gas saving thresholds: greenhouse gas savings from the use of biofuels should
     by the SEAI. One predicts growth in the available biomass resource in Ireland with significant contributions from       be at least 60% from 1 January 2018 for installations starting production on or after 1 January 2017 (European
     municipal solid waste, grass, energy crops and forestry material. It is therefore possible that Ireland could meet a    Commission, 2009; Ecofys, 2013). Member states have the responsibility to verify if companies are implementing
     significant amount of its required biomass demand with domestically produced material. Appropriate support              the sustainability criteria. One way to comply with the criteria is to participate in a voluntary scheme. Currently,
     from the government (financial and policy based) already is and could be a further driver for this.                     there are already 19 privately run voluntary schemes are recognised by the European Commission 24 .

                                                                                                                             The criteria of the RED and FQD are focused on direct impacts. Since several years and till now the indirect impact by
     2.2.6 The Netherlands                                                                                                   way of Indirect Land Use Change (ILUC) 25 dominates the European debate on biofuels. The European Commission
                                                                                                                             launched a proposal (COM(2012)595) to amend both directives in order to reduce possible effects of ILUC. The
     Biomass co-firing was capped by the Energy Agreement at a net energy output of 25 PJ per year (equivalent               proposal considers:
     to about 3,5 million tonnes of wood pellets). Total import of wood pellets in 2012 was about 1 million tonnes
     and halved to 0,543 million tonnes in 2013. The total wood pellet consumption in 2012 was 1,25 million tonnes,          •     Setting a 5% cap on conventional biofuels (first generation food-crops based biofuels: from cereal and other
     corresponding to an import share of 80% (USDA, 2013 and 2014).                                                                starch rich crops, sugars and oil crops) counting towards the RED transport target
                                                                                                                             •     Encouraging advanced (low-ILUC) biofuels: the contribution of some fuels is counted double or quadruple
     In 2006, the import of biomass accounted for 28% of biomass supply for energy (Rabou et al., 2006). For the future            towards the target
     the maximum energy amount out of domestic biomass is predicted to be 200 PJ in 2020 18 and 290 PJ in 2050 19 .          •     Including ILUC factors in yearly reports
     The total demand from bioenergy in The Netherlands is uncertain but assumed to be 1600 PJ in 2050, so in that           •     Raising the greenhouse gas saving threshold for new installations operating after 1st July 2014 to at least 60%
     scenario large quantities of biomass need to be imported. Another source 20 expects that in 2030 an amount of                 (based on direct emissions)
     900 PJ of biomass is required to achieve a biomass share of 23% in the total energy supply. The maximum availability
     of domestic biomass in 2030 is estimated to be 450 PJ, though it is not likely that this maximum availability will be   The legislative procedure is at the moment of writing in its second reading phase. An agreement is expected to be
     reached. Producing energy crops is less interesting for farmers than crops for food or feed.                            reached later on in 2015 (VITO, 2014).

                                                                                                                             21
                                                                                                                                  https://www.gov.uk/government/publications/uk-bioenergy-strategy
                                                                                                                             22
                                                                                                                                  Restricted supply scenario: low biomass prices (up to £4/GJ) with high constraints to deployment of feedstocks and low international
                                                                                                                                  development. Of the supply that could be available to trade internationally, UK has access to 10% to 2020 reducing to 1.5% in 2050 as carbon
                                                                                                                                  constraints tighten and competition for resources intensifies.
     18
          http://www.pbl.nl/sites/default/files/cms/publicaties/PBL-2011-Routekaart-energie-2050-500083014.pdf               23
                                                                                                                                  Ambitious supply – high biomass prices (up to £10/GJ), low constraints to deployment of feedstocks and a high international development.
     19
          http://infographics.pbl.nl/biomassa/                                                                                    The UK has access to 10% of internationally traded biomass up to 2020 reducing to 3% in 2050. In order to be cautious on medium term
     20
          http://edepot.wur.nl/50725                                                                                              availability this scenario assumes a downward linear trajectory from 2025.
                                                                                                                             24
                                                                                                                                  ec.europa.eu/energy/node/74
28                                                                                                                                                                                                                                                                               29
You can also read