GLOBAL WIND ENERGY OUTLOOK
←
→
Page content transcription
If your browser does not render page correctly, please read the page content below
C H A P T E R T I TL E
                                               1

GLOBAL WIND ENERGY
  OUTLOOK | 2014

                   OCTOB ER 2 0 14
TABL E OF CON T E N T S

1     Momentum
       for Change? ������������������������������������������������������������������������������4   Annual CO2 emissions reductions��������������������������������������������������� 21

                                                                                                      Cumulative CO2 emissions reductions������������������������������������������ 21

2       The Global Wind Energy                                                                       Annual and cumulative CO2 emissions reductions ���������������������� 21
         Outlook Scenarios ���������������������������������������������������������������� 8
                                                                                                      Research background������������������������������������������������������������������������22
Three visions of the future�����������������������������������������������������������������9
                                                                                                      Regional breakdown of cumulative capacity up to 2030������������ 24
IEA New Policies scenario �����������������������������������������������������������������9

GWEO Moderate scenario�����������������������������������������������������������������9
                                                                                                      3        The Regional Scenario
GWEO Advanced scenario���������������������������������������������������������������10                        Results����������������������������������������������������������������������������������� 26

Global scenario results���������������������������������������������������������������������10       Africa������������������������������������������������������������������������������������������������� 27

Global cumulative wind power capacity����������������������������������������10                      China������������������������������������������������������������������������������������������������ 30

Capacity growth������������������������������������������������������������������������������� 11    Eastern Europe/Eurasia ������������������������������������������������������������������ 33

Regional breakdown: New Policies scenario���������������������������������� 12                       India�������������������������������������������������������������������������������������������������� 36

Regional breakdown: Moderate scenario��������������������������������������� 13                      Latin America ��������������������������������������������������������������������������������� 38

Regional breakdown: Advanced scenario��������������������������������������� 13                      Middle East���������������������������������������������������������������������������������������41

Production and share of electricity supply ������������������������������������ 13                   Non-OECD Asia ������������������������������������������������������������������������������ 44

Wind power share of global electricity demand ���������������������������14                          OECD Europe������������������������������������������������������������������������������������47

Specific costs per kilowatt installed������������������������������������������������14              OECD Pacific ������������������������������������������������������������������������������������ 51

Projections for electricity demand development��������������������������� 15                         OECD North America ����������������������������������������������������������������������53

Investment and employment ���������������������������������������������������������18                Annex table��������������������������������������������������������������������������������������� 57

2       GLOBAL WIND ENERGY OUTLOOK | 2014
F OR EWOR D

T    he Global Wind Energy Council and Greenpeace
     International are pleased to present this fifth
edition of the Global Wind Energy Outlook for
                                                            The most exciting areas of new growth are in Brazil,
                                                            Mexico and South Africa. The Brazilian industry is set
                                                            to install nearly 4 GW in 2014 alone; energy reform
2014, the latest product of a collaboration that            in Mexico has set that country on course for a ~2GW/
goes back to 1999. A lot has changed since then.            annum market for the next 10 years; and South Africa
                                                            will rack up impressive numbers in 2014, which we
Wind power has now firmly established itself as a           believe is just the beginning of major developments
mainstream option for new electrical generation.            across Africa. 2014 should be a pretty good year.
The most remarkable recent development is that
in an increasing number of markets, wind power is           But the Global Wind Energy Outlook isn’t about
the least cost option when adding new generation            2014 or 2015. It’s about what the industry will look
capacity to the grid, and prices continue to fall. There    like in 2020, 2030 and beyond. There is much that
are now commercial wind power installations in              we don’t know about the future, and there will no
more than 90 countries with total installed capacity        doubt be unforeseen shifts and shocks in the global
of 318 GW at the end of 2013, providing about 3% of         economy as well as political ups and downs; and no
global electricity supply last year.                        one knows whether or not the global community is

›  In an increasing
number of markets,
wind power is now the
least cost option when
adding new capacity to

                   ‹
the grid, and prices
continue to fall.

                               Steve Sawyer                          Sven Teske                             Klaus Rave
                               Secretary General                     Director, Renewable Energy             Chairman
                               Global Wind Energy Council            Greenpeace International               Global Wind Energy Council

While this is an amazing success story, it is also          going to respond proactively to the threat of climate
the case that due to a combination of the various           change, or try to do damage control after the fact.
manifestations of the economic crisis, low or negative      But it seems clear that for all of the reasons that wind
demand growth in the OECD economies, and policy             power has gotten to where it is today, it will play a
instability in key markets, growth has been essentially     significant and growing role in our electricity supply.
flat for the last four years. The last significant jump
in annual market size was in 2009, when the market           As in previous editions, we use the International
grew by over 40% in comparison with 2008, to just            Energy Agency’s World Energy Outlook as a
over 38 GW. Since then, it has hovered around the 40         baseline for comparability purposes, in terms of
GW mark, with major ups and downs in the US, an              regions, projected GDP and population growth, the
end to the exponential growth in the Chinese market          development of electricity demand, etc. We use their
and little or no growth in Europe.                          ‘New Policies scenario’ which has now become the
                                                             central scenario for the World Energy Outlook.
However, the Chinese market has recovered and
posted strong (25%) growth in 2013; the US market           We examine three development paths for the
seems to be back on track for 2014 and 2015 at least,       industry: the IEA New Policies scenario, the GWEO
and it seems as though the Indian market is ready           Moderate scenario and the GWEO Advanced
to start growing again and beginning to realize its         scenario. These are measured against two different
potential in that market which so desperately needs         demand scenarios: that contained within the IEA
new electricity supply.                                     study, and an Energy Efficiency demand scenario. We
                                                            hope that you find it useful.

                                                                                                  GLOBAL WIND ENERGY OUTLOOK | 2014   3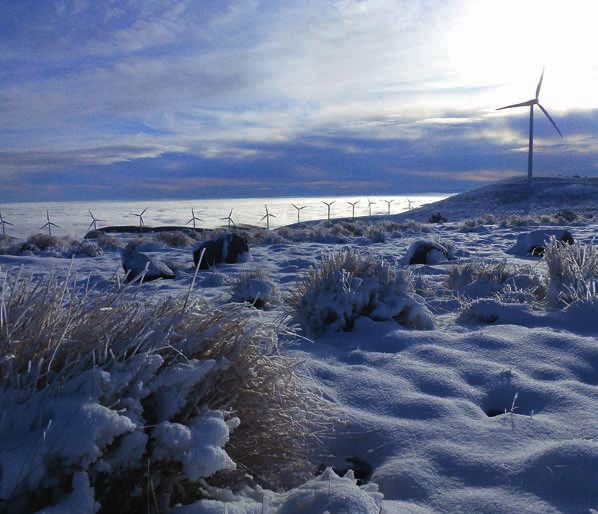
1   SPEC I A L F O CU S

                          1
                                         M OME N TUM F OR C H A N GE?

4   GLOBAL WIND ENERGY OUTLOOK | 2014
MOME N TUM F OR C H A N G E?
                                                                                                                                           1

A     fter the collapse of the last Big Climate
      Summit in Copenhagen in 2009, for
many if not most people the climate issue
                                                       major corporations who were reported to
                                                       have pounded the table behind closed doors in
                                                       New York demanding action; and so have the
was ‘over’, or at least the hope of serious            struggling farmers in India, sub-Saharan Africa,
action by governments was over. Fatigue,               California and Australia.
shattered expectations, disappointment
and despair drove away all but the scientists,         RETOOLING JUST ABOUT THE ENTIRETY OF
hard-core activists and civil servants whose           HUMAN CIVILIZATION
job it is to keep the talks going.
                                                       The good news is that unlike 25 years ago when
But climate change is back – bigger and badder         the climate issue first emerged, and indeed
than ever, and we have an opportunity to make          even unlike five years ago in Copenhagen, we
a big step forward in the run up to the next Big       have the technology to solve the problem, and
Summit in Paris in December 2015. It’s urgent          to do so cost effectively. “It doesn’t cost the
that we get it right this time.                        earth to save the planet”, said IPCC Working
                                                       Group III Chairman Ottmar Edenhofer when
 For those who don’t have the patience to              unveiling the IPCC’s latest work on climate
 plow through the Intergovernmental Panel              mitigation. Wind and solar are taking over the
 on Climate Change’s latest assessment report          power sector. Electric mobility and improved
– it’s 5th since 1990 – you don’t have to go           battery technology is on the rise. Improved
 any further than your local newspaper, or your        materials science, energy efficiency equipment
 favorite web page:                                    and practices, and an almost inexhaustible
                                                       list of other technologies and innovation have
‘Super typhoon’ Haiyan which wrought                   given us the tools we need, or at least most of
 devastation in the Philippines;                       them; and the rest can be picked up along the
                                                       way.
Hurricane Sandy which put lower Manhattan
out of business;                                       Not to say that it’s going to be easy – we’re
                                                       talking about retooling just about the entirety
Frightening new evidence about the instability         of human civilization in the next 40 years –
and vulnerability of the Greenland ice sheet,          which, by the way, we’re probably going to do
whose collapse would cause seven meters                anyway; the question is whether we do it right
of global sea level rise, at the end of the day.       this time, at least in terms of the climate.
Goodbye London, New York, Shanghai, Tokyo…
                                                       The much greater obstacle lies in the political,
Projections of extreme weather damage of one            economic and institutional inertia which have
trillion USD/year by mid-century;                       bogged down the discussion for too long now.
                                                       The fossil fuel industry, the most powerful
…the list goes on. Oh, and California’s Central         vested interest in the world today, continues to
Valley is out of water. That’s right - out of water.    do everything it can to obfuscate the science
There are communities that haven’t had water            and slow down political progress. Not their
running in their taps for five months now - can’t       least pernicious influence is on the politicians
flush their toilets; no showers. For the moment,        they own, particularly those in the US Congress
they’re getting their drinking water from the          – and in the places where the fossil fuel industry
fire department, although it’s not clear how            is a family business masquerading as a national
much longer that will last.                             government in the Persian Gulf – and in the
                                                        places where fossil fuel exports have become
The 400,000 people who marched in the run               a blunt political and military instrument
up to UN Secretary General Ban Ki-moon’s                to bludgeon recalcitrant neighbours into
Climate Summit in New York in September                 submission.
have gotten the message. So have the many

Wild Horse Renewable Energy Center
© Puget Sound Energy                                                                               GLOBAL WIND ENERGY OUTLOOK | 2014       5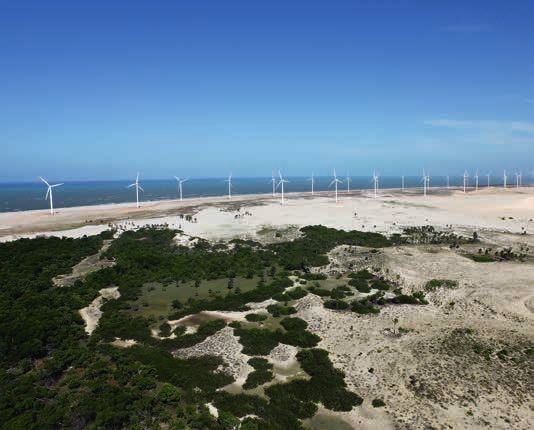
1   MOME N TUM F OR C H A N G E?

›  The dramatic
progress of wind and
                                   But we have a chance to change all that.
                                   The dramatic progress of wind and solar
                                                                                       that global mean temperature rise be kept
                                                                                       below 1.5°C.
solar technologies                 technologies over the past decades have
over the past decades              brought us to the point where the vision of a       To preserve a chance to reach either of those
has brought us to the              clean sustainable energy future for our whole        targets, then there is one clear and immediate
point where the vision             economy is well within reach, and has become         imperative: global emissions must peak and
of a clean sustainable             the explicit policy direction of an increasing       begin to decline before the end of this decade

                ‹
energy future is well              number of countries.                                – which is not impossible, but it’s getting
within reach.                                                                           increasingly difficult; and the longer we wait
                                   Further, for those who attended the march in        the more expensive it will be.
                                   New York and the subsequent summit, there
                                   is once again a positive feeling, a palpable        The power sector isn’t the whole problem, but
                                   momentum for change. The trick will be to           it is the largest single contributor to global
                                   turn that into instructions from politicians to     greenhouse gas emissions – about 40% of
                                   their civil servants, including but not limited     energy related CO2 emissions, and about 25%

                                                             “THE LONGER WE WAIT

                                                               THE MORE EXPENSIVE

                                                                                                 IT WILL BE…

                                   to those who are negotiating towards Paris in        of overall greenhouse gas emissions. If we want
                                   2015. At the end of the day, it is governments      to make a difference in that sector in the next
                                   which will set the frameworks at national and       5-10 years, then we don’t have a lot of options.
                                   international level; who determine the extent        First and foremost, we need massive and rapid
                                   to which we can succeed in the time required.        implementation of existing energy efficiency and
                                                                                        energy saving technologies and practices, which
                                   For time is the one thing we don’t have – not        will yield the greatest benefit in the shortest
                                   much, anyway. All of the science indicates           period of time. Secondly, no new coal plants
                                   global emissions need to peak in the next five       should be built, and fuel-switching from coal to
                                   years if we are to have any reasonable chance        gas should be implemented wherever possible.
                                   of avoiding the worst ravages of man-made           And finally, continue and accelerate the dramatic
                                   climate change, i.e., keeping global mean            growth of renewable generation technologies
                                   temperature rise below 2°C above pre-               – and although solar makes a significant
                                   industrial levels. Or, if you happen to depend       contribution in the period after 2020, and may
                                   upon a vulnerable coral reef ecosystem, if you       be the largest energy source of all by 2050, in
                                   have extensive low-lying coastal territory, or       the next 5 to 10 years the big contribution to
                                   if you live on a low lying island in the Pacific,    emission reductions will come from hydro and
                                   Caribbean or Indian Ocean, then you’d prefer         wind. That’s what we should focus on.

6   GLOBAL WIND ENERGY OUTLOOK | 2014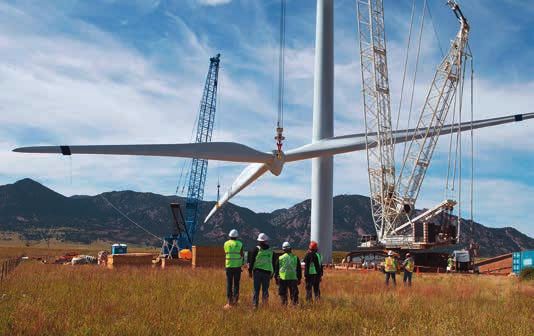
MOME N TUM F OR C H A N G E?
                                                                                                                                     1

This edition of the Global Wind Energy Outlook     As Morgan Freeman said in a recent film he
shows what could be done with the right            narrated for the New York Summit:
political support in the period out to 2020,
and subsequently to 2030. On our current           “One day very soon we’ll be asked, ‘what did
trajectory we will very likely displace about       we do?’…and we’ll say,’ We did everything we
1 billion tonnes of CO2 per year by 2020, and       could.’ We have to. Because if we don’t, there
it could be as much as 1.2 billion tonnes/year      won’t be anyone left to ask.”
with the right support; and for the period
between 2020 and 2030, we’ll probably get to
two billion tonnes or so per year muddling along
as we have been, but that could be three billion
tonnes or more per year by that time. New and
refurbished hydro can deliver reductions on
a similar scale, and solar will begin to make a
larger difference in the period after 2020. But

…BECAUSE IF WE DON’T,

THERE WON’T BE ANYONE LEFT

TO ASK”

with unequivocal political will to transform our
energy system which is required to meet the
climate challenge, it could be even more.

As an old friend of mine from Citibank is fond
of saying, “We’re in the middle of a 100-year
transition away from fossil fuels and towards
renewables – and we’re winning, at least in
the marketplace”. Yes, we’re winning, but are
we winning fast enough to save the planet?
Actually, not the planet – the planet will be
fine – the question is whether we will win fast
enough to save human civilization. Some say
the planet would be better off if we weren’t
around to pollute the air, water and land. But
I prefer to think of it as a golden opportunity
to demonstrate the capability of our species to                               Wild Horse Renewable Energy Center © Puget Sound Energy
evolve to the next stage.

                                                                                              GLOBAL WIND ENERGY OUTLOOK | 2014      7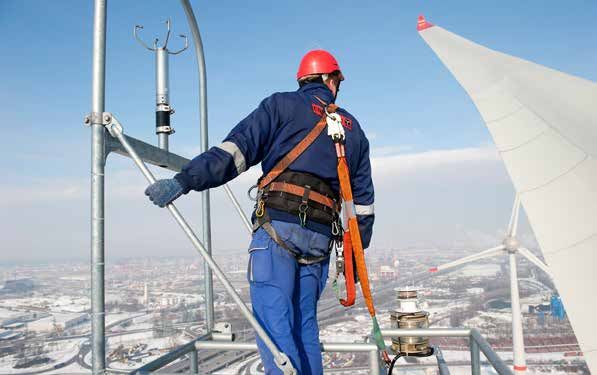
2 1 T HE
C HGLOB
A P T EA
R LTW
I TL
IND
E E NE RGY O U TLO OK SC E NA R IO S
2
T HE GLOBA L W IND E NE RGY
OU TLOOK SC E NA R IO S
8 GLOBAL WIND ENERGY OUTLOOK | 2014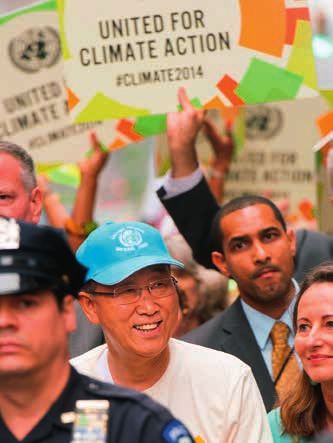
T HE GLOB A L W IND E NE RGY O U TLO OK SC E NA R IO S
2
THREE VISIONS OF THE FUTURE IEA NEW POLICIES SCENARIO
T he Global Wind Energy Outlook explores
the future of the wind energy industry
Originally, we used the IEA World Energy
Outlook’s ‘Reference’ scenario as the baseline
› Broader range of
governments will
out to 2020, 2030 and up to 2050. With the for this exercise. However, that scenario has have to begin to
International Energy Agency’s New Policies been renamed the ‘Current Policies’ scenario respond to the
scenario from the World Energy Outlook as and is no longer the central scenario against increasing imperative
a baseline, we have developed two scenarios which variations are tested within the WEO for the energy
especially for this publication: the GWEO framework, as it is clear that continuing the security and price
‹
Moderate scenario and the GWEO Advanced status quo is unlikely in the extreme. stability offered by
scenario. wind energy.
The ‘New Policies’ scenario is based on an
The GWEO Moderate and Advanced scenarios assessment of current directions and intentions
have evolved over the years as a collaboration of both national and international energy and
between the Global Wind Energy Council, climate policy, even though they may not yet
Greenpeace International and the German have been incorporated into formal decisions
Aerospace Centre (Deutsches Zentrum fur or enacted into law. Examples of this would
Luft-und-Raumfahrt – DLR). These scenarios include the emissions reduction targets adopted
for the future of the wind industry have in Cancun in 2010, the various commitments
contributed to an ongoing series of broader to renewable energy and efficiency at national
studies on global sustainable energy pathways and regional levels, and commitments by
up to 2050 conducted by DLR and Greenpeace governments in such fora as the G-8/G-20 and
in collaboration with a number of industry the Clean Energy Ministerial. The New Policies
associations including GWEC. The ‘Energy scenario is now at the center of the WEO
[R]evolution’ scenario’, or ‘2° Scenario’, has analysis; the version which appears in the 2013
become one of the benchmarks in international WEO runs out to 2035 and we have extrapolated
energy scenario discussions, utilized by the it out to 2050 for comparison purposes.
IPCC, IEA and others.1
The upheaval in electricity markets around the GWEO MODERATE SCENARIO
globe, the wild swings in policy both in favor
of and against renewable energy deployment The GWEO ‘Moderate’ scenario has many of
and the uncertain future of the global climate the same characteristics as the IEA New Policies
regime make predictions about the future of scenario, taking into account all policy measures
this or any other industry even more difficult to support renewable energy either already
than usual. However, it is also the case that enacted or in the planning stages around the
as wind power plays a more and more central world, and at the same time assuming that the
role in our electricity system, that the various commitments for emissions reductions agreed
scenarios from industry, the IEA, NGOs and by governments at Cancun will be implemented,
others all begin to converge. Here we present although on the modest side. At the same
each of the three scenarios for each of the 10 time it takes into account existing and planned
IEA-defined regions as well as global totals, national and regional targets for the uptake of
looking towards 2020 and 2030 – with longer renewable energy in general and wind energy in
term projections out to 2050 in the Annex particular, and assumes that they are in fact met.
table. A brief description of the underlying
assumptions and orientation of each scenario Through the five year period out to 2018, the
is listed below. Moderate scenario is very close to our annual
five year market forecast, based on industry
1 See http://www.energyblueprint.info orders and planning as well as intelligence from
our global network about new and emerging
markets.
Rio do Fogo, Brazil © Wind Power Works GLOBAL WIND ENERGY OUTLOOK | 2014 9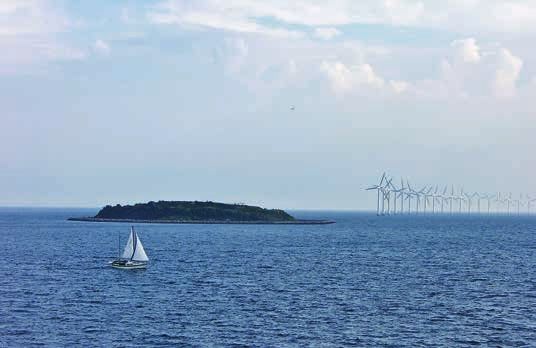
2 T HE GLOB A L W IND E NE RGY O U TLO OK SC E NA R IO S
G LOB A L C U M U L AT I V E W I N D POW E R C A PAC I T Y
5,000,000 MW New Policies scenario Moderate scenario Advanced scenario
4,000,000
3,000,000
2,000,000
1,000,000
0
2013 2015 2020 2030 2040 2050
2013 2015 2020 2030 2040 2050
New Policies scenario
MW 318,128 396,311 610,979 964,465 1,324,814 1,684,074
TWh/a 620 972 1,499 2,535 3,482 4,426
Moderate scenario
MW 318,128 413,039 712,081 1,479,767 2,089,261 2,672,231
TWh/a 620 1,013 1,747 3,889 5,491 7,023
Advanced scenario
MW 318,128 420,363 800,615 1,933,989 3,024,473 4,042,475
TWh/a 620 1,031 1,964 5,083 7,948 10,624
› As wind power
plays a more and
After 2018 it is difficult to make a precise
forecast given the current set of global
to commit to appropriate policies and the
political stamina to stick with them.
more central role in uncertainties, but at that stage we assume that
our electricity system, a broader range of governments will have begun It also assumes that governments enact clear
the various scenarios to respond to the increasing imperative for the and effective policies on carbon emission
from industry, the IEA, energy security and price stability offered by reductions in line with the now universally
‹
NGOs and others all wind energy, as the LCOE of wind continues agreed objective of keeping global mean
begin to converge. to come down and the price of conventional temperature rise below 1.5-2°C above pre-
generation continues to go up. Further, it is industrial temperatures. Wind power is an
expected that there will be the beginnings of absolutely critical technology to meeting the
some sort of response to whatever is agreed in first objective in that battle - which is getting
UNFCCC climate change process which peaks global emissions to peak and begin to decline
in Paris in December 2015. before the end of this decade.
GWEO ADVANCED SCENARIO GLOBAL SCENARIO RESULTS
The ‘Advanced’ scenario is the most ambitious, The IEA’s New Policies scenario shows the
and outlines the extent to which the wind global wind market returning to 2012 levels
industry could grow in a best case ‘wind energy in 2016 and then gradually decreasing and
vision’, but still well within the capacity of stabilizing at about the 2010 market level after
the industry as it exists today and is likely to 2020, and only growing very slightly from that
grow in the future. It assumes an unambiguous level out to 2030.
commitment to renewable energy in line with
industry recommendations, the political will
10 GLOBAL WIND ENERGY OUTLOOK | 2014T HE GLOB A L W IND E NE RGY O U TLO OK SC E NA R IO S
2
The GWEO scenarios paint a picture of two
different futures:
The Moderate scenario starts with about
14% growth in 2014, tapering off gradually
› Under the
Advanced scenario,
to 10% by 2020 and then also to 6% by wind power could
The Moderate scenario reflects a world 2030, while the IEA New Policies scenario reach nearly
which carries on more or less the way it starts at 12% in 2014, sinking to 7% by 2020 2,000 GW by 2030,
has for the past decade, with wind power and then to 4% by 2030. supply between
continuing to gain ground but still struggling 16.7-18.8% of
against heavily subsidized incumbents; In the Advanced scenario, cumulative growth global electricity
without a comprehensive or cohesive carbon rates start off well below the historical and help save over
market, and with those that exist at very average at 15%, remain steady in the middle 3 billion tons of
‹
low prices. Policy instability decreases, but of this decade and then taper off to 13% by CO2 emissions
is still a factor, although the competition in the end of the decade, dropping to 6% by annually.
OECD markets for a larger share of a stable 2030.
or dwindling pie is intense.
It should be borne in mind that cumulative
The Advanced scenario shows the potential market growth figures will inevitably drop
of wind power to produce 25-30% of global over time in almost any scenario as the size
electricity demand by the end of the scenario of the cumulative market grows; although
period, where there is a strong international even small percentage increases a decade out
political commitment towards meeting from now will mean a large actual increase in
climate goals and national energy policy the quantity of wind power deployed.
is driven by the need for enhanced energy
security, price stability, job creation and the
need to conserve our precious fresh water
resources. Which future shall it be?
CAPACITY GROWTH
ASSUMPTIONS ON GROWTH RATES
Growth rates in the GWEO scenarios
are based on a combination of historical
trends, current and planned policies, new
and emerging markets for wind power, and
assumptions on the direction of overall
climate and energy policy. While the double-
digit growth rates assumed in both the
Moderate and Advanced scenarios out to
2020 may seem high for a manufacturing
industry, actual wind industry cumulative
growth rates have averaged about 26% for
the past eighteen years. Interestingly, annual
market growth rates over that same period
are only a bit less, about 23%, although the
inter-annual variability is much higher due to
the vicissitudes of the marketplace and the
state of the global economy. The cumulative
market growth figures are a more useful way
to look at the industry over the longer term.
Middelgrunden wind farm, Denmark
© Wind Power Works GLOBAL WIND ENERGY OUTLOOK | 2014 112 T HE GLOB A L W IND E NE RGY O U TLO OK SC E NA R IO S
R EGION A L B R E AK DOW N : N EW POL IC I E S SC E N A R IO
OECD Asia Pacific 5% OECD North America 19%
2030
2020
Latin America
China 32% 3% 3%
19%
34% 3%
1%
1%T HE GLOB A L W IND E NE RGY O U TLO OK SC E NA R IO S
2
R EG ION A L B R E A K D OW N : MODE R AT E SC E N A R IO R EGION A L B R E AK DOW N : A DVA N C E D SC E NA R IO
OECD Asia Pacific 3% OECD North America 20% OECD Asia Pacific 4% OECD North America 21%
2030 2030
China 28% 2020 China 26% 2020
2% Latin 2%
22% America 22% Latin
6% America
30% 29% 5%
4% 4%
1% 2% 1% 3%
7%2 T HE GLOB A L W IND E NE RGY O U TLO OK SC E NA R IO S
W I N D POW E R SH A R E OF GLOB A L E L ECT R IC I T Y DE M A N D
35 % Advanced scenario – IEA demand projection Advanced scenario – Energy efficiency demand projection
Moderate scenario – IEA demand projection Moderate scenario – Energy efficiency demand projection
30
New Policies scenario – IEA demand projection New Policies scenario – Energy efficiency demand projection
25
20
15
10
5
0
“2013” “2015” “2020” “2030” “2040” “2050”
2013 2015 2020 2030 2040 2050
New Policies scenario
IEA demand projection 3% 5% 6% 8% 10% 11%
Energy Efficiency demand projection 3% 5% 7% 9% 11% 13%
Moderate scenario
IEA demand projection 3% 5% 7% 13% 15% 17%
Energy Efficiency demand projection 3% 5% 8% 15% 17% 20%
Advanced scenario
IEA demand projection 3% 5% 8% 17% 22% 26%
Energy Efficiency demand projection 3% 5% 9% 19% 25% 31%
SPEC I F IC CO S T S PE R K I LOWAT T I N STA L L E D
1,300 €/kW New Policies scenario Moderate scenario Advanced scenario
1,250
1,200
1,150
1,100
1,050
2013 2015 2020 2030 2040 2050
ASSUMPTIONS ON CAPACITY FACTORS factor will deliver 2190 MWh during a year;
a 2 MW turbine operating at a 35% capacity
The ‘capacity factor’ of a wind turbine or a wind factor will deliver 6132 MWh during a year, etc.
farm refers to the percentage of the nameplate
capacity that a turbine will deliver in terms of Average capacity factors globally today are
electricity generation over the course of a year. about 28%, but vary widely from region to
This is primarily governed by the wind resources region, and are generally increasing with rapid
in the particular location, but is also affected new developments in very windy locations
by the efficiency of the turbine, its suitability in Brazil, Mexico, offshore and elsewhere. As
for the particular location, the reliability of mentioned above, there is also an increased
the turbine, how well the wind project is emphasis on developing new turbines for new
managed, and whether or not it is subjected to locations with lesser wind resources but which
curtailment by the grid operator. For example, may be closer to load centers. These ‘low wind
a 1 MW turbine operating at a 25% capacity speed’ turbines generally are on taller towers
14 GLOBAL WIND ENERGY OUTLOOK | 2014T HE GLOB A L W IND E NE RGY O U TLO OK SC E NA R IO S
2
Kutch wind farm, Gujarat, India
with smaller generators and longer blades, and IEA DEMAND PROJECTION © Wind Power Works
operate with a higher capacity factor.
As a baseline we have used the IEA’s electricity
However, for the GWEO scenarios we have left demand projection from the New Policies
the average global capacity factor at 28% for scenario from the 2013 World Energy Outlook,
the period out to 2030, increasing to 30% after including its assumptions on population and
that date for the rest of the scenario period. The GDP growth, extrapolated out to 2050. Again,
reality is that it will probably be greater than this assumes some measures to curb emissions
that. For the regional scenarios, however, we growth and create a more sustainable energy
have used capacity factors slightly higher than future, but does not foresee dramatic changes.
the global average in OECD North America,
Latin America, Africa and OECD Asia Pacific; With these assumptions, the scenario looks
and slightly lower in India and China, reflecting for electricity demand to grow from around
the realities of those markets today. 20,000 TWh last year to more than 24,000 TWh
by 2020, and to just over 30,000 TWh by 2030;
a 50% increase in a decade.
PROJECTIONS FOR ELECTRICITY
DEMAND DEVELOPMENT ENERGY EFFICIENCY DEMAND PROJECTION
While it is useful to calculate the actual
electricity production from the global
We also measure our progress against
an Energy Efficiency demand projection,
› The trend to
install smaller rated
installations of wind power, it is also helpful originally developed for the Energy machines on taller
to put it in the context of global electricity [R]evolution scenario by the ECOFYS towers with longer
demand, and to thereby determine what consultancy, which has been updated by blades in lower wind
percentage of that growing demand for power researchers at the University of Utrecht3. The speed areas closer to
wind energy can supply. Each of the three study includes the implementation of best demand centers opens
scenarios in this study is set against two practice existing technologies and a certain up new areas for
‹
different projections for the future growth of share of new efficiency technologies, while commercial wind
electricity demand: the IEA demand projection development.
from the New Policies scenario, and an ‘Energy
3 http://www.energyblueprint.info/fileadmin/media/documents/2012/
Efficiency’ demand projection. UU_Demand_projections_for_energy_revolution_2012_30-3-12.pdf
GLOBAL WIND ENERGY OUTLOOK | 2014 152 T HE GLOB A L W IND E NE RGY O U TLO OK SC E NA R IO S
using the same assumptions for population available in the near future. However, it is an
Horns Rev, Denmark © GWEC and GDP growth over the period as the IEA, indicator of what can be done at very low or no
and assuming no structural economic changes cost if we are to be serious about achieving our
beyond those in the IEA scenario. The uptake climate and energy security objectives.
of e-mobility after 2020 is also included in
the study. It does not foresee lifestyle changes SCENARIO RESULTS
or loss in comfort levels, nor does it foresee
‘stranded’ assets, i.e., the early retirement In the IEA New Policies scenario, wind power
of inefficient installations in favour of more contributes just under 1,500 TWh of electricity
efficient ones – which is a very conservative to the global energy mix in 2020, more than
assumption given that such ‘early retirement’ twice the ~620 TWh produced by wind power
is already beginning to occur and seems likely in 2013.
to increase substantially.
Measured against the two different demand
This ‘Energy Efficiency’ demand projection, scenarios, this would count for 6.2 to 6.7%
then, only taps a portion of the potential for of total global electricity demand. By 2030,
energy savings and increased efficiency which this number rises to 2,535 TWh, accounting
are available to us now, and which will likely be for between 8.4 and 9.4% of global demand
16 GLOBAL WIND ENERGY OUTLOOK | 2014T HE GLOB A L W IND E NE RGY O U TLO OK SC E NA R IO S
2
line with the industry’s long term objectives
and consistent with the idea of having global
› Continuous
design refinements
emissions peak before 2020. These numbers and experience with
continue to rise steeply in the subsequent mass producing an
decade, with wind power contributing more increasing number
than 5,000 TWh in 2030, meeting between of turbines have
‹
16.8% and 18.9% of total electricity demand. decreased the cost
of the technology.
INVESTMENT
The capital cost of turbines has been decreasing,
precipitously in some markets over the past
several years, both in adjusted and in absolute
terms. Of late, this has been largely the
result of market forces, but at the same time,
continuous design refinements and experience
with mass producing an increasing number of
the same or similar turbines have decreased the
cost of the technology itself. The other major
factor, commodity prices, has contributed to
the decrease in prices, although the industry
is susceptible to price spikes, particularly for
steel and copper. There are also significant
regional variations, as both competition and
other underlying market factors affect the final
costs, and there will be inter-annual variations
beyond the scope of these scenarios as a result
of market forces, commodity prices and the
rate of inflation.
Regardless, the growth of the wind power
industry is attracting increased investment,
averaging about €50 billion in new wind power
– a respectable number, but far less than wind equipment annually over the past 4 years.
power’s potential contribution.
The development of turbine costs in the GWEO
The GWEO Moderate scenario envisages a scenarios assumes gradually decreasing costs
substantially larger contribution from wind, in absolute terms, reflecting the projected
which would generate nearly 1,750 TWh in 2020, growth of the industry. In the IEA New Policies
rising to almost 3,900 TWh in 2030. This would scenarios the costs remain roughly static over
mean that wind power would meet between the period out to 2030. Capital costs per
7.2% and 7.8% of global electrical demand in kilowatt of installed capacity were considered
2020, and between 12.9% and 14.5% in 2030; to have averaged €1,252 in 2013. For the
quite a substantial contribution, but probably New Policies scenario they don’t change
not in line with what would be required to meet significantly over the scenario period, ending
agreed climate protection goals. up at €1,241/kW in 2030. In the Moderate
scenario prices drop to about €1,214/kW in
The GWEO Advanced scenario shows that 2020 and to €1,203/kW by 2030; and in the
wind power could generate over 1950 TWh Advanced scenario, with rapid scale up, costs
of electricity by 2020, meeting between 8.1% drop more rapidly, down to €1,137 by 2020 and
and 8.8% of global electricity demand, in to €1,100 by 2030.
GLOBAL WIND ENERGY OUTLOOK | 2014 172 T HE GLOB A L W IND E NE RGY O U TLO OK SC E NA R IO S
I N V E S T M E N T A N D E M PLOY ME N T ( A N N UA L I N STA L L AT ION MW )
250000 MW New Policies scenario Moderate scenario Advanced scenario
200000
150000
100000
50000
0
“2013” 2013 “2015” 2015 “2020” 2020 “2030” 2030 “2040” 2040 “2050” 2050
New Policies scenario
Annual Installation MW 35,467 39,989 39,978 32,948 39,679 35,455
Cost € / kW 1,252 1,242 1,240 1,241 1,231 1,231
Investment € billion /year 44 50 50 41 49 44
Employment Job / year 601,519 690,627 721,340 713,645 913,332 945,755
Moderate scenario
Annual Installation MW 35,467 49,131 65,799 84,698 131,883 156,394
Cost € / kW 1,252 1,234 1,214 1,203 1,190 1,186
Investment € billion /year 44 61 80 102 157 186
Employment Job / year 601,519 824,141 1,090,378 1,504,698 2,272,047 2,602,167
Advanced scenario
Annual Installation MW 35,467 54,400 91,273 127,799 192,749 229,790
Cost € / kW 1,252 1,214 1,137 1,100 1,094 1,084
Investment € billion /year 44 66 104 141 211 249
Employment Job / year 601,519 900,324 1,450,753 2,171,804 3,311,064 3,861,712
› The wind industry
creates a large number
Annual investments in wind power equipment
in 2013 were at €44 billion. In the Reference
EMPLOYMENT
of skilled, semi-skilled scenario, this goes up to €50 billion per year by As governments continue struggle with high
and unskilled jobs, 2020, and decreases to €41 billion in 2030. unemployment rates in many parts of the
and this has taken on world, both the current reality and future
an increasing political In the Moderate scenario, annual investment potential for employment in the wind industry
‹
and economic increases to €80 billion by 2020 and to has become increasingly significant. The
importance. €102 billion per year by 2030. Finally, in the industry creates a large number of skilled,
Advanced scenario, annual investments rise to semi-skilled and unskilled jobs, and this has
€104 billion by 2020, and then to €141 billion taken on an increasing political as well as
by 2030. economic importance of late. The macro-
economic effects of the development of the
These figures are indeed large, but they should wind power sector as well as the renewable
be seen in the context of total power sector energy sector as a whole is increasingly a factor
investments, which will, according to the IEA, in political decision making about our future
need to be over €570 billion annually for the energy choices. This is especially the case in
next two decades in the context of the New view of the fact that much of the investment
Policies scenario. and many of the jobs created is in rural areas,
which can help stem the demographic flood
towards the cities.
18 GLOBAL WIND ENERGY OUTLOOK | 2014T HE GLOB A L W IND E NE RGY O U TLO OK SC E NA R IO S
2
Service team at work,
Hamburg, Germany
A number of national and regional assessments needed for operations and maintenance work © Joerg Boethling
of employment in the wind industry have at existing wind farms. Again, there will be
been carried out around the world in recent substantial regional variations, but this also
years, although there is no comprehensive works as a global number.
authoritative ‘ground-up’ assessment. The
assumption we have made and continue Under these assumptions, and on the basis
to make, which is verified by such studies of existing studies, the industry currently
as do exist, is that for every new megawatt employs about 600,000 people, as of the end
of capacity installed in a country in a given of 2013. Under the IEA New Policies scenario,
year, 14 person/years of employment is this number would peak at 780,000 jobs in
created through manufacturing, component 2016, and drop slowly towards 700,000 jobs
supply, wind farm development, construction, by 2030.
transportation, etc. While there is quite
substantial regional variation, this seems In the GWEO Moderate scenario, a very
to work as a global average. As production different picture emerges, with employment
processes are optimised, we project that levels rising to over 824,000 by 2015, 1.1 million
this level will decrease to 13 person/years of by 2020, and to 1.5 million by 2030.
employment per new megawatt installed by
2020, and to 12 person/years of employment In the GWEO Advanced scenario, employment
by 2030. would rise to about 900,000 by 2015, ending
the decade with 1.45 million jobs, and reach
In addition, 0.33 person/years of employment nearly 2.2 million by 2030.
per MW of installed capacity are judged to be
GLOBAL WIND ENERGY OUTLOOK | 2014 192 T HE GLOB A L W IND E NE RGY O U TLO OK SC E NA R IO S
on what sort of power plant it displaces. If it
displaces hydro or nuclear power, the benefit
is small; but if it replaces coal or gas, then the
benefit is enormous. Emissions from fossil fuel
plants range from around 500g CO2/kWh up
to 1200g CO2/kWh or more for the dirtiest
fuels. On the basis of the current electricity
distribution, we have calculated that 600g CO2/
kWh is a good average number to characterize
the savings generated by wind power, although
the regional variations will be significant. While
the majority of the existing plant is in regions
which may be slightly lower than that number,
the majority of new installations are in regions
where what is displaced has significantly higher
than average emissons.
Annual reductions in CO2 from existing wind
power plants were about 372 million tonnes
in 2013. Under the IEA New Policies scenario,
this is expected to rise to 899 million tonnes
annually by 2020 and up to 1,521 tonnes per
year by 2030.
The GWEO Moderate scenario implies savings
of over 1 billion tonnes of CO2/annum by 2020
and more than 2.3 billion tonnes by 2030;
while the GWEO Advanced scenario would
result in savings of nearly 1.2 billion tonnes of
CO2 per year by 2020, and 3.1 billion tonnes/
annum by 2030.
United Nations Secretary
General Ban Ki-moon at the In cumulative terms, the IEA New Policies
UN Climate March in New York
© United Nations Photo CARBON DIOXIDE SAVINGS scenario has wind power saving 7 billion
tonnes by 2020, and over 19 tonnes by 2030.
Wind power has many environmental The GWEO Moderate scenario results in over
benefits, including the elimination of local air 7.5 billion tonnes in cumulative savings by
pollution and nearly zero water consumption. 2020, and 24.1 billion tonnes of CO2 savings
However, the greatest benefit is wind power’s by 2030. The GWEO Advanced scenario yields
contribution to reduction of carbon dioxide cumulative CO2 savings of nearly 7.9 billion
emissions from the power sector, which is the tonnes by 2020, and 28.6 billion tonnes by
› Wind power’s
scalability and its
single largest anthropogenic contributor to the
global climate change problem.
2030.
These are significant reductions in all cases,
speed of deployment Modern wind energy technology has an but the critical issue here is not just the total
makes it an ideal extremely good energy balance. All of the volume of reductions, but the speed at which
technology to bring CO2 emissions related to the manufacturing, these savings are achieved, as these are long-
about the early installation, servicing and decommissioning lived cases, and the imperative is for early CO2
emissions reductions of a turbine are generally ‘paid back’ after emissions reductions to achieve the greatest
which are required if the first 3 to 9 months of operation. For the benefit for the atmosphere. Wind power’s
we are to keep the rest of its 20 year design lifetime, the turbine scalability and its speed of deployment makes
window open for operates without producing any of the harmful it an ideal technology to bring about the early
keeping global mean greenhouse gases which are already disrupting emissions reductions which are required if we
temperature rise to life on earth. are to keep the window open for keeping global
2°C or less above mean temperature rise to 2°C or less above
‹
pre-industrial The benefit obtained from wind power in pre-industrial levels.
levels. relation to CO2 emissions depends entirely
20 GLOBAL WIND ENERGY OUTLOOK | 2014T HE GLOB A L W IND E NE RGY O U TLO OK SC E NA R IO S
2
A N N UA L CO 2 E MI SSION S R E DUCT ION S
7,000 mio tons CO2 New Policies scenario Moderate scenario Advanced scenario
6,000
5,000
4,000
3,000
2,000
1,000
0
“2013” “2015” “2020” “2030” “2040” “2050”
2013 2015 2020 2030 2040 2050
C U M U L AT I V E CO 2 E MI SSION S R E DUCT ION S
150,000 mio tons CO2 New Policies scenario Moderate scenario Advanced scenario
120,000
90,000
60,000
30,000
0
“2013” “2015” “2020” “2030” “2040” “2050”
2013 2015 2020 2030 2040 2050
A N N UA L A N D C U M U L AT I V E CO 2 E MI SSION S R E DUCT ION S ( mio ton s CO 2 )
2013 2015 2020 2030 2040 2050
New Policies scenario
Annual CO2 savings 372 583 899 1,521 2,089 2,655
Cumulative CO2 savings 2,056 3,164 7,045 19,083 37,315 61,354
Moderate scenario
Annual CO2 savings 372 608 1,048 2,333 3,294 4,214
Cumulative CO2 savings 2,056 3,200 7,512 24,132 52,946 90,871
Advanced scenario
Annual CO2 savings 372 619 1,178 3,050 4,769 6,374
Cumulative CO2 savings 2,056 3,213 7,876 28,626 68,858 125,370
GLOBAL WIND ENERGY OUTLOOK | 2014 212 T HE GLOB A L W IND E NE RGY O U TLO OK SC E NA R IO S
RESEARCH BACKGROUND
THE GERMAN AEROSPACE CENTER
The German Aerospace Center (Deutsches
Zentrum für Luft- und Raumfahrt – DLR) is the
largest engineering research organisation in
Germany. It specialises, among other things,
in the development of solar thermal power
station technologies, the utilisation of low and
high temperature fuel cells, particularly for
electricity generation, and research into the
development of high efficiency gas and steam
turbine power plants.
The Institute of Technical Thermodynamics at
DLR (DLR-ITT) is active in the field of renewable
energy research and technology development
for efficient and low emission energy conversion
and utilisation. Working in co-opoeration with
other DLR institutes, industry and universities,
its research focuses on solving key problems
in electrochemical energy technology and
solar energy conversion. This encompasses
application-oriented research, development
of laboratory and prototype models as was
design and operation of demonstration plants. times since then2, most recently in 2012. It
System analysis and technology assessment lays out energy scenarios that are significantly
supports the preparation of strategic decisions lower than current levels, and within the range
in the field of research and energy policy. of scenarios consistent with a 2°C target.
Within DLR-ITT, the System Analysis and Integral to the analsyis was an examination
Technology Assessment Division has long term of the future potential for renewable energy
experience in the assessment of renewable sources, including wind energy. In collaboration
energy technologies. Its main research with the wind industry, the study looks at
activities are in the field of techno-economic regional projections for wind power around the
utilisation and system analysis, leading world, and it is this work which forms the basis
to the development of strategies for the for the Global Wind Energy Outlook scenarios.
market introduction and dissemination of
new technologies, mainly in the energy and The energy supply scenarios used in this report,
transport sectors. which both extend beyond and enhance
projections by the International Energy Agency,
SCENARIO BACKGROUND have been calculated using the MESAP/PlaNet
simulation model by DLR covering all 10 world
DLR was commissioned by the European regions as delineated by the IEA. This model
Renewable Energy Council and Greenpeace has then been developed in cooperation with
international to conduct the study ‘Energy [R]
evolution: A sustainable global energy outlook’, 1 Krewitt W, Simon S, Graus W, Teske S, Zervos A, Schaefer , ‘The 2 degrees
developing global sustainable energy pathways C scenario – A sustainable world energy perspective’; Energy Policy, Vol
35, No. 10, 4969-4980, 2007; and Teske S, Pregger R, Simon S, Naegler T,
up to 2050.1 This study was first published in Graus W, Lins C, “Energy [R]evolution 2010—a sustainable world energy
outlook”, Energy Efficiency, DOI 10.1007/s12053-010-9098-y
January 2007 and has been updated several 2 See http://www.energyblueprint.info
22 GLOBAL WIND ENERGY OUTLOOK | 2014T HE GLOB A L W IND E NE RGY O U TLO OK SC E NA R IO S
2
an energy efficiency study originally developed same parameters as the first study. The study Daman, India © Suzlon
by the Ecofys consultancy to take into account includes the implementation of best practice
the future potential for energy efficiency existing technologies and a certain share of new
measures, beyond those envisaged in the efficiency technologies, while using the same
World Energy Outlook. assumptions for population and GDP growth
over the period as the IEA, and assuming no
ENERGY EFFICIENCY STUDY structural economic changes beyond those in
the IEA scenario. The uptake of e-mobility after
The aim of the original Ecofys energy efficiency 2020 is also included in the study.
study3 developed for the Energy [R]evolution
scenario was to develop low energy demand While maintaining the same level of comfort
scenarios for the period from 2007 to 2050 and standard of living, and without ‘stranding’
on a sectoral basis for the IEA regions as assets, i.e., not including retiring inefficient
defined in the World Energy Outlook series. assets before the end of their economic life,
Energy demand was divided into electricity the study concludes that savings of up to 36%
and fuels. The sectors which were examined can be made in electricity use, and up to 28%
were industry, transport and other consumers, in fuel consumption. While nowhere near the
including households and services. technical potential for energy efficiency and
energy savings, the study shows the enormous
This study has now been updated by researchers potential for emissions reductions offered by
at the University of Utrecht4, maintaining the such measures, which would be an essential
part of any serious efforts to tackle climate
change.
3 www.energyblueprint.info/1211.0.html
4 http://www.energyblueprint.info/fileadmin/media/documents/2012/
UU_Demand_projections_for_energy_revolution_2012_30-3-12.pdf
GLOBAL WIND ENERGY OUTLOOK | 2014 231 C H A P T E R T I TL E
REGIONAL BREAKDOWN OF CUMULATIVE CAPACITY UP TO 2030
OEC D N ORT H A M E R IC A OEC D EUROPE
Total Capacity in MW 2013 2014 2015 2020 2030 Total Capacity in MW 2013 2014 2015 2020 2030
New Policies scenario 70,885 74,191 77,497 118,108 181,398 New Policies scenario 117,006 128,315 140,754 184,539 262,781
Moderate scenario 70,885 80,802 92,207 156,366 295,823 Moderate scenario 117,006 128,647 140,521 203,419 337,234
Advanced scenario 70,885 81,298 92,752 173,684 399,912 Advanced scenario 117,006 129,201 142,616 225,577 386,017
EU 28
Total Capacity in MW 2013 2014 2015 2020 2030
New Policies scenario 117,289 128,672 140,623 182,206 253,847
Moderate scenario 117,289 128,448 139,496 192,664 300,958
Advanced scenario 117,289 129,564 143,067 226,154 389,202
L AT I N A M E R IC A
Total Capacity in MW 2013 2014 2015 2020 2030
New Policies scenario 4,708 7,777 9,771 15,211 24,945
Moderate scenario 4,708 7,777 9,787 28,144 82,242
Advanced scenario 4,708 7,777 10,845 32,680 104,103
A F R IC A
Total Capacity in MW 2013 2014 2015 2020 2030
New Policies scenario 1,156 1,314 1,589 3,896 10,774
Moderate scenario 1,156 1,471 2,416 19,039 75,287
Advanced scenario 1,156 1,471 2,495 20,955 86,012
OECD Europe Germany, Greece, Hungary, Iceland, Ireland, Italy, Luxembourg,
the Netherlands, Norway, Poland, Portugal, Slovak Republic,
Spain, Sweden, Switzerland, Turkey, United Kingdom
EU 28 Austria, Belgium, Bulgaria, Croatia, Cyprus, Czech Republic,
Denmark, Estonia, Finland, France, Germany, Greece, Hungary,
Ireland, Italy, Latvia, Lithuania, Luxembourg, Malta,
Netherlands, Poland, Portugal, Romania, Slovakia, Slovenia,
Spain, Sweden, United Kingdom
Eastern Europe/Eurasia Albania, Armenia, Azerbaijan, Belarus, Bosnia-Herzegovina,
Bulgaria, Croatia, Estonia, Serbia and Montenegro,
the former Republic of Macedonia, Georgia, Kazakhstan,
Kyrgyzstan, Latvia, Lithuania, Moldova, Romania, Russia,
Slovenia, Tajikistan, Turkmenistan, Ukraine, Uzbekistan,
Cyprus, Malta
OECD North America Canada, Mexico, United States Non-OECD Asia Afghanistan, Bangladesh, Bhutan, Brunei, Cambodia, Chinese,
Taipei, Cook Islands, East Timor, Fiji, French Polynesia,
OECD Asia Pacific Australia, Japan, Korea (South), New Zealand Indonesia, Kiribati, Democratic People’s Republic of Korea,
Laos, Macao, Malaysia, Maldives, Mongolia, Myanmar, Nepal,
India India New Caledonia, Pakistan, Papua New Guinea, Philippines,
Samoa, Singapore, Solomon Islands, Sri Lanka, Thailand,
Latin America Antigua and Barbuda, Aruba, Argentina, Bahamas, Barbados, Tonga, Vietnam, Vanuatu
Belize, Bermuda, Bolivia, Brazil, the British Virgin Islands,
the Cayman Islands, Chile, Colombia, Costa Rica, Cuba, Africa Algeria, Angola, Benin, Botswana, Burkina Faso, Burundi,
Dominica, the Dominican Republic, Ecuador, El, Salvador, Cameroon, Cape Verde, Central African Republic, Chad,
the Falkland Islands, French Guyana, Grenada, Guadeloupe, Comoros, Congo, Democratic Republic of Congo, Cote d’Ivoire,
Guatemala, Guyana, Haiti, Honduras, Jamaica, Martinique, Djibouti, Egypt, Equatorial Guinea, Eritrea, Ethiopia, Gabon,
Montserrat, Netherlands Antilles, Nicaragua, Panama, Gambia, Ghana, Guinea, Guinea-Bissau, Kenya, Lesotho,
Paraguay, Peru, St. Kitts and Nevis, Saint Lucia, Liberia, Libya, Madagascar, Malawi, Mali, Mauritania,
Saint Pierre et Miquelon, St. Vincent and the Grenadines, Mauritius, Morocco, Mozambique, Namibia, Niger, Nigeria,
Suriname, Trinidad and Tobago, the Turks and Caicos Islands, Reunion, Rwanda, Sao Tome and Principe, Senegal, Seychelles,
Uruguay and Venezuela Sierra Leone, Somalia, South Africa, Sudan, Swaziland,
United Republic of Tanzania, Togo, Tunisia, Uganda, Zambia,
Middle East Bahrain, Iran, Iraq, Israel, Jordan, Kuwait, Lebanon, Oman, Zimbabwe
Qatar, Saudi Arabia, Syria, United Arab Emirates, Yemen
China People’s Republic of China including Hong Kong
24 GLOBAL WIND ENERGY OUTLOOK | 2014C H A P T E R T I TL E
1
C HI N A
Total Capacity in MW 2013 2014 2015 2020 2030
New Policies scenario 91,424 108,504 125,300 208,387 310,195
E A S T E R N E U ROPE / E U R A SI A Moderate scenario 91,424 108,585 125,546 216,646 414,406
Total Capacity in MW 2013 2014 2015 2020 2030 Advanced scenario 91,424 108,989 126,787 230,048 497,505
New Policies scenario 4,460 5,088 5,509 7,103 14,049
Moderate scenario 4,460 5,491 6,626 14,244 62,051
Advanced scenario 4,460 5,866 8,327 24,748 75,669
N ON - OEC D A SI A
Total Capacity in MW 2013 2014 2015 2020 2030
New Policies scenario 529 812 1,309 5,855 23,005
Moderate scenario 529 812 1,309 6,261 30,730
Advanced scenario 529 869 1,499 16,033 137,231
OEC D A SI A PAC I FIC
Total Capacity in MW 2013 2014 2015 2020 2030
New Policies scenario 7,096 8,075 9,299 18,953 43,148
Moderate scenario 7,096 8,075 9,299 17,518 44,623
Advanced scenario 7,096 8,115 9,387 19,686 79,169
M I DDL E E A S T I N DI A
Total Capacity in MW 2013 2014 2015 2020 2030 Total Capacity in MW 2013 2014 2015 2020 2030
New Policies scenario 99 108 163 1,031 10,982 New Policies scenario 20,150 22,138 25,121 47,896 83,188
Moderate scenario 99 108 208 1,333 11,990 Moderate scenario 20,150 22,138 25,121 49,111 125,382
Advanced scenario 99 108 208 1,333 14,165 Advanced scenario 20,150 22,268 25,445 55,872 154,207
GLOB A L TOTA L
Total Capacity in MW 2013 2014 2015 2020 2030
New Policies scenario 318,128 356,322 396,311 610,979 964,465
Moderate scenario 318,128 363,908 413,039 712,081 1,479,767
Advanced scenario 318,128 365,962 420,363 800,615 1,933,989
GLOBAL WIND ENERGY OUTLOOK | 2014 252 T HE GLOB A L W IND E NE RGY O U TLO OK SC E NA R IO S
3
T HE R EGIONA L
SC E NA R IO R E S ULT S
26 GLOBAL WIND ENERGY OUTLOOK | 2014T HE R EGIONA L SC E NA R IO R E S ULT S
3
A F R IC A – TOTA L W I N D POW E R C A PAC I T Y I N MW
100,000 MW New Policies scenario Moderate scenario Advanced scenario
80,000
60,000
40,000
20,000
0
2010 2011 2015 2020 2030
2013 2014 2015 2020 2030
New Policies scenario 1,156 1,314 1,589 3,896 10,774
Moderate scenario 1,156 1,471 2,416 19,039 75,287
Advanced scenario 1,156 1,471 2,495 20,955 86,012
AFRICA
M ore than 95% of the people without
access to modern energy services
are living either in Sub-Saharan Africa or
in Egypt) or the coal-based generation that has
characterized South Africa’s power system.
Non-OECD Asia1. This problem is especially Given Africa’s vast land mass and relatively
acute in peri-urban and rural areas in Sub- low population density, it seems likely that a
Saharan Africa. In many African countries, broad mix of decentralized technologies will
the electricity that is available is likely to be have the flexibility to meet the needs of many
generated by means of diesel generators or on the continent. Wind power, because of its
other small-scale plant, often using expensive scalability, can and is beginning to play a key
imported fuel. More small generators role in both decentralized and centralized
keep individual businesses, hospitals and systems in several countries.
households running. The high cost of relying
on imported fuels has a great impact on Africa’s wind resource is best around the
some African countries’ economies, and coasts and in the eastern highlands, but it is
many of them spend a considerable share in North Africa that commercial scale wind
of their scarce foreign exchange reserves on power has been developed. At the end of
energy imports. 2013, over 90% of the continent’s total wind
installations of just over 1,255 MW were to be
Local, national or regional grids – where they do found across five countries - Egypt (550 MW),
exist – are challenged by the increasing demand Morocco (291 MW), Ethiopia (171 MW), Tunisia
for electricity from consumer equipment such (104 MW) and Cape Verde (24 MW). South
as refrigerators, lighting, mobile phones, TVs Africa will likely become the largest single
and computers; and outages are frequent. market for wind power in the foreseeable
Large-scale power production in much of future.
Africa is likely to mean large hydro (as found
1 www.sustainableenergyforall.org
Montezuma Hills, California © Anthony Dunn GLOBAL WIND ENERGY OUTLOOK | 2014 27You can also read