COUNTRY PROFILE MOROCCO 2018 - RES4MED
←
→
Page content transcription
If your browser does not render page correctly, please read the page content below
COUNTRY PROFILE MOROCCO 2018

Renewable Energy Solutions for the Mediterranean & Africa
                            RES4MED&Africa

Who we are: RES4MED&Africa promotes the deployment of large-scale and decentralized renewable
energy and energy efficiency in Southern-Mediterranean and Sub-Saharan African countries to meet local
energy needs. Since its inception in 2012, the association gathers the perspectives and expertise of a
member network from across the sustainable energy value chain.

Our work: RES4MED&Africa functions as a platform for members and partners of emerging markets to
foster dialogue and partnerships, share knowledge and build capacity to advance sustainable energy
investments in Southern-Mediterranean and Sub-Saharan African countries.

Our mission: RES4MED&Africa aims to create an enabling environment for renewable energy and energy
efficiency investments in emerging markets through on 3 work streams:
• Acting as a connecting platform for dialogue & strategic partnerships between members and partners to
   exchange perspectives and foster cooperation;
• Providing technical support & market intelligence through dedicated studies and recommendations based
   on members’ know-how to advance sustainable energy markets;
• Leading capacity building & training efforts based on members’ expertise to enable skills and knowledge
   transfer that supports long-term sustainable energy market creation;

At the end of 2015, RES4MED members decided to expand the geographic focus to Sub-Saharan Africa in
light of the huge potentials and growth opportunities for Africa’s renewable energy sector.
Members: RES4MED&Africa gathers a network of 38 members from across the sustainable energy value
chain including industries, agencies, utilities, manufacturers, financing institutions, consultancies, legal and
technical services providers, research institutes, and academia.
Partners: RES4MED&Africa works with local, regional and international partners, agencies and organizations
to pursue its mission and promote renewable energy and energy efficiency deployment in the region of
focus.

ACKNOWLEDGEMENTS

Author: Neimat Khatib (RES4MED)
Supervision: Angelo Guardo (RES4MED)
Contributors: Silvia D’Ovidio (RES4MED) - Ana Rovzar (RES4MED)

                                                                                                                   2
TABLE OF CONTENT

1 Macroeconomic context                                     8
1.1 Geographical aspect                                     8
1.2 Historical aspect                                       8
1.3 Demographic & Socio-economic aspect                     8
1.4 Economic aspect                                         8
1.5 Political aspect                                        9

2 Global energy context                                    10

3 Energy context in Morocco                                12
3.1 Overview                                               12
3.2 Energy overview                                        12
3.3 Electricity demand and supply                          12
3.4 Market Structure                                       16

4 Towards a decarbonisation                                22
4.1 Drivers                                                22
4.2 National Energy Targets                                27

5 Enabling environment                                     31
5.1 Policy Framework                                       31
5.2 Main institutions involved in the electricity market   34

6 Deployment of Projects                                   40
6.1 Hydro Projects                                         41
6.2 Wind Projects                                          42
6.3 Solar Projects                                         49
6.4 Energy Efficiency Projects                             55

7 Private sector Initiatives                               61

8 Challenges                                               63

Conclusion                                                 66

References                                                 67

                                                                3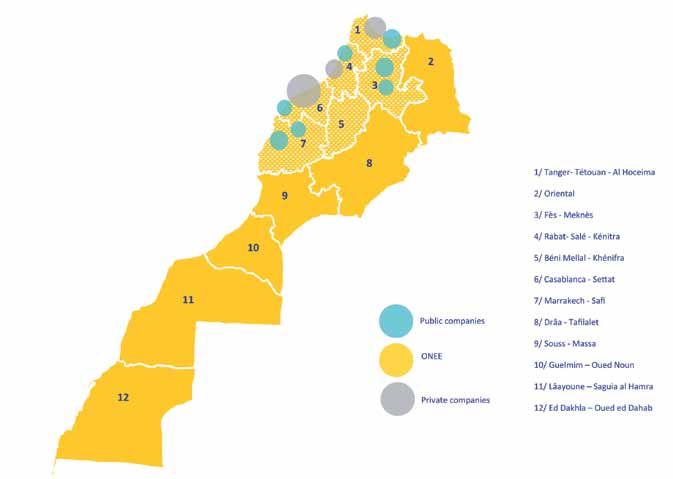
TABLES
Table 1 - Key data (2017)                                                                              9
Table 2 - Electricity market figures (2016)                                                           12
Table 3 - Generation breakdown by contract scheme                                                     17
Table 4 - Expected job creation by 2020                                                               24
Table 5 - GDP growth vs. Electricity growth (2015)                                                    26
Table 6 - Operational Hydropower plants                                                               41
Table 7 - Operational hydropower micro plants                                                         41
Table 8 - Underdevelopment hydropower plants                                                          42
Table 9 - Wind plants in operation before the IWP                                                     43
Table 10 - Projects breakdown: the IWP Phase I - 1/2                                                  45
Table 11 - Projects breakdown: the IWP Phase I - 2/2                                                  46
Table 12 - Projects breakdown: the IWP Phase II                                                       48
Table 13 - Projects breakdown: the ISP Noor Ouarzazate Complex                                        50
Table 14 - Projects breakdown: the ISP Noor PV                                                        51
Table 15 - Projects breakdown: the ISP Noor Midelt                                                    53
Table 16 - Projects breakdown: the ISP by ONEE                                                        54

GRAPHS
Graph 1 - Sources of GHG emissions by sector in the world                                             10
Graph 2 - Growth of the electricity demand (2003-2015)                                                13
Graph 3 - Consumption by primary source of energy (2016)                                              14
Graph 4 - Electricity consumed by sector of activity (2014)                                           14
Graph 5 - Installed capacity by primary source of energy (2016)                                       14
Graph 6 - Electricity demand forecast based on two scenarios                                          15
Graph 7 - National electricity network (2015)                                                         18
Graph 8 - Morocco rural electrification (1995-2005)                                                   19
Graph 9 - Oil Bill in Morocco (2002-2011)                                                             23
Graph 10 - Growth of the electrification rate (1995-2015)                                             26
Graph 11- Long term capacity mix targets                                                              29
Graph 12- Comparison between the national targets with the Paris agreement                            29
Graph 13 - SNI ownership                                                                              38

FIGURES
Figure 1 - Electric market structure                                                                  16
Figure 2 - The six elements driving the transition towards a decarbonisation of the electric sector   22
Figure 3 - Scheme contract for wind project                                                           30

                                                                                                           4
Figure 4 - Scheme contract for solar project                           30
Figure 5 - Timeline of the policy framework (1994-2030)              32-33
Figure 6 - Key institutions                                            34
Figure 7 - Organigram of the MEMDD                                     37
Figure 8 - SNI: Tantacular group                                       38

MAPS
Map 1 - A power regional crossroad between the north and the south     20
Map 2 - Network of distribution within the 12 regions                  21
Map 3 - Hydropower potential                                           24
Map 4 - Wind potential                                                 24
Map 5 - Solar potential                                                25
Map 6 - Renewable energy projects planned by 2020                      40

                                                                             5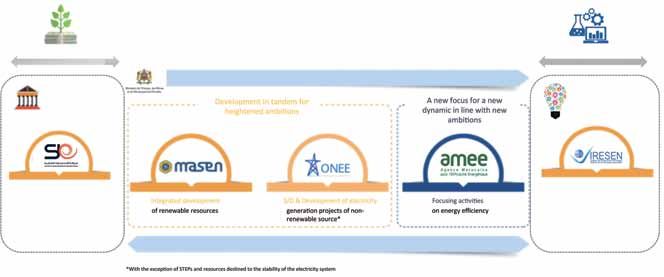
ACRONYMS

AFD      Agence Française de Développement
BOO      Build Own Operate
BOOT     Build Own Operate Transfer
CCGT     Combined Cycle Gas Turbine
CSP      Concentrated Solar Power
DSO      Distributor System Operator
Dh       Dirham (also referred to as MAD)
EC       European Commission
EDF      Energy Development Fund
EIB      European Investment Bank
EPC      Engineering Procurement Construction
EU       European Union
FiT      Feed-in-Tariff
GDP      Gross Domestic Product
GHG      Greenhouse gas
GW(h)    Gigawatt (hour)
IPP      Independent Power Purchase
IRESEN   Institut de Recherche en Energie Solaire et Energies Nouvelles
ISP      Integrated Solar Programme
IWP      Integrated Wind Programme
kWh      Kilowatt Hour
MASEN    Moroccan Agency for Solar Energy
MD       Moroccan Dirham
MEMDD    Ministry of Energy, Mines, Water and Environment
m/s      meter per second
MoU      Memorandum of Understanding
MW       Megawatt
NES      National Energy Strategy
ONEE     Office National de l’Electricité et de l’eau
O&M      Operation and Maintenance
PPA      Power Purchase Agreement
PV       Photovoltaic
RE(S)    Renewable Energy (Source)
SIE      Société d’Investissements Energetiques
SPV      Special Purpose Vehicle
STEP     Station de transfert d’énergie par pompage/pumped storage hydroelectric plant
TPA      Third Party Agreement
TSO      Transmission System Operator
TWh      Terawatt Hour

                                                                                         6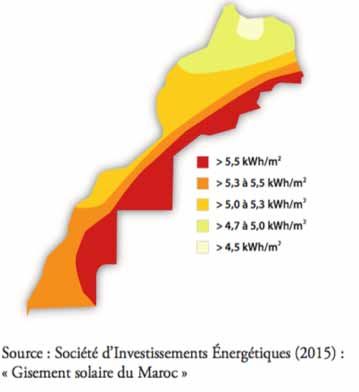
ABSTRACT

From announcing a 52% renewable energy target at COP 21 to launching the first phase of what was at
that time the world’s largest CSP plant (580 MW) under Noor Solar Power project in Ouarzazate, Morocco
has been making impressive headlines and has positioned itself at the forefront of the renewable energy
world. Having no significant conventional energy sources of its own, Morocco is the largest net importer of
energy in Africa. With a young and growing population and plans to continue developing and diversifying
the economy, a precise and committed energy strategy was developed, with renewable energy at the very
core of it. Since 2009, Morocco has taken important strides in developing a modern energy market, further
opening up and reforming the power sector, setting clear renewable energy targets, establishing dedicated
entities to implement the national programs and facilitating the regulatory and financial means necessary.
Despite some delays and setbacks, the Moroccan experience can largely be considered a success, reflected
by the number of private and international developers and financiers already involved in the market and the
number of plants currently being developed that ensure that the initial 42% of installed capacity by 2020
target is on track to be met.
Morocco benefits from strong solar, wind and hydro energy sources and has set out to utilize them by opening
up the market through competitive bidding processes that have resulted in some of the lowest recorded
prices in the respective technologies. Aside from contributing to new installed capacities, the developments
in the energy market have had various positive impacts, attracting foreign direct investments, setting the
foundations for a renewable energy manufacturing industry, creating jobs, initiating energy efficiency
efforts and giving a positive and modern image of Morocco to the world.
This country profile aims to show how Morocco managed to attract the attention of the renewable energy
world, demonstrating how the government’s legislative and institutional efforts are changing the structure
of the power sector in the country.
A full picture of the current renewable energy market and planned projects is given as well as a view of
how it will develop over the next years as the country’s renewable energy plan continues to take shape.
The document provides detailed information on the regulatory framework for renewable energy (laws and
regulations), the main initiatives in the energy efficiency sector and data on the main market operators
active in Morocco.

                                                                                                               7
Chapt 1

1 Macroeconomic context

1.1 Geographical aspect
The considerable ethnic and cultural diversity within the Kingdom of Morocco reflects upon its particular
geographical and historical traits. Influenced by centuries of conquests, migrations patterns and trade routes,
it is bounded by the Mediterranean Sea to the north and the Atlantic Ocean to the west. The Gibraltar Strait
marks its opening to Europe, as 14 km separates it from southern Spain. It is one of three countries alongside
Spain and France to have both Mediterranean and Atlantic coastlines. Via its Atlantic coastline, Morocco has
close access to a key international shipping route, connecting the two major waterways. To the north, land
borders with Spain reinforces its direct access to Europe while its Eastern and Southern borders, respectively
shared with Algeria and Mauritania, tie the Kingdom to the Arab world and Sub-Saharan Africa.

1.2 Historical aspect
The year 1912 marks a territorial division, as Morocco experiences a French and Spanish protectorate, with
an international zone in Tangier. By 1956, its sovereignty is reaffirmed by the gain of its independence. As
the preamble of its constitution highlights, Moroccan national identity encompasses the convergence of
Arabo-Islamic, Amazigh (Berber) and Saharan-Hassanic cultures. This blend is further enriched by its African,
Andalusian, Hebraic and broader Mediterranean influences. The latter speaks to the plurality of its national
identity as well as its ability to adapt to vigorous transformations. It is worth mentioning that in 2016
Morocco reintegrated the African Union after more than 30 years of noticeable absence. The country left
the Union in 1984 following a row over the status of Western Sahara. The Kingdom’s readmission brings
hope of peace-building over the territory as well as broader economic incentives directed to the African
continent. Morocco’s King Mohammed VI has been campaigning since 2016 to rejoin the continental bloc. In
addressing African leaders at the AU summit in Addis Ababa, the monarch reasserted the historical ties by
proclaiming: “Africa is my home, and I am coming back home.”

1.3 Demographic & Socio-economic aspect
The Kingdom has a population of approximately 36 million, making it the 11th most populous African state and
the 5th of the Arab world. The population is expected to increase to 40 million by 2040.
Although the country benefits from stable economic growth, the national unemployment rate remains
high - 9.7 % in 2016. Unemployment particularly affects the urban populations (80.9%), youth (20.1 %)
and university graduates, whose rate of unemployment is double the national average (22.5%). The
United Nations Human Development Index shows that Morocco faces marked socio-economic inequalities,
particularly between urban and rural areas. The latter disparity impacts the economic, social and health
conditions of the population, while accelerating the rural exodus.
Since 2015, Morocco officially administers 12 regions, each one governed by a democratically elected
regional council. The president of the council is responsible for carrying out the council’s decisions.

1.4       Economic aspect
By the beginning of the year 2018, the national currency (dirham) is now on trading on the market. Widen the dirham’s
trading band is part of Morocco’s plan to liberalize the economy and turn the kingdom into a financial hub. Bank Al
Maghrib will also intervene through regular auctions for the dollar, and other currencies when it sees the need, according
to a circular published over the weekend. This new reform will also help Morocco boost its exports, tourism revenues, as
well as Moroccans living abroad remittances, which constitutes Morocco’s main source of foreign currency.
The GDP per capita in 2016 is reported at $2,800 with an average growth rate of 4.13 percent from 1999
to 2017 - reaching an all-time high of 9.30 percent in the second quarter of 2006 and a record low of 0.50

                                                                                                                             8
Chapt 1

percent in the fourth quarter of 1999. Inflation has been kept under 2%, reflecting on a prudent monetary
policy and the ripple effects of the fall in international commodity prices.
Despite diversification in recent years, the agricultural sector is one of the traditional pillars of the Moroccan
economy. Agribusiness accounts for close to 13% of GDP and contributes significantly to local manufacturing
activity and employment (40% of the workforce). As a result, the economy is more vulnerable to adverse
weather conditions than other North African states. Notably, in the last decade incidences of drought
increased, while the lack of investment in irrigation harms the cereal harvest, making it subject to very wide
fluctuation. Drought cut the 2015-16 wheat harvest to just 2.7m tonnes from 8m tonnes in the previous
year. Moroccan economy relies mainly on tertiary sector which represents 57% of its GDP. The industrial
sector accounts for roughly 28 - 29% of GDP. To ensure further prosperity, Morocco is pursuing a strategy
of transformation, modernisation and diversification. It aims to diversify beyond traditional manufacturing
sectors i.e. textile and leather, by boosting the development of industries, such as the pharmaceutical,
aeronautical and automotive. This strategy will enable it to remain an important commercial partner of the
European Union (EU). In addition, a free trade agreement between the EU and Morocco came into force in
2012. The mining industry is dominated by the production of phosphates. Morocco holds approximately 75%
of the world’s phosphate reserves, is the second largest producer and the largest exporter in worldwide. In
terms of other natural resources, the country holds almost no proven oil and gas reserves, however untapped
shale resources are suspected to be found. In this context, renewable energy represents a significant
opportunity. Morocco has an abundance of sunlight and wind, which can counter the country’s reliance on
imported fossil fuels.

1.5 Political aspect
In recent years, Morocco initiated major political and economic changes. These transformations focus on
renewable energies and sustainable development, with the aim of modernising and diversifying the economy.
Morocco’s political landscape has been relatively stable in past decades. The year 2011 marks a political
turning point following the Arab spring, as the adoption of a new Constitution sets the basis for further
democratization, increased decentralisation, a modernization of institutions and broadly, a renewed state of
law is propelled. In parallel, the current coalition government steadily pushes for constitutional reforms and
takes bold steps in reducing the fiscal deficit, namely through the phasing out of fossil fuel subsidies. Over
the past two years, the most important development in the political sphere involved reforms to the pension
system to address the budget deficit - a clear dent to a comprehensive economic plan. International relations
remain generally good, although the Western Sahara issue produce occasional spats with Algeria, Spain and
South Africa among others.
                                           Table 1 - Key data (2017)

                                 ITEM                                        VALUE
                   Area                                                   712.550 km2
                   Population                                                 35.5 m
                   Population Growth                                           1.3%
                   GDP                                                        $110 B
                   GDP per capita                                             $3.077
                   Real GDP growth rate                                        2.4%
                   Inflation                                                   0.4%
                   Unemployment                                               10.1%
                                              Source: World Bank, IMF, High Commission for Planning of Morocco

                                                                                                                      9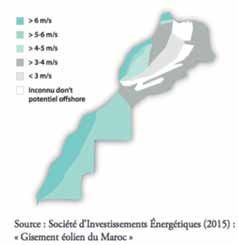
Chapt 2

2 Global energy context

After many years of stability and long-term profitability, the utility industry faced two decades of intensive
transformations, because of rapid changes that occurred at multiple levels.
During the 1990s all transition countries started with economic reforms in infrastructure services, changed
the centralized organization of monopolistic infrastructure utilities and introduced market-oriented
structures and public regulation. Privatization in electricity sector has been undertaken in a variety of
manners but with the same goal to encourage foreign direct investment into the sector and to allow market
liberalization and increasing competition.
The energy industry, which is the source of at least two-thirds of GHG emissions, climate change and other
environmental impacts, has seen companies shift towards RES and sustainability across its value chain -
either as a consequence of international legislation and norms, or as a strategy to capitalise on.

                      Graph 1 - Sources of GHG emissions by sector in the world

                                        Total GHG              CO2 emissions related
                                        emissions               to the energy sector

                                                                                     Electricity: 40% of thew co2
                                                                                  emissions are related to the energy
                                                                                          sector in the world

             16%
       CO2 Land-use                                                 20%
                                                               Transports
                                                                                                            40%
                                                                    40%                                     Electricity
            24%                                            Other sectors
        Other gases                              60%
                                              CO2 lié à l’énergie
                                                                    source: Research Institute for Solar Energy and New Energies

As a result, growth in energy-related CO2 emissions stalled completely in 2015. This was mainly due to an
improvement in the energy intensity of industrialized countries, a trend bolstered by gains in energy efficiency
and RE. In fact, new world records for RE, which accounted for two-thirds of all global net electricity capacity
growth in 2016. This year’s uncontested star is solar photovoltaics (PV), whose capacity for the first time
grew faster than any other fuel. Also, an increasing slice of the roughly 1.8 trillion of investment each year in
the energy sector has been attracted to clean energy, at a time when investment in upstream oil and gas has
fallen sharply. The value of fossil-fuel consumption subsidies dropped in 2015 to 325 billion, from almost 500
billion the previous year, reflecting lower fossil-fuel prices but also a subsidy reform process that has gathered
momentum in several countries. Three main factors contributed to this impressive success story. First, the
rapid deployment and falling costs of clean energy technologies. Second, a strong government policy support,
which initially began in Europe, creating a market that allowed the renewable industry to grow around the
world. Third, the arrival of giant emerging country. The shift to a more services-oriented economy and a cleaner
energy mix in China economies and economies of scale.
In addition, with the emergence of advanced, smarter technologies, consumers can now make more informed
choices about energy usage and become energy producers and storers themselves – known as “prosumers”-
resulting in a bidirectional flow of power. Prosumers usually consume, produce, and control their energy use.
One of the biggest areas of opportunity to trim business operating costs is in managing energy consumption.

                                                                                                                                   10
Chapt 2
In fact, the utilities model is undergoing a paradigm shift with the emergence of the 3D scenario -
‘decarbonisation’, ‘decentralisation’ and ‘digitalisation’ - the energy industry is now faced with several
new challenges. In fact, the global energy transition is gaining momentum, but traditional energy security
concerns have not slipped of the agenda. Fossil fuels have had a turbulent year. Lower oil prices persist. Gas
output is buoyant, but prices are low. The power sector is the largest gas consuming sector, accounting for
40% of worldwide gas demand today. Swathes of the coal industry have sought bankruptcy protection. A
solid place is persisting for oil and gas in energy supply for many years to come.
Today, electricity accounts for just a fifth of total final energy demand. So, the next chapter in the rise of
renewables will require multiplying their uses in the building, industry and transport sectors. For instance,
new uses for renewables in industry are emerging that can open completely new markets and applications.
11Chapt 3
3 Energy context in Morocco
3.1 Overview
The Moroccan electricity sector is characterised by a high degree of energy dependence. Over 90% of
Morocco’s energy supply comes from abroad through imported coal, gas, oil, oil products and electricity. Given
the lack of hydrocarbon sources, Morocco faces fiscal pressures as its balance of payments is disadvantaged
by importing fossil fuels. For the electricity sector only, oil purchases account for 24 % of total imports,
nearly 50 % of the trade deficits and 10-12 % of its GDP.
This dependence left Morocco rather exposed to the volatility of global energy prices. However, the recent
drop in oil prices have allowed the kingdom some “breathing space” and enabled it to begin the diversification
of its installed energy capacity. In recent years, Morocco has passed a series of legislations that aim to
simultaneously decrease the dependence on foreign markets, phase out fuel subsidies by 2017 and increase
the role of clean energy sources. We can already see a progress after recent years transitioning towards a
decarbonisation of the electricity sector. This transition reduced the energy dependency ratio from 98% in
2008 to 93.3% in 2016. Moreover, renewable energies contributed for more than 13% in 2016 to meet the
demand for energy, compared to 2.13% in 2008. As a result of the national energy targets and the policy
framework accompanying it. The 13-09 law related to renewable energy, independent power producers
(IPP) are now able to sell the produced electricity on the high voltage market. Selling on medium and low
voltage is a key point of improvement for the country that is yet to be addressed.
3.2 Energy overview
Morocco’s total energy consumption has reached 10 165 Kiloton of Oil Equivalent (ktoe) in 2015.
Energy consumption has doubled since 2000 and is dominated by oil products, which accounts for (67.6% of
TPES), followed by coal (16.1% of TPES), biofuels and waste (7.4% of TPES), and natural gas (5.7% of TPES), the
use of traditional biomass is declining as access to modern fuel. The total primary energy consumption (TPEC)
has increased at a rate of around 5% a year since 2004, while the per capita increase was somewhat lower at
3.6% a year mainly driven by the transport sector. Moreover, the largest consumer of energy in Morocco is the
transport sector (33.2%), followed by the industry (26%), and the residential and commercial sectors (20.4%).
3.3 Electricity demand and supply overview
About one third of the total primary energy consumption is devoted to electricity generation, a 2.9% increase
on the previous year. The following table sums up the key numbers characterizing the electricity market.
Table 2 - Electricity market figures (2016)
ITEM VALUE (2016)
Electricity Demand 35 414.5 GWh
Electricity Demand Growth Rate (2015/16) 2.91%
Electricity Demand per capita 997.59 KWh
Total Electricity Generation 30 839,8 GWh
Total Installed Capacity 8261.7 MW
Peak daily demand 6 050 MW
Peak daily Demand Growth (2015/16) 3.2%
Rural electrification rate 99.13%
Source: ONEE (Activity book 2016)
12Chapt 3
Electricity demand in Morocco is growing rapidly (4.5% on average between 2003 and 2014), based on the
drivers of a growing population, increased access to electricity through the rural electrification programme
(PERG), development of major infrastructure projects, urbanisation economic growth and improving standards
of living.
Graph 2- Growth of the electricity demand (2003-2015)
GWh
40000
33529 34413
35000 32015
31056
28752
30000 26531
25016
24004
25000 22608
21105
19518
20000 17946
16779
15000
10000
5000
0
2003 2004 2005 2006 2007 2008 2009 2010 2011 2012 2013 2014 2015
source: ONEE
The demand is satisfied mainly through thermal production, which accounted for 25 144 GWh; split roughly:
16 650 GWh coal, 5 600 GWh natural gas and the remaining 2 800 GWh coming from fuel and gasoline while
renewables totalled about 5 400 GWh. However, the following graph does not represent solar energy output
because of its low share accounting for less than 2% of the annual demand in 2016. The solar share exists
because of the Noor I (160 MW CSP plant) which produced in 2016 about 400 GWh, while the central ASSA
owned by the National Office of water and electricity (ONEE) produced 1 GWh of electricity. In addition, an
estimated 279 GWh of power generated provided by solar panels kits equipped in 70 000 households spread
throughout the country, under the electrification program (PERG).
Given the intermittency nature of renewables, sometimes hard to predict especially for hydropower, Morocco
has been importing electricity to bridge the gap between consumption and production. The other factor is
the recent excess of production from wind power sources from Spain, resulting in extremely advantageous
prices that Morocco has been buying. In 2016, Morocco imported approximately 4500 GWh of electricity
supplied from Spain and Algeria.
The following figures depict the consumption by primary source of electricity and by sector in 2016.
13Natural Gas 16% Chapt 3
Graph 3- Consumption by primary Graph 4- Electricity consumed
source of energy by sector of activity
Agriculture 11%
Oil 8%
Imports 15% Transport 1%
Coal 47% Industry 36%
Wind 4%
Hydro 10% 2016 2014
Natural Gas 16%
Residential 33%
source: Solar Plaza, 2017
source: Solar Plaza, 2017
In 2014, the largest electricity consumers sectors in Morocco are the industrial and residential sectors,
accounting for 20,082 GWh of electricity consumption, which
Agriculture 11% constitutes more than two-thirds of the total
Transport 1%
electricity consumption of the country. The commercial sector and the agricultural sector are accountable
for 5,368 GWh and 3,024 GWh of energy consumption whereas 36%
the transport
Industry sector only consumes 332
GWh of energy.
The following graph represents the installed capacity in 2016.
Graph 5- Installed capacity 2014
by primary source of energy (2016)
70%
66%
Residential 33%
60%
50%
40%
30%
22%
20%
10%
10%
1.8%
0%
HYDRO WIND SOLAR TOTAL THERMAL
source: ONEE, 2016
14Chapt 3
Out of the 8261.7MW installed capacity in 2016 almost 5 GW is sourced from fossil fuel sources. The
remaining of installed capacity is sourced from RES. The hydroelectricity is the most prominent energy
source accounting for more than 1.7 GW, whereas wind and solar energy have a capacity of 820 MW and
160 MW respectively.
1. Demand forecast
On the basis of the scenarios developed by MEMDD, it is estimated that following a conservative scenario,
demand for electricity will reach 52 TWh by 2020 and 95 TWh by 2030. On the basis of a high demand
scenario, the demand will be 61 TWh by 2020 and 133 TWh by 2030. This means that the demand will
double between 2014 and 2020 and will quadruple between 2014 and 2030. The annual investment
required to keep up with demand growth is estimated to be about MD 22bn ($2,6bn). Power demand in
Morocco will be robust over the coming decade in line with an expanding manufacturing base in the country.
This will bolster power demand in the market forecasting an electric consumption to average 4.1% annually
between 2017 and 2026. Within this framework, industry accounts for 40 % of consumption, followed by
domestic (32%) and services (17%).
Graph 6- Electricity demand forecast based on two
TWh
140 43 MTEP 133
120
100
25 MTEP
80
61 95
60 18 MTEP
14,7 MTEP
40 34 52
24
20 31
0
2002 2004 2006 2008 2010 2012 2014 2016 2018 2020 2022 2024 2026 2028 2030
Energie primaire Electricité: Scenario de Base Electricité: Scenario haut
source: Ministry of Energy, Mines, Water and Environment of Morocco
2. Electricity price
The electricity tariff system determines a pricing structure that varies according to level of consumption, time
of day and type of meter. In 2015 the end-user price per kWh was between 5 and 17 euro cents (including
14% VAT), with most rates falling within the 6 to 12 cent range (including 14% VAT). (Moroccan-German
Energy Partnership (PAREMA), Oct 2016). Since the abolishment of the numerous fuel/diesel subsidies
(2013-2015), the electricity tariffs started to increase in 2015, after being maintained at their 2009 level
despite the significant rise in fuel costs. The increase mainly concerns the highest tranche of consumption
by low voltage consumers (+3.4%), industrial clients using medium voltage (+13 % on average) and HV and
VHV clients (+6.7%) tariffs for final consumers (residential and professional). As the government seeks to
reduce subsidies and therefore tariffs have increased by regional but still remain below generation costs.
Rural customers have the possibility to participate in a prepaid system based on pre-paid meters. For the
electrical supply, the customer can purchase the desired amounts via rechargeable cards sold for 20 MAD.
The strategic aim is to guarantee a secure energy supply to all of its citizens and simultaneously reduce the
country’s dependence on energy imports.
15Chapt 3
Morocco’s energy structure is undergoing total transformation. Aware of its potential in terms of renewable
energy, Morocco aims, in the long term, to become an exporter of energy to European and African markets
and has the natural resources (wind and solar energy potential and geographical situation) required to
achieve this.
3.4 Market Structure
The electricity sector is still vertically integrated, but significant steps towards the liberalisation of the
sector are underway. For example, the development of the national energy strategy in 2009 and on the
same year the development of decisive framework laws containing provisions for the start of liberalization
of the electricity market, renewable energy and energy efficiency.
The sector is dominated by the state-owned operator: Office National de l’Electricité et de l’Eau (ONEE),
which acts as a producer, distributor and retailer of the water and electric power. ONEE can give concessions
to private operators with purchase guarantees and has the status of single buyer of electricity produced.
Concerning the RE generation, ONEE allows to give concessions to private operators directly with purchase
guarantees (private to private power transactions). The RE law allows electricity to be produced, sold and
exported by any private producer as long as they utilise renewable energy sources. Therefore, there is no
real-time trading or a market operator function.
Moreover, the establishment of a National Energy Regulatory Authority (ANRE) in June 2016 is a further step
towards liberalization of the market. It aims to regulate both electricity and gas markets. As of December
2017, ANRE is not operating yet, and without such a body it leaves ONEE acting as both a decision maker and
regulator. Accelerating the establishment of an independent regulatory authority is key in further opening
up the power market while increasing confidence, transparency and efficiency.
Furthermore, the ministry of Energy, Mining, Water and the Environment (MEMDD) has a responsibility to set
up the energetic strategy and general framework while the ministry of interior is in charge of the supervision
of the autonomous utilities of distribution.
The following illustration shows how the market is structured.
Figure 1 - Electric market structure
Regulated market Free market
ONEE ONEE (29%) IPP (29%) Self-producers IPP (Chapt 3
3.4.1 Generation
The total production from ONEE power plant totals 10 563 GWh in 2016 allowing to satisfy about 29.2% of
the electricity demand. In addition to its own generation facilities, ONEE has signed 10 long term PPAs with
IPPs of which 6 are under operation, and 4 under construction. These include coal, gas, and RES facilities.
Investment in the construction of power plants are generally made through public-private partnerships,
which always involve one of the government energy agencies (usually ONEE or MASEN). Investments can,
however, be wholly public (usually through the ONEE) or wholly private. The possibility of private investments
was provided by the act 13-09 and it is exclusively reserved to renewables investments. The following table
brings a recapitulation of the share of the different generation schemes.
Table 3 - Generation breakdown by contract scheme
Share of the generation
Generation Scheme Contracts schemes contracts
PPAs (IPP) Generation 35%
ONEE’s Power Plants 29%
Electricity imports 14.5%
Private to Private (law 13-09) 2.5%
Self- GenerationChapt 3
The production plant, with a capacity of 5.1 MW Phosboucraa unit based in the southern part of
and a production of 16,000 MWh, was built in Morocco meets 90% of its electricity needs with
Southern Morocco in an area characterized by wind power.
growing demand for electricity. The plant will
supply electricity to a local grinding center This
initiative is expected to reduce the emission of
CO2 by about 12.000 tons per year. Italgen are
currently developing two more clean energy
projects in Morocco; Safi wind farm (10 MW) and
Ait Baha CSP plant (3 MW) demonstrating their
commitment to the market.
3.4.2 Transmission network
ONEE holds a monopoly on transmission, it owns the complete network and is responsible for operating and
expanding the grid. The transmission network covers the entire country -aside from a small network in the
south- grid (400 kV, 225 kV and 60 kV). The following graph represents the breakdown of ONEE network by
very high voltage, high voltage for the transmission grid and medium voltage, low voltage for the distribution
grid. While the on-grid energy diversification is of the utmost importance, those that do not have access
through the national grid rely on several mini-grid and off-grid initiatives which represents 2.5% in 2015. In
2017, the reinforcement of the transmission network amounted to 12 million dhs.
Graph 7 - National electricity network
400 kv 3000
225 kv 9000
150 kv 147
60 kv 1190
Distance km
0 1000 2000 3000 4000 5000 6000 7000 8000 9000 10000
source: ONEE, 2015
1. Rural Electrification Programme (PERG)
One of the most important features of the Moroccan electric sector in recent years, has been the vast
expansion of the electricity network. In 1996, the government launched a 15-year rural electrification
program (PERG) with the aim of increasing rural electrification to 80% by 2010- up from 18% in 1995. In
fact, the program has surpassed its targets, achieving the 80% mark in 2005, and as of October 2015, the
coverage had reached 99.13% for a total investment of MD 22.4bn. The programme includes decentralized
(off grid) with PV kits electrification, micro grid and regular national grid. The off-grid method of electrification
is intended for villages whose cost of connection to the network exceeds the 27,000 dirhams per household
due in particular to their distance from the network or the dispersion of the habitat. While the other micro
grid option was to lower the height of the low voltage poles from 10.5 to 9m and later to 8m. This led to cost
18Chapt 3
reductions of 20%. Another example was to place the transformers of the poles, which led to more than 35%
of cost reductions for transformers. A total of 51,559 PV systems off-grid option covering 105,000 homes
are currently installed and constitutes about 2.5% of total connections achieved within the period of PERG.
The graph below reflects the ration national grid and off-grid systems.
Graph 8 - Morocco rural electrification (1995-2005)
Households
250000
9533
200000 8322
385 976 5070
150000
1308 1218
0 1500
10000
0
50000
108293
106473
153600
151583
111230
120198
155979
178686
233668
72133
0
1996 1997 1998 1999 2000 2001 2002 2003 2004 2005
Households connected to the national grid Households with solar kits
source: Office National de l’Electricité - Rapport Annuel 2005
From 2005 and 2013 the ratio grid connection and solar kits is maintained around 2.5%. Indeed, the vast
majority, 37,099 villages, have been connected to the grid (2,027,120 households), with a smaller but still
significant figure of 3,663 villages being equipped by Solar Home Systems (SHS) (51,559 households).
Given the annual increase in electricity consumption, the greater distances between electricity generation
sites (particularly in the case of major wind and solar power projects) and buyers, and the intermittency
issues of the large renewable energy projects ONEE is now focusing considerable efforts on developing and
modernising the national electricity transmission network. Investments amounting to around 730 million
euros have been earmarked for this purpose, for the period 2014–17 alone.
2. Interconnected network
The transmission grid covers interconnections with the European grid through Spain and the Algerian power
network. The following map illustrates the existing, in progress and understudy interconnection.
19Chapt 3
Map 1 - A power regional crossroad between the north and the south
Portugual
Spain
Morocco
Algeria
Achieved
In progress
Under study
Mauritania
Source: Africa Energy Yearbook, 2016
Morocco shares cross-border power connections with Spain through two submarine power cables. The first
interconnection was commissioned in 1997 with a 700 MW (400kV) capacity and was doubled in 2006
through a second connection by the same capacity, totalling 1 400 MW. The commercial capacity represents
900 MW. ONEE has been the 4th operator in the Spanish market since 1999. A third interconnection is
currently under study. At present, it is the only transmission cables linking Africa and Europe. Morocco has
been importing increasing amounts of electricity from Spain in order to make up its production deficit, but
also to leverage the lower cost of Spanish power compared to the marginal cost of increasing production
locally (wind). The operations are carried out through the Spanish spot market
The second country Morocco shares physical and power connexion with is Algeria, with 200MW (225 kV)
each. The first one was commissioned in 1988, the second interconnection was established in 1992 and the
third followed in 2009. The commercial capacity reaches 1400 MW. The regional power interconnections are
well developed but the actual electricity exchanged are fairly limited. In fact, the trades are carried out in
emergency cases through a contract with SONELGAZ.
With a view of increasing power links with its neighbours, including the Morocco-Portugal project that is
currently under study (capacity of 1,000 MW). In addition, a third interconnection with Spain is being studied,
as well as other projects with Sub Saharan countries through Mauritania. In fact, the expected Morocco-
Mauritania interconnection is under study. As a first stage, Laayoune-Dakhla is on progress (400kv).
3.4.3 Distribution system
The distribution sector is managed by many actors and could be divided in three categories: Public, private
and ONEE. The national office owns and operates the majority of the distribution network (52%) and is the
main retail supplier. Overall, there are no retailers per se, the DSO acts as a retailer in the region of operation
given the unbundling feature of the market structure. Responsibility for the distribution subsector is divided
at the Government level between the MEMDD which has oversight over ONEE, and the MI, which supervises
the overall performance of the public enterprises responsible for the distribution of water and electricity in
large urban areas.
20Chapt 3
The power distribution subsector includes seven local municipal utilities (Régies) as well as three private
distribution utilities (gestionnaires délégués). Essentially, the local authority assigns to the private sector
the task of investment, construction and operation to deliver electricity, water and sewerage to the
municipalities through long-term concession agreements and performance objectives for public services so
as to protect the interest of consumers and the environment. -
Several cities have granted concessions for their utilities. The French Lyonnaise des Eaux (Lydec) is the
distribution company of Casablanca with 600 000 customers, is controlled by Suez with a majority stake
of 51% (Fipar Holding 16%, RMA Watnya 16.2%, floating 16.8%; it has a 30-year concession contract since
1997. Two other private distributors are Redal (Rabat) and Amendis (Tangier and Tetouan). The private
partner must achieve an efficient and financially sustainable management of the public service, adopt a
commercially-minded approach and provide the technical expertise to make the appropriate investment and
operational decisions.
The distribution network is made up of 80 662 km medium voltage and 199 300 km low voltage line. The
map below illustrates the geographical localisation of the distribution sector for medium and low voltage
network.
Map 2 - Network of distribution within the 12 regions
Source: ONEE workbook, 2016
21Chapt 4
4 Towards a decarbonisation
4.1 Drivers
This section will first display the key drivers that foster the transition towards the decarbonisation, followed
by the national target-setting regarding RE and EE. The next section will sum up the enabling environment
and conditions to achieve such targets which are the designated legislative and regulatory framework,
followed by the illustration of the key institutions.
Figure 2- The six elements driving a decarbonisation of the electric sector
Climate change End Fossil Fuel
Dependence
Ratification of the
Paris Agreement
South south Social
cooperation and Morocco NDCs:
Reduction of
benefits
European partner
more than 42%
of GHG below
business-usual
(BAU) levels by
2030
Capitalise
Energy security lts RE Potential
4.1.1 Climate change
Due to its geographical location, Morocco is strongly affected by climate change (desertification, flooding and
decreasing water resources) and its vulnerability will increase in the future. For this reason, between 2005
and 2010 the government devoted 64 % of its climate-related expenditures to mitigation and adaptation.
This demonstrates the measure of the climate change challenge to the country which is accentuated by
various factors such as the level of awareness of the population, the legal framework. An approach adapted
by territory and economic structure is necessary especially for the sectors with high dependence on water
resources, such as agriculture and the coastal areas.
According to estimates, during the 21st century agricultural production could decline by 15 to 40 %. This
entails the risk of rising food prices, an aggravation of social inequality and the destabilisation of the entire
socio-economic equilibrium of the country. Added to the increase in population and forecast industrial needs,
these vulnerabilities will progressively increase, impacting not only the agriculture sector, but the entire
economy and stability of the nation.
4.1.2 Reduce energetic imports
Highly sensitive to exogenous shocks, Morocco dependence on fossil fuels imports has grown over the years
and weighs heavily on the economic and financial equilibria of the country. The fossil fuels subsidy system
22Chapt 4
set up in 2000 is mainly concentrated on diesel, fuel and butane. In 2011, it cost Morocco 5.1 % of its GDP
or Dh 41.4 billion (Euros 3.7 billion) as against nearly nothing in 2003. This ratio is considered eventually
untenable for public finances. Thus in 2011, the public deficit amounted to 6.8 % or nearly the equivalent of
the cost of the subsidies. This system, as underlined by a study undertaken by the International Monetary
Fund in 2013 on the reform of state subsidies to fuels in Morocco, is not efficient in sustaining the living
standards of the poorest. Quite the contrary, it benefits the largest consumers.
Graph 9- Oil Bill in Morocco (2002-2011)
Billions Dhs
80
70
60
50
40
30
20
10
0
2002 2003 2004 2005 2006 2007 2008 2009 2010 2011
Source: Ministry of Energy, Mines, Water and Environment of Morocco (2013)
Today, the total indexation of petrol and fuel and abolished the related subsidies. Also, the subsidy on fuel was
abolished as well as that on the special fuel used for electricity production within the framework of the ONEE-
Government contract. Moreover, in 2015 the liquid fuel prices obey to the free play of supply and demand.
However, the government continues to subsidise the price of butane. The State assumes about two-thirds
of the price of a 12kg flask. Currently the reform of the compensation system is being studied and aims to
target budgetary support for needy households. These subsidies will be replaced by direct aid to the 8.5
million Moroccans living below the poverty threshold. However, the Minister of General Affairs, stated in June
2016 that the conditions for ending the butane subsidy had not yet been fulfilled. The butane amounted
to nearly Dh 16 billion in 2015. In 2017, the state only continues to subsidies butane weighing on the
government budget and so affecting the deficit trade balance affecting directly its GDP. Clearly being able
to sustain energetically would be an outstanding advantage for Morocco.
4.1.3 Social impacts
In a country like Morocco the decentralised character of RE can especially benefit poor rural areas. Indeed, today RE
technologies are giving certain and reliable access to electricty, enabling an improvement in the lives of the least
developed communities. For example, in the rural community of Haouiza, 12 km from El Jadida, the installation of
solar panels has enabled the powering of a water pump in a rural school. Before that the school was not connected
either to water or to the grid and there were no sanitary infrastructures. The impact of water availability in the
school and of sanitary infrastructure had the effeect in particular of prolonging girls’ enrolment up to the age 14
and thus increasing their numbers, from 25 % of total enrolments in 2010 to 48 % in 2015.
23Chapt 4
Table 4 - Expected job creation by 2020
Sectors Jobs to be created Growth rate (%)
by 2020
CSP 6100 45.86%
PV 4700 35.34%
Biomass 1300 9.77%
Wind 1100 8 27%
Micro-Hydro 100 8.27
RE 13300 26.55%
EE 36800 73.45%
Source: Ministry of Mines, Environment and Water of Morocco (2013)
With an unemployment rate that turns around the 10%, a majority of women, young generation and rural
areas are the first affected. The other elememt that RE and EE bring a positive impact is the job creation.
For example, Noor I alone (160 MW solar plant) has employed 1000 people during the construction phase
and has created approximately 60 permanent jobs. Not only in terms of quantity and number of jobs but also
bringing an expertise and new skills to the workers. The following table sums up the expectations for the
job creation by sector of RE and EE. Note that the EE presents an essential oppportunity in the job crea tion.
4.1.4 Renewable energies and energy efficiency potential
Morocco’s strong dependence on fossil fuel imports seriously endangers its future energy security, weighs heavily
on its economic and financial equilibria. Indeed, Morocco is scantily endowed with conventional energy resources.
However, it benefits from a topography and climate which are extremely well suited to the development of RE,
in particular solar and wind. The next section will display RE maps potential in Morocco followed by EE potential
Hydraulic Wind
The nation already has a hydroelectric structure Morocco benefits from rich wind regimes especially
which covers basic energy needs. In 2015 installed along its 3.500 km long coast. Essaouira, Tangier
capacity reached 1,770 MW and its hydroelectric and Tetouan are especially impressive with average
potential is estimated at 3,800MW. wind speeds between 9,5-11 (m/s). Tarfaya, Taza
and Dakhla record wind speeds between 7,5-9,5
Map 3 - Hydropower potential m/s. The total wind potential is 7.9 TWh/year while
technical wind potential stands at 4.8 TWh/year and
exploitable potential is judged to be at 25 GW, of
which 6 GW could be installed by 2030.
Map 4- Wind potential
24Chapt 4
Solar Biomass
Solar is certainly the leading source of RE in Morocco’s large agricultural sector and the fact that
Morocco since its solar resources are equivalent to a large part of the waste generated is made up of
20,000MW, with more than 3000 hours a year of organic components are a boon to power generation
sunshine and irradiation of 5 kWh/m2/day. Mainly 5 from biomass and biogas. Morocco also has plans
sites: A Beni Mathar (Oujda); Ouarzazate; Sebkhat to generate bioenergy using household waste and
Tah; Foum Al Ouad; and Boujdour. biogas using wastewater. The aim is to strengthen
the biomass sector, with a view to replacing fuel
Map 5- Solar potential oil in the industrial sector. However, there are no
national strategies in place at present to tap into
this potential, although some small enterprises have
already initiated operations in this field.
Energy Efficiency Potential
The potential of EE is limitless as diversifying to cleaner, more efficient fuels, RE and reducing energy use and
intensity can always be expanded through ever-evolving technology, dedicated government programmes
and wider public awareness. The Ministry of Environment estimated a potential 50.9 million (tCO2/yr) savings
from energy-related ‘nationally appropriate mitigation actions’ (NAMAs), encompassing wind energy, solar
energy, solar heating, low energy light bulbs, green cities and EE in buildings, industry and public lighting.
Morocco is in fact the 14th most attractive country for RE today. It is ranked first in the MENA region
and second in Africa behind South Africa according to the RE barometer « Renewable Energy Country
Attractiveness Index » issued by Ernst & Young in 2016. The quality of resources is such that the price
of wind and solar energy is already competitive with the price of fossil fuel based energies: prices of wind
projects vary between Dh 0.31 (US$ 0.03 cents/Kwh) for the Integrated Wind Project; Dh 0.57 (US0.05
cents/Kwh) at Taza and Dh 0.72 (US$0.07 cents/Kwh) at Tarfaya. The price of thermo-solar projects at
Ouarzazate vary between Dh 1,5 (US$ 0.15 cents/KWh) at NOOR O CSP I with 160 MW and 3 hours storage
and Dh 1.4 (US$ 0.14 / KWh) at NOOR O CSP II and NOOR O CSP III with 350 MW with 8 hours storage. In
comparison, the fuel fossils import price during the last ten years has been 0.97 Dh (US$ 0.09 / KWh.
25Chapt 4
4.1.5 Energy security
The graph below shows the evolution of Morocco’s electrification rate since the launch of the PERG program.
Graph 10- Growth of the electrification rate (1995-2015)
100% 96,5% 98%
88%
80%
72%
60%
50%
40% 27%
18%
20%
0%
1995 1997 1999 2001 2003 2005 2007 2009 2011
Source: Source: Ministry of Energy, Mines, Water and Environment of Morocco
As stated in section III, the huge success of the PERG program in connecting all of the country to the grid in a
considerably short time is impressive and set the basis for a growing and diversifying economy, achieving steady
growth year-on-year. Yet, the higher electrification levels coupled with a growing population and economy comes
with its own set of economic and environmental challenges. While on the one hand, these policies have allowed
the country to reach near 100% electrical coverage, the increase in demand has led to the raise of an already high
energy imports. Thus, the RES have the opportunity to respond to the higher energy demand problematic.
Table 5 - GDP growth vs. Electricity growth
GDP Growth Electricity Demand
Average of 5% Growth
Average of 6.5%
PRIMARY ENERGY ELECTRICITY
x2 until 2020 x2 until 2020
x3 until 2030 x4 until 2020
This development contributed to a steady growth rate of 4 to 5 % a year, led to a strong boost to electricity demand. In fact,
during the last ten years, and driven by the generalisation of electricity access, improved living standards and demographic
growth, electricity demand in Morocco grew at 6.6 % a year with a structure increasingly resembling that of developed
countries. It thus went from 15 540 GWh in 2002 to 35 414 GWh in 2016. A further 70 % increase is foreseen up to 2025.
To meet rising demand and at the same time reduce dependence on foreign countries, the government has
sought to encourage as much investment as foreign as possible in new RES plants.
26Chapt 4
4.1.6 South-south cooperation
The country intends to become the ‘electricity hub for North and West Africa’ (ONEE). Not only in terms
of electricity traded, but also capacity building and innovation. Indeed, Morocco is planning to develop an
expertise in the field of energy. IRESEN is an example of R&D organisation created in order to implement
innovative solutions for managing energy production and to adapt it to the Moroccan and African needs.
At the COP 21 summit held in Paris, His Majesty King Mohammed VI hailed Africa as the ‘continent of the future’.
Morocco promotes South–South cooperation as a long-term goal, seeking to establish equitable economic relations
with other African countries, particularly in West Africa and sub-Saharan Africa. In order to achieve this visionary
goal, various projects will be launched in the years to come to strengthen the role of Morocco as an engine of
economic growth in the African continent. Since 2013 Morocco has significantly strengthened its political ties
and, above all, its economic relations with numerous African countries, including Senegal, Mali, Côte d’Ivoire, Gabon,
Guinea and Mauritania. In recent decades some Moroccan sectors, such as banking and services, have built up
robust capacities at home, and many Moroccan enterprises are now well positioned in African markets.
Some Moroccan banks, such as Attijariwafa Bank and BMCE Bank, are already operating in various African countries, as
is Maroc Telecom, which had 51 million customers in sub-Saharan Africa in 2015. The Office Chérifien des Phosphates
(OCP), a publicly-owned company that produces phosphates and fertilisers, is also well established in various African
markets. The ONEE too is active in a number of African countries. Its first inroads into the rural electrification market
was in Senegal. As we can see, a whole range of Moroccan enterprises across a variety of sectors are now operating
in North Africa and sub- Saharan Africa. For many years now, the state-owned airline Royal Air Maroc has offered
direct flights to Africa’s main economic centres at affordable prices. It is one of Africa’s top airlines, flying to 32
destinations in 26 countries throughout the continent – an asset that should not be underestimated.
Morocco’s national trade fairs and exhibitions have long had a regional scope and increasingly focus on
African markets. Between 2003 and 2013 Morocco’s exports to African countries increased fivefold, rising
from approximately 200 million euros to around one billion euros.
The country is reactivating its traditional trade relations with Africa, which opens up opportunities for companies
seeking to enter the Moroccan market and with plans to break into other African markets. They can use Morocco
as a base for their operations and also take advantage of Moroccan structures in place in other African countries.
4.2 National Energy Targets
Short-term vision Medium-term vision Long-term vision
2009-2012 2013-2019 2020-2030
01
Equilibrium of electric power
02
Improve energy mix Open options on
03
between demand and supply alternative energy source
• Strengthen the insalled capacity • Natural gas • Nuclear
• Improve EE • RE/EE
1400 MW installed > 14b dhs
27Chapt 4
Aware of the nation’s energy stakes and the promising future of green energy sources, in 2009 Morocco
planned mitigation actions under the National Energy Strategy (NES), which aims to achieve Morocco’s NDC,
include the implementation of an ambitious 42% target of installed electricity capacity of 6 GW from RES by
2020. The program lays down strategic directions and general conditions for the development of RE, as well
as EE highlighting Morocco’s desire to press ahead with the energy transition.
Graph 11 - Long term capacity mix targets
RENEWABLES will increase up to 52% of the Capacity Mix by 2030
PART OF
34% 43% 52%
RENEWABLES
2015 2020 2030
Natural Hydro Natural Hydro Natural Hydro
Gas 22% Gas 14% Gas 12%
10% 6% 23%
Wind Wind
Coal Coal 20%
31% Wind 36% 15%
10%
Solar Solar
2% 14% Coal
Solar
21%
20%
25% 15% 4%
Heavy fuel Heavy fuel Heavy fuel
INSTALLED
CAPACITY 8,2 GW 15 GW 25 GW
40 Billions US$: Total Investments between 2015 and 2030
The objectives of the national programme are the following:
• energy security;
• access to energy at affordable prices;
• energy management;
• environmental protection
Followed by the strategy to:
• optimise and diversify the electricity generation capacity mix
• implement a drive to increase RE,
• increase awareness of the EE issues;
• promote the exploitation of national oil and natural gas deposits;
• improve the regional integration of electricity transmission network.
At the COP21 summit held in Paris, King Mohammed VI ratified the agreement and announced the next
target by 2030, which will account for installed RE of 52% representing 13GW. Between 2016 and 2030,
total investment for the energy sector should reach US$ 40 billion, which according to the MEMDD will
represent major new opportunities for the private sector and enable a 32 % reduction in GHG emissions by
2030. The following graph compares the compatibility between the Paris agreement target (below 1.5 C)
and the national targets.
28You can also read