ElectRicity stoRage Renewables
←
→
Page content transcription
If your browser does not render page correctly, please read the page content below
Renewables and
electRicity storage

                June 2015
Copyright © IRENA 2015
Unless otherwise stated, this publication and material featured herein are the property of the
International Renewable Energy Agency (IRENA) and are subject to copyright by IRENA. Material in this
publication may be freely used, shared, copied, reproduced, printed and/or stored, provided that all such
material is clearly attributed to IRENA and bears a notation that it is subject to copyright (© IRENA), with
the year of the copyright. Material contained in this publication attributed to third parties may be subject
to third-party copyright and separate terms of use and restrictions, including restrictions in relation to
any commercial use.

About IRENA
The International Renewable Energy Agency (IRENA) is an intergovernmental organisation that
supports countries in their transition to a sustainable energy future, and serves as the principal platform
for international co-operation, a centre of excellence, and a repository of policy, technology, resource and
financial knowledge on renewable energy. IRENA promotes the widespread adoption and sustainable
use of all forms of renewable energy, including bioenergy, geothermal, hydropower, ocean, solar and
wind energy, in the pursuit of sustainable development, energy access, energy security and low-carbon
economic growth and prosperity. www.irena.org

Acknowledgements
Special thanks go to the participants of IRENA International Energy Storage Policy and Regulation
workshops in Düsseldorf, Germany on 27 March 2014; in Tokyo, Japan, on 7 November 2014; in New Delhi,
India, on 3 December 2014; and in Düsseldorf, Germany, on 10 March 2015. Doina Lin and Heiko Stutzinger
(Messe Düsseldorf) were instrumental in the organisation of these workshops. The report has also
benefited from valuable comments provided by external reviewers: Philipp Blechinger (Reiner Lemoine
Institut), Arnon Blum (EnStorage), Melicia Charles (CPUC), Penelope Crossley (University of Sydney),
Jens Drillisch and Daniel Etschmann (KfW), Chris Edgette and Janice Lin (Strategen Consulting, the
California Energy Storage Alliance, and the Global Energy Storage Alliance), Thembakazi Mali (SANEDI),
Kristian Petrick (IEA-RETD), Silvia Martinez Romero (World Bank), Michael Salomon (Clean Horizon),
Dudley Achu Sama (Valdas & Company Ltd), Franck Al Shakarchi (Atomic Energy and Alternative
Energies Commission, France), Ralph Sitte (Federal Ministry for Economic Affairs and Energy, Germany),
Jurgen Timpert (DNV GL), Riccardo Toxiri (GSE S.p.A), Rahul Walawalkar (Customized Energy Solutions
and India Energy Storage Alliance), Junill Yoon (Hyosung Corporation), and Andreas Zucker (Joint
Research Centre, European Commission). IRENA is grateful for the generous support of the Ministry of
Economy, Trade and Industry of Japan, which made the publication of this report a reality.

Authors: Ruud Kempener (IRENA) and Gustavo de Vivero (IRENA)

For further information or to provide feedback, please contact: rkempener@irena.org or
secretariat@irena.org.

Disclaimer
This publication and the material featured herein are provided “as is”, for informational purposes only.
All reasonable precautions have been taken by IRENA to verify the reliability of the material featured in
this publication. Forward looking projections are inherently uncertain. A complete understanding of the
assumptions underlying the conclusions and the methodologies used to create such projections may be
sought from the party to whom such projections are attributed. Neither IRENA nor any of its officials,
agents, data or other third-party content providers or licensors provide any warranty, including as to
the accuracy, completeness, or fitness for a particular purpose or use of such material, or regarding the
non-infringement of third party rights, and they accept no responsibility or liability with regard to the
use of this publication and the material featured therein.

The information contained herein does not necessarily represent the views of the Members of IRENA,
nor is it an endorsement of any project, product or service provider. The designations employed and
the presentation of material herein do not imply the expression of any opinion on the part of IRENA
concerning the legal status of any region, country, territory, city or area or of its authorities, or concerning
the delimitation of frontiers or boundaries.

Renewables and Electricity Storage

A technology roadmap for REmap 2030

              JUNE 2015

CONTENTS
LIST OF FIGURES���������������������������������������������������������������������������������������������������������������������������������������������������������������������������IV
LIST OF TABLES������������������������������������������������������������������������������������������������������������������������������������������������������������������������������ V
LIST OF BOXES�������������������������������������������������������������������������������������������������������������������������������������������������������������������������������� V
ABBREVIATIONS����������������������������������������������������������������������������������������������������������������������������������������������������������������������������VI
INTRODUCTION TO REMAP 2030���������������������������������������������������������������������������������������������������������������������������������������������1
SUMMARY OF KEY FINDINGS��������������������������������������������������������������������������������������������������������������������������������������������������� 4
Approach���������������������������������������������������������������������������������������������������������������������������������������������������������������������������������������8
Priority areas for action�����������������������������������������������������������������������������������������������������������������������������������������������������������8
PRIORITY AREA 1: SYSTEM ANALYSIS FOR STORAGE�������������������������������������������������������������������������������������������������� 11
Action 1.1: Engage and guide stakeholders����������������������������������������������������������������������������������������������������������������� 12
Action 1.2: Provide systemic value assessment for storage���������������������������������������������������������������������������������� 14
Action 1.3: Support system analysis of electricity/heat/fuel/productive uses as storage options������� 17
PRIORITY AREA 2: STORAGE IN ISLANDS AND REMOTE AREAS�������������������������������������������������������������������������20
Action 2.1: Facilitate financing������������������������������������������������������������������������������������������������������������������������������������������20
Action 2.2: Create local value chains������������������������������������������������������������������������������������������������������������������������������� 21
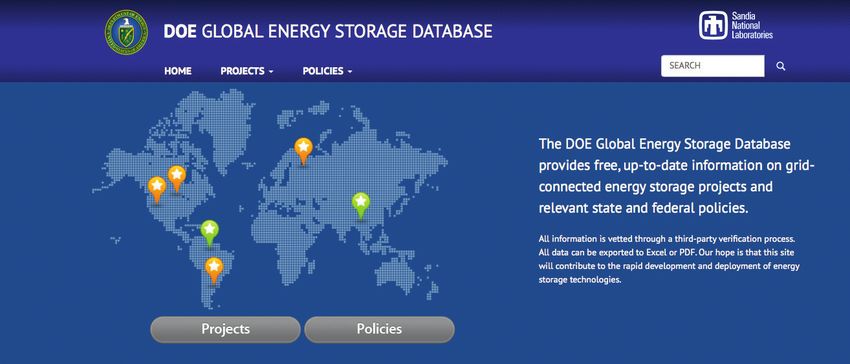
Action 2.3: Develop a global database containing practical examples������������������������������������������������������������ 22
Action 2.4: Guide policy makers to the required analytical tools������������������������������������������������������������������������ 24
PRIORITY AREA 3: STORAGE FOR SELF-CONSUMPTION OF RENEWABLE POWER����������������������������������� 26
Action 3.1: Comparative information sheets and labelling������������������������������������������������������������������������������������ 27
Action 3.2: Accelerate standards on safety and recycling������������������������������������������������������������������������������������� 28
Action 3.3: Create legal frameworks for (data) ownership and liability�����������������������������������������������������������29
PRIORITY AREA 4: STORAGE COUPLED TO RENEWABLE POWER GENERATION����������������������������������������� 31
Action 4.1: Support the development of innovative regulation�������������������������������������������������������������������������� 32
Action 4.2: Support for localised/distributed systems�������������������������������������������������������������������������������������������� 33
PRIORITY AREA 5: STORAGE IN TRANSMISSION AND DISTRIBUTION GRIDS������������������������������������������������ 35
Action 5.1: Pumped-storage hydroelectricity and CAES analysis���������������������������������������������������������������������� 35
Action 5.2: Support demonstration projects for new business models����������������������������������������������������������� 37
TRACKING PROGRESS FOR POLICY MAKERS��������������������������������������������������������������������������������������������������������������� 40
CONCLUSIONS������������������������������������������������������������������������������������������������������������������������������������������������������������������������������� 42
REFERENCES����������������������������������������������������������������������������������������������������������������������������������������������������������������������������������43
A te ch n o l o g y ro a d ma p fo r RE ma p 2 0 3 0 iii
List of Figures
     Figure 1: Annual share of annual variable renewable power generation in 2014 and in 2030
               if all REmap options are implemented.................................................................................................................2

     Figure 2: Cost assessments for electricity storage systems..........................................................................................6

     Figure 3: Assessing value of storage per kilowatt-hour..................................................................................................7

     Figure 4: Potential locations and applications of electricity storage in the power system...............................8

     Figure 5: Priority areas and action items for the IRENA technology roadmap
               on electricity storage..................................................................................................................................................9

     Figure 6: Electricity storage services and their relevance for renewable power integration.......................... 11

     Figure 7: Procedure for engaging and guiding stakeholders in developing
               energy storage policies for renewables............................................................................................................ 12

     Figure 8: Comparing costs to a stack of energy storage benefits............................................................................ 15

     Figure 9: Different system options available for storing electricity produced from
               variable renewables.................................................................................................................................................. 17

     Figure 10: DOE Global Energy Storage Database............................................................................................................. 23

     Figure 11: Grid parity of PV storage in Germany............................................................................................................... 27

     Figure 12: Different services electricity storage systems can provide to integrate
                power generation from variable renewables.................................................................................................. 31

     Figure 13: Share of pumped-storage hydroelectricity in global electricity storage system (in MW)..........36

iv   R e newa bles a nd El e c t r i c i t y Storage
List of Tables
Table 1: Battery storage performance and costs for residential systems
in the German market in 2012������������������������������������������������������������������������������������������������������������������������������������5
Table 2: Southern California Edison procurement of energy storage in 2014�������������������������������������������������������14
Table 3: Key stakeholders in storage system analysis����������������������������������������������������������������������������������������������������� 19
Table 4: Key stakeholders in electricity storage systems for renewable energy deployment
on islands or in remote areas���������������������������������������������������������������������������������������������������������������������������������� 25
Table 5: Key stakeholders in electricity storage options for renewable power self-consumption���������������30
Table 6: Key stakeholders in electricity storage systems for renewable power generation��������������������������34
Table 7: Key stakeholders in electricity storage systems to support grid infrastructure�������������������������������� 39
Table 8: Indicators of technological progress in storage systems for renewable power deployment������ 40
Table 9: Indicators to evaluate the benefits of storage systems for renewable power deployment����������� 41
List of Boxes
Box A: Assessing the global electricity storage market for renewables...................................................................3
Box B: Cost and value of electricity storage........................................................................................................................ 4
Box C: Energy storage policy and market development in California..................................................................... 13
Box D: Assessing the value of electricity storage in Italy..............................................................................................16
Box E: Relevance of electric vehicles to storage for renewable energy grid integration................................. 18
Box F: Local value creation for energy storage in Bangladesh................................................................................. 22
Box G: Electricity storage for local use................................................................................................................................ 33
Box H: Hydroelectricity as virtual storage system in Brazil.........................................................................................36
Box I: India’s national storage mission................................................................................................................................ 37
A te ch n o l o g y ro a d ma p fo r RE ma p 2 0 3 0 vABBREVIATIONS
CAES compressed air energy storage
CEA Central Electricity Authority of India
DOE United States Department of Energy
EPRI Electric Power Research Institute
GW gigawatt
GWh gigawatt-hour
IEA International Energy Agency
IESA Indian Energy Storage Alliance
IRENA International Renewable Energy Agency
KIT Karlsruhe Institute for Technology
kW kilowatt
kWh kilowatt-hour
kWp kilowatt-peak
MNRE Ministry of New and Renewable Energy
MW megawatt
MWh megawatt-hour
NREL National Renewable Energy Laboratory (U.S.)
PGCIL Power Grid Corporation of India
PV photovoltaics
USD U.S. Dollar
vi R e newa bles a nd El e c t r i c i t y StorageINTRODUCTION TO REMAP 2030
In June 2014, the International Renewable Energy achieved in a distributed manner in the residential and
Agency (IRENA) launched a global renewable energy commercial sectors, at both urban and rural sites.
roadmap called REmap 2030. The aim is to assess
pathways to double1 the share of renewable energy in This technology roadmap is developed to examine the
the global energy mix by 2030 (IRENA, 2014). REmap consequences and opportunities of the power sector
2030 is the result of a collaborative process between transformation in more detail. A range of measures
IRENA, national experts in and other stakeholders support the integration of higher shares of VRE in the
around the world. power, sector, including interconnectors, demand re-
sponse, smart grid technologies and new pricing mech-
The REmap 2030 approach runs along two parallel anisms. Energy storage is only one of many options to
tracks of analysis: increase system flexibility. IRENA’s forthcoming tech-
nology roadmap on renewable energy grid integration
ll A country-based analysis to identify actions for examines all options in more detail, including the role of
technology deployment, investment and policy electricity storage compared to other options.
development. The number of countries included
in the REmap analysis grew from 26 in 2014 to 40 However, countries considering a transition to power
in 2015, covering more than 80% of global energy systems based on renewables between now and 2030
demand. must look closely at electricity storage options. Storage
ll A series of technology roadmaps to garner should not be considered an end in itself. Rather, it is a
cross-border insights on actions needed to dou- means to support a reliable, efficient, cost-effective and
ble the share of renewables in the global energy clean power sector by facilitating the deployment and
mix. integration of renewables. Such considerations apply to
countries of three types:
The country-based analysis of REmap 2030 suggest
that national renewable energy plans would increase 1. Countries with VRE shares exceeding 30%, com-
the renewable share in annual global power generation bined with even higher ambitions;
from 22% in 2014 to 27% by 2030. However, the results 2. Countries with VRE shares exceeding 20%, with
also suggest that existing plans underestimate current constrained grid infrastructures.
market growth, especially for variable renewable energy 3. Island countries, or those including islands, and
(VRE) sources like solar photovoltaics (PV) and wind countries with remote off-grid power systems.
power. Consequently, the roadmap reveals the option
to deploy an additional 800 gigawatts (GW) of solar Until 2030, the number of countries in the first cate-
photovoltaics (PV) and 550 GW of wind power between gory will be limited. For instance, it includes Australia,
2010 and 2030. Denmark, Germany, UK, Spain and some states in the
US. The number of countries in the second category
If countries bring this to fruition, the share of renewables will also be limited. Examples include India, Italy and
in the power sector would increase to more than 40% Japan. Countries in the third category will make up
by 2030. For VRE sources – mainly solar PV and wind the largest group. They include many of the 52 small
power – the share would increase from 3% of power developing island states with ambitious plans to move
generation in 2014 to around 20% in 2030 (see figure 1). their power sectors towards renewables. For example,
Furthermore, almost half of PV deployment could be countries like Dominica, Fiji, Guyana, Maldives, Nauru,
Samoa, Solomon Islands, Timor-Leste, Tonga, Tuvalu
and Vanuatu are targeting renewable energy shares of
1 The aspirational target for REmap 2030 is derived from the Sus-
tainable Energy for All initiative, which is co-chaired by the United
at least 50% before 2030. This category also includes
Nations Secretary-General and the World Bank President. countries in sub-Saharan Africa and other regions where
A te ch n o l o g y ro a d ma p fo r RE ma p 2 0 3 0 1Figure 1: Annual share of annual variable renewable power generation in 2014 and in 2030 if all REmap options
are implemented
Denmark
Germany
United Kingdom
Australia
Spain
Morocco
United States
Mexico
VRE share in annual electricity
Italy production (2014)
France
additional VRE share in annual electricity
Saudi Arabia production (2014-2030)
Japan
UAE
WORLD
China
India
Turkey
Argentina
0% 10% 20% 30% 40% 50% 60% 70%
Source: IRENA, 2014.
off-grid renewable energy systems can provide elec- In this context, IRENA has developed the present com-
tricity access in rural areas. Furthermore, the cost of re- plementary global technology roadmap on electricity
newable power generation has decreased such that PV storage for renewable power. The roadmap focuses on
and wind power are cheaper than the diesel generators electricity storage systems, although it recognises that
traditionally used to supply remote communities and thermal energy storage2 will in many cases be a cheap-
islands. Global assessments suggest that 250 GW of the er solution for storage power from VRE (IRENA and
existing 400 GW of installed diesel generators could be IEA-ETSAP, 2013a).
replaced by renewable power generation technologies
(Blechinger et al., 2014). This warrants the storage to The aim of this roadmap is to identify in more detail pri-
accommodate night-time electricity supply or during ority areas for action, specify activities for international
periods lacking wind or sun. cooperation among different stakeholders and provide
a framework to monitor progress. The choices in this
For these three groups, the growth of VRE and its roadmap reflect input and feedback gathered from over
greater participation in future power systems will re- 150 stakeholders attending four international IRENA
quire a rethink by decision makers. Electricity storage electricity storage policy and regulation workshops in
technologies provide new opportunities and can play a Germany, India, and Japan.
significant role in restructuring the power system. The
importance of storage technologies is demonstrated in
2 Thermal energy storage stocks thermal energy by heating or
REmap 2030, which estimates that 150 GW of battery cooling a storage medium so that the stored energy can be used
storage and 325 GW of pumped-storage hydroelec- at a later time for heating and cooling applications. Examples of
thermal energy storage technologies are hot water tanks, through
tricity will be needed to double the share of renewable phase change materials like ice or paraffin, or through chemical
power generation by 2030. reaction like ammonia dissociation or methane steam reforming.
2 R e newa bles a nd El e c t r i c i t y StorageBox A: Assessing the global electricity storage market for renewables
International and national assessments of the global electricity storage market have been hindered by un-
certainty about which technologies and market segments to include. A central question for this roadmap is
whether storage is used to support the integration of renewables or for other purposes.
IRENA’s global renewable energy roadmap (REmap 2030) assessed the plans for pumped-storage hydroelec-
tricity in the 26 countries, which suggests that the total capacity will increase from 150 GW in 2014 to 325 GW
in 2030. The battery storage capacity for renewables integration is based on the country-by-country analysis
of electric vehicle sales of around 80 million vehicles by 2020, and the assumption that the discarded batteries
of these vehicles would become available after 2028.3 The total available battery storage capacity available
would be around 250 GW, conservatively assuming that 50% of these batteries would be used for second-life
applications, and that only 10% would be available to support the integration of renewables. Considering a
total installed VRE capacity of 2885 GW by 2030, REmap 2030 suggests that 5% (or 150 GW) of the VRE
capacity would be supported by second-life batteries.
Other studies have used modelling tools to assess national and global market potential. In 2009, the Inter-
national Energy Agency (IEA) estimated a global energy storage capacity of 180-305 GW (including large
hydropower). This assumes around 30% of annual power generation from VRE by 2050 (IEA, 2009). An
updated IEA study estimated around 460 GW of energy storage with 27% VRE in annual power generation
by 2050 (IEA, 2014). In comparison, a recent market study by CitiGroup suggests an energy storage market
(excluding pumped-storage hydroelectricity and car batteries) of 240 GW by 2020 (CitiGroup, 2015). Navi-
gant Research estimates that around 20 gigawatt-hours (GWh) out of 50 GWh of advanced battery storage
systems in the utility sector will be supporting the integration of renewables. Other applications will provide
ancillary services, peak shaving and load shifting (Jaffe & Adamson, 2014).
An alternative approach would be to assess manufacturing capacity plans. By 2020, motor vehicle producer
Tesla’s gigafactory is scheduled to produce 35 GWh while energy service provider Alevo’s manufacturing
plant is expected to produce 16.2 GWh. Chinese battery and vehicle producer BYD has announced plans to
ramp up production capacity from 10 GWh in 2015 to 34 GWh in 2020.
National studies are also available. Research institute Fraunhofer ISE has made estimates of storage require-
ments to achieve 100% renewable energy in Germany. This amounts to 24 GWh of stationary battery appli-
cations, 60 GWh of pumped hydropower, 33 GW of electrolysers and 670 GWh of heat storage (Henning &
Palzer, 2013). Estimates for India are 15-20 GW by 2020 of which 2.2 GW is for solar and wind integration and
2.5 GW for rural electrification (Indian Energy Storage Alliance (IESA), 2014).
3 Assuming 100 kW/50 kWh batteries with 25% capacity loss and 80% depth of discharge available.
At the end of the roadmap a set of indicators are pro- for tracking the technology progress and deployment
vided to track progress and compare the different appli- of electricity storage systems (2) indicators for tracking
cations and features of electricity storage systems. The electricity storage system advantages for integrating
indicators were divided into two groups: (1) indicators renewable energy.3
3
A te ch n o l o g y ro a d ma p fo r RE ma p 2 0 3 0 3SUMMARY OF KEY FINDINGS
Electricity storage systems convert electricity into other level.4 They suggest that additional research and de-
forms of energy (e.g. potential, thermal, chemical or velopment in electricity storage systems is needed to
magnetic energy) and then reverse this process to re- increase cost-competitiveness relative to non-storage
lease electricity. In the power sector, the most common options available in the power sector. The exception to
form of existing electricity storage (99% of installed this is thermal storage and pumped-storage hydroelec-
capacity) is pumped-storage hydroelectricity. This use tricity. Furthermore, these roadmaps suggest that policy
electricity to pump water to an elevated reservoir in action is needed to support the deployment of energy
periods of excess power in the grid. In periods of high storage options. Figure 2 provides an overview of the
electricity demand, the water is subsequently released latest cost assessments for different electricity storage
to run conventional hydropower turbines to revert to technologies.
electricity production.
Experience so far demonstrates that technological
Pumped-storage hydroelectricity can start up within a progress is not sufficient to boost storage deployment.
couple of minutes and can thus be used to provide bal- Electricity storage systems are already available today,
ancing and reserve to systems with variable renewables. but their deployment levels are very limited compared
Their main drawback is their relatively low roundtrip to the rapid growth in variable renewable power genera-
efficiency of around 70-80%, as well as geographical tion. This means that technological development should
restrictions. These are dictated by the need for relatively actively complement an adequate regulatory environ-
large water reservoirs and large elevation variations be- ment, industrial acceptance and progress on different
tween lower and upper reservoirs to provide sufficient issues still needing regulatory support and research and
capacity. development funding. Some examples are pilot projects
or new procurement mechanisms and business models
In the transport sector and in remote regions with un- that help quantify the value of storage applications.
reliable or no centralised electricity grid, lead-acid bat- They enable electricity storage to compete on a level
teries are the dominant technology to store electricity playing field with traditional alternatives.
or provide backup capacity. Lead-acid batteries have
been relatively cheap but their limited efficiency and The electricity storage roadmap produced by IRENA
lifetime made them less suitable for renewable energy indicates that electricity storage systems should be a
integration. The relatively recent developments in con- broadly deployable asset for enhancing the integration
sumer electronic and electric vehicle battery storage
has boosted the development of advanced battery stor- 4 Roadmaps have been produced at a global level by IEA, for Eu-
age systems to support renewable energy integration in rope by the European Association for Storage of Energy (EASE),
European Energy research Alliance (EERA) and Grid+, for Japan,
the power sector (IRENA, 2015a). In addition, flywheel France, Australia, UK, USA and India by New Energy and Industrial
technologies, compressed air energy storage (CAES), Development Organization (NEDO), Agence de l’Environnement
et de la Maitrise de l’Energie (ADEME), Clean Energy Council
supercapacitors and superconducting magnetic elec-
(CEC), Centre for Low Carbon Futures (CLCF), National Alliance
tricity storage systems are used to support the integra- for Advanced Transportation Batteries (NAATBatt) and the United
tion of renewables into the power sector. States Agency for International Development (USAID) respective-
ly. Roadmaps for electricity storage in the transport sector have
been devised by New York Battery and Energy Storage Technolo-
In the last couple of years, several roadmaps have been gy Consortium (NY-BEST) for New York, State and by Fraunhofer
ISI, United states Driving Research and Innovation for Vehicle
published examining the opportunities for energy stor-
efficiency and Energy sustainability (U.S. DRIVE) and the European
age at the global, regional, national, state and sectoral Association for Advanced Rechargeable Batteries (RECHARGE).
4Box B: Cost and value of electricity storage
Except for pumped-storage hydroelectricity and conventional CAES, the cost of electricity storage systems
has been one of the factors inhibiting their large-scale deployment. For advanced battery storage systems,
the costs are expected to decline rapidly due to growing demand and manufacturing capacity expansion.
This is driven by demand for batteries for electric vehicles and intense international competition between
multinational electronics companies like Panasonic, Samsung SDS and LG Chemicals.
Two important elements need to be considered when assessing the economics of electricity storage: cost
and value. Electricity storage costs can be expressed in power (watts), capacity (watt-hours) and useable
kilowatt-hour (kWh) per cycle. The latter is a cost indicator for storing and releasing 1 kWh of electricity on top
of generation costs. Table 1 compares three battery storage systems commercially available for deployment
in the German residential sector in 2012.
Table 1: Battery storage performance and costs for residential systems in the German market in 2012
Battery technology lead-acid li-ion li-ion
Battery power (kW) 5 5 5
Battery capacity (kWh) 14.4 5.5 8
Depth of discharge 50% 80% 100%
Useable capacity (kWh) 7.2 4.4 8
Number of cycles 2 800 3 000 6 000
Price (EUR) 8 900 7 500 18 900
EUR/kW 1 780 1 500 3 780
EUR/kWh 618 1 364 2 363
EUR/useable kWh 1 236 1 705 2 363
EUR/useable kWh/cycle 0.44 0.57 0.39
EUR = euros; kWh = kilowatt-hours
As shown in Table 1, costs are a function not only of the system price but also of attributes like depth of
discharge, roundtrip efficiency and number of cycles. The results show that storing electricity in 2012 for
self-consumption from a rooftop solar PV system would add EUR 0.4-0.6/kWh to generation costs. However,
the costs of residential battery storage systems have fallen substantially while performance continues to
improve. In late 2014, German residential storage systems (including inverters and installation) with around
6 000 cycles could be bought for around EUR 2 000-2 200 per kilowatt (kW) or EUR 1 000-1 300/kWh
(Petersen, 2014). This results in costs per cycle of EUR 0.16-0.30/kWh. Advanced lead-acid residential storage
systems were around EUR 1 400/kWh. The Tesla Powerwall, launched in April 2015, has a retail price of EUR
385/kWh (battery only) or EUR 0.16 kWh/cycle5 for the system.
The costs of utility-scale storage systems also continue to decline. In the US, they are around 2 500 US Dol-
lars (USD)/kW or USD 1 700/kWh at present (of which a third is balance-of-system costs). Hawaii is already
achieving USD 1 500/kW or USD 1 000/kWh (UBS Research, 2014).6 Based on discussions between utilities
and vendors, the storage costs will have reduced to USD 525/kW or USD 350/kWh by 2020 (The Brattle
Group, 2014). Assuming around 6 000 cycles for these types of systems, the costs of storing 1 kWh are around
USD 0.06/kWh. In comparison, the current costs for battery packs for electric vehicles are between USD 300-
410/kWh, and are expected to reduce to around USD 200/kWh in 2020 (Nykvist & Nilsson, 2015).
5 Assuming 5 000 cycles and EUR 2 250 for inverter and installation. Based on exchange rate for 30 April 2015 (the release date of the
TESLA Powerwall) at EUR 0.9 per US Dollar (USD.).
6 USB Research assumes 1.5 hours of storage.
5Figure 2: Cost assessments for electricity storage systems
Capital costs/cycle
1
$/kWh/cycle
0.1
0.01
2008 2013 2018
Pumped-storage hydro Compressed Air Energy Storage Lead-acid batteries
Sodium sulphur batteries Lithium-ion batteries Vanadium redox batteries
Source: The Brattle Group, 2014; Walawalkar, 2014.
Projects for other electricity storage technologies are provided in figure 2. Adding these costs to generation
costs means that variable renewable electricity storage into the grid still approximately doubles the electricity
consumption costs.
In the longer term, the Tesla threshold of USD 100/kWh (based on material costs) is viewed as a lower limit
for the price of lithium-ion (li-ion) batteries. However, alternative battery storage technologies like nickel-cad-
mium, metal-air or flow batteries are already challenging this threshold.
Assessing the value of storage is the second element. It has traditionally been worked out in a particular
way, especially for pumped-storage hydroelectricity. Storage costs are calculated as the difference between
electricity prices during storage and during production (see figure 3).7 The same principle also can be applied
to residential storage. Solar PV production costs combined with storage costs can be cheaper than the
difference between the price received for feeding power back into the grid and residential prices for buying
electricity from the grid. In these circumstances, there is an economic case for storage, and its costs should
be measured in USD/kWh/cycle.
The traditional evaluation of electricity storage means that storage will significantly add to the costs of inte-
grating renewable power generation into the grid, despite cost reductions projected for 2020. Furthermore,
the significance of electricity storage costs will probably continue to grow as renewable power generation
costs are expected to continue to decline.
However, storage can also be used to assist the grid in other ways and provide multiple value streams even
from the same asset. For example, primary reserve is measured in power (watts), while secondary and tertiary
reserves are valued in capacity (watt-hours). This means that different cost and value indicators are needed
to measure storage value in these markets. For example, the German utility WEMAG operates a five mega-
7 Figure 3 assumes that electricity prices correspond with electricity demand. Thus higher demand in the morning and afternoon peaks
corresponds with higher electricity prices.
6Figure 3: Assessing value of storage per kilowatt-hour
∆ electricity price ($/kWh)
storage costs ($/kWh)
Electricity price ($/kWh)
vs.
6am 12noon 6pm 12midnight 6am
watt (MW)/five megawatt-hour (MWh) battery storage park in Schwerin that bids into the primary reserve
markets and makes an average EUR 2 700/MW per week. Similarly, the value of a pumped-storage hydroelec-
tricity should not only be measured by its ability to provide instantaneous capacity in case of an unexpected
thermal power plant outage. It also needs to be measured according to its ability to sustain generation over
a longer period. For example, Taloro PSH provided 210 MW of power generation capacity within 13 minutes
following an unexpected thermal power plant outage in Sardinia in Italy. It sustained production over six hours
(1 114 MWh) while the thermal power plants were being fixed (Grigatti, 2015).
With the exception of reserve markets, the problem is that many of these system-wide values of storage
investments cannot usually be captured by outside investors. These values can be as much as 30-40% of
the total system-wide value of storage (The Brattle Group, 2014), although the specific value depends on the
cost of alternative solutions available. They include increased reliability, transmission and distribution network
support, reduced power outages and increased efficiency. Furthermore, electricity storage systems challenge
conventional regulation due to their multiple functionality. This is because a single unit can operate at the
same time in several markets throughout the day. For example, the battery storage park in Schwerin would
only require a software update to start bidding into the secondary markets. In many cases, regulations and
policies particular to specific regions prevent electricity storage systems from providing multiple benefits.
of high shares of VRE generation. Its functions include The benefits of electricity storage systems cross the
supporting the local integration of power generation boundaries between the power system value chain
from VRE in distribution networks, supporting the grid (generation, transmission, distribution and end-use) in
infrastructure to balance VRE power generation, and both grid and off-grid systems. This means electricity
supporting self-generation and self-consumption of storage systems cannot be addressed with a single poli-
VRE by customers (figure 4). More importantly, policy cy covering the different possible locations and services.
makers interested in energy storage system deployment Instead, dedicated policies are needed for each of these
in any of these three application areas need to consider application areas. At the same time, policies need to en-
the impact of energy storage on the power system as a sure consistency and consider the broad scope of regu-
whole. This is particularly the case for storage systems latory options for electricity storage systems (including
supporting the deployment of variable renewable pow- grid codes, pricing mechanisms and the creation of
er generation in islands and off-grid systems. These new markets). They need to consider integrating power
insights have led to the formation of the five priority into end-user sectors through storage applications (e.g.
areas discussed in the following sections. power-to-gas or electric vehicles).
7Figure 4: Potential locations and applications of electricity storage in the power system
Bulk Storage
Balancing
Storage
Thermal
Storage
Distributed
Storage
Commercial
Storage
Residential V2G
Storage
Approach Representative stakeholders were invited to comment
on the separate priority areas and identify action items.
The roadmap is based on a combination of literature Each workshop concluded with proceedings shared
reviews, studies and stakeholder workshops. The studies online and with the participants. These form the basis
are published as separate IRENA reports and include: for this technology roadmap.
ll Battery Storage for Renewables: Market Status
and Technology Outlook (IRENA, 2015a) Priority areas for action
ll Electricity Storage Technology Brief (IRENA &
IEA-ETSAP, 2013b) Based on the approach outlined in the previous section,
this technology roadmap has identified 14 action items
The workshops took place between March 2014 and subdivided over five priority areas (figure 5).
March 2015 and were conducted in Germany, India and
Japan. In total, 150 stakeholders participated in one or 1. System analysis helps to assess the role of stor-
more of these stakeholder workshops. In the first work- age in different power sector segments, in com-
shop, participants were asked to identify key application parison with other options to support renew-
areas in which electricity storage can support renewable able energy deployment. Analysis of this type
energy deployment. The insights of this workshop led to is required for all countries considering energy
the identification of different priority areas. In the next storage policies. It complements activities in any
two, participants identified the key technology require- of the other priority areas.
ments and policy barriers, and identified opportunities 2. Storage in islands and remote areas is relevant
for international cooperation within them. In the final for a large number of countries (identified as
workshop, the blueprint for this roadmap was shared. Category 3 countries). This is the most imme-
8 R e newa bles a nd El e c t r i c i t y StorageFigure 5: Priority areas and action items for the IRENA technology roadmap on electricity storage
SYSTEM ANALYSIS FOR STORAGE IN ISLANDS AND REMOTE AREAS
• Facilitate financing
STORAGE • Create local value chains
• Engage and guide policy
• Develop a global database with practical example
makers
• Guide policy makers to the required tools
• Provide systemic
economic assessment
models
• Support system analysis of
CONSUMER-LOCATED STORAGE
• Comparative information sheets and labelling
electricity/heat/fuel/
• Accelerate standards on safety and recycling
productive uses as storage
• (Data) ownership and liability regulation
options
GENERATOR-LOCATED STORAGE
• Support the development of innovative regulation
• Support for localised/distributed systems
GRID-LOCATED STORAGE (TRANSM. & DISTR.)
• Pumped-storage hydroelectricity and compressed air energy
storage (CAES) analysis
• Demonstration projects for new business models
diate priority area where electricity storage can with limited power system flexibility (Category 2
support renewable power deployment. countries). Pumped-storage hydroelectricity is
3. Consumer-located storage is important for the key technology in this area, with advanced
countries where household electricity prices are compressed air energy storage currently in the
high compared to rooftop solar PV power pro- demonstration phase. Smaller, more distributed
duction costs, or where consumer electricity storage technologies are also of interest for pro-
feed-in is discouraged or limited. This priority viding local grid support where there is a high
area is particularly relevant to countries that al- penetration of local variable renewables.
ready have or are expecting a high share of roof-
top solar PV systems in the power sector (mostly The power sector has been dominated for over a cen-
Category 1 countries). tury by a single framework matching centralised electri
4. Generator-located storage is important for city production with the fluctuating needs of local con-
countries in Categories 1 and 3. These include sumers in real time. Given that background, electricity
island countries, as well as those with islands storage can truly create a revolution. The rapid growth
or remote off-grid power systems, those with of renewable power generation is an important driver
inadequate grid infrastructure to link renewable accelerating this development. Three other drivers are
energy resources to demand centres, and those stimulating change. Firstly, large electronics compa-
facing other interconnection constraints. nies looking for new markets for their battery storage
5. Storage in transmission and distribution grids systems have initiated a technology push, Secondly, in-
is important for countries making the transi- dustry and consumer interest in electric vehicle battery
tion to power systems based on renewables but development is growing. Thirdly, demand is rising for
A te ch n o l o g y ro a d ma p fo r RE ma p 2 0 3 0 9reliable and affordable power for the 1.6 billion people items, policy makers are in the driving seat. For others,
who lack electricity access. Policy makers should con- industry, academia or stakeholders like insurance com-
sider the impacts of these trends now and prepare a panies or consumer associations need to take the lead.
timely response to ensure that policy frameworks are Responsibilities among stakeholders may be differenti-
ready and business models can be deployed once these ated at a local level. However, international cooperation
drivers converge. across these 14 action items will be critical to ensure
the world is ready for the next generation of renewable
In the following sections, this technology roadmap power systems. In this context, the indicators are an im-
describes each of these five priority areas and 14 ac- portant tool for tracking progress and adjusting action
tion items in more detail. For some of these action items and priority areas accordingly.
10 R e newa bles a nd El e c t r i c i t y StoragePRIORITY AREA 1:
SYSTEM ANALYSIS FOR STORAGE
An electricity storage systems can support renewables means there is still no clear direction for a legal defi-
at different locations in the power sector and through nition of energy storage. This is obstructing the devel-
different services. The location at which a storage sys- opment of appropriate policies and legal frameworks
tem is placed and the service provided by electricity (Crossley, 2014).
storage are independent variables. This means a resi-
dential battery storage system coupled to rooftop solar Electricity storage can do much more than support
PV can at any point in time also function as a generator the integration of or transition towards renewables.
providing ancillary services to support the grid. Similar- Figure 6 provides an overview of 14 different services
ly, electricity storage coupled to a wind park can act as it can provide to the grid. The services highlighted in
an electricity consumer through a simple switch. Thus red are those of direct relevance to renewable energy
policy makers creating a framework to support a spe- integration. However, electricity storage systems sup-
cific storage function will always need to consider the porting renewable energy integration can also provide
fact that storage could at any point be used for other any of the other grid services needed for efficient and
functions too. cost-effective power system management.
Electricity storage can add considerable value to the Countries considering electricity storage options to
management of the power system if the regulato- support the transition towards renewables need to
ry framework allows. However, its multi-functionality take a systems perspective. This includes a trade-off
Figure 6: Electricity storage services and their relevance for renewable power integration
Customer
Transmission Distribution
Bulk energy Ancillary energy
infrastructure infrastructure
services services services management
services services
Electric energy Regulation Transmission Distribution Power quality
time-shift upgrade deferral Upgrade Deferral
(arbitrage)
Electric supply Spinning, non- Transmission Voltage Support Power reliability
capacity spinning, and congestion relief
supplemental
reserves
Retail electric
energy time-shift
Voltage support
Demand charge
management
Black start
Boxes in red: Energy storage services directly supporting the integration of variable renewable energy
Source: based on Department of Energy (DOE) / Electric Power Research Institute (EPRI) 2013 Electricity Storage Handbook in Collaboration
with National Rural Electric Cooperative Assocation (NRECA), 2013.
A te ch n o l o g y ro a d ma p fo r RE ma p 2 0 3 0 11between the different options available to support for the benefits they provide. Thirdly, one can focus
renewable energy integration. Interconnectors, procurement on the required capabilities rather than
transmission and distribution infrastructure expansion, a specific technology. The exact means of achieving
and more flexible generation options are a few a technology- neutral approach can vary greatly de-
examples. Others include capacity and/or flexible pending on the region. However, the overall philosophy
market as well as ancillary service market creation, of technology neutrality will allow the most innovative,
nodal pricing to direct the siting of renewable energy cost-effective and beneficial technologies to rise to the
projects, demand-side management, and smart grid surface.
technologies. Other options are available, such as a
shift to more decentralised approaches attracting new
stakeholders paid for the delivery of certain services Action 1.1: Engage and guide
or shifting grid infrastructure management to local stakeholders
stakeholders. In addition, policy makers need to balance
the need for electricity storage with other storage Electricity storage development requires the active en-
options. These include thermal energy storage, the gagement and commitment of stakeholders to establish
conversion of electricity into hydrogen or gas, or end- an adequate environment to value and benefit from
use sector electrification. The key challenge is not only electricity storage applications. Regulators and policy
to choose among these options but also to find ways to makers, system operators, utilities, consumer advocates,
combine them in an optimal yet flexible manner. environmental organisations, industry, financial institu-
tions and power system experts are some of the main
There are advantages to avoiding picking winners stakeholders to draw in. Policy makers should guide
among the flexibility options by focusing on the creation power sector evolution, including overall grid infrastruc-
of a fair, open and technology-neutral environment. This ture development, the role of storage and its interaction
can be done in three ways. Firstly, one can eliminate with renewables.
or reduce barriers to the interconnection of beneficial
resources. Secondly, it is possible to create technolo- An eight-step process is proposed to engage stake-
gy-neutral mechanisms or markets allowing resources holders (figure 7). All steps should be based on inputs
to provide benefits and be compensated appropriately specific to each region, and each step should be com-
Figure 7: Procedure for engaging and guiding stakeholders in developing energy storage
policies for renewables
Step 0: Create broad Step 1: Connect with
awareness of the function and stakeholders and start building
potential role of storage for up the storage development
renewables plan with them
Step 4: Independently assess Step 2: Determine regionally
the system value of storage Step 3: Identify alternatives to
appropriate applications
applications versus each of the services that
considering both supply and
alternatives storage can provide
demand
Step 5: Reconvene, assess re- Step 6: Determine the barriers Step 7: Work with
sults and prioritise appli- to applying storage in high stakeholders to plan
cations with greatest benefits priority applications implementation
Based on Strategen Consulting, 2015.
12 R e newa bles a nd El e c t r i c i t y Storageplemented with best practices and tools etc. to inform ll Jointly brainstorm potential barriers to energy
the decision process and show what can be achieved. storage benefits, and bring in relevant experience
Stakeholder engagement is iterative and geared toward from other countries as necessary to address any
enabling education and consensus for the final regu- concerns.
latory framework, goals, priorities and implementation
approaches. Steps 2, 3 and 4 consist of a number of analytical acti
vities (see Action 1.2: Provide systemic value assessment
Step 0 and Step 1 make up the preparatory phase of storage). These mean bringing in independent ana-
of n ational renewable electricity storage policy lysts recognised by all stakeholders involved. During this
development. Step 0 means organising webinars and stage, the fundamental motivation for using storage is
workshops to engage a broad constituency, create identified and the applicability of storage at different
awareness and engagement and understand the region- locations of the power system determined. Stakeholders
al factors that might lead towards the best solutions. have to come to an agreement on the analysis inputs.
During this process, external experts from different Besides technology and knowledge transfer, this stage
fields (governments, industry, academia, etc.) should be also enables stakeholders to acknowledge the bene-
invited to share best practices or research and develop- fits and challenges of implementing electricity storage
ment projects. Once this broad engagement has been systems. It is important to consider alternatives (either
completed, the first step consists of identifying specific through technology or regulation and/or market de-
stakeholders to run the process. Experiences from Cali sign) as an intrinsic part of any analysis.
fornia (see box C) provide a few lessons for effectively
connecting with stakeholders, outlined below. Steps 5, 6 and 7 should result in a practical imple
mentation plan recognised by all stakeholders. During
ll Identify ‘champions’ committed to the deve this process, it is important that applications providing
lopment of renewables and electricity storage the greatest benefits to the system are prioritised and
and ensure they are personally engaged through- that any barriers are systematically removed. These may
out the whole process. involve cooperation across multiple jurisdictions. This is
ll Understand the goals and challenges these in- why the identification of a key core of stakeholders in
dividuals face in their respective country/juris- the first stage is so important. A conclusion may emerge
diction and the relative perspectives of related at this stage that electricity storage is not suitable, not
stakeholders both inside and outside their or- cost-effective or not necessary for renewable energy
ganisation. deployment.
ll Include both proponents and opponents and
discuss energy storage system strengths and At the residential level, electricity storage systems
challenges compared to traditional solutions. require the engagement of new stakeholders such as
This includes any existing regulatory/legal, ed- insurance companies, the construction industry, in-
ucational/cultural and financial obstacles and stallers and the general public. Some activities should
specific drivers in each country like fuel prices, therefore be guided to help inform, educate and engage
greenhouse gas emission targets, transmission these new stakeholders. Site visits and more specialised
constraints etc. international workshops are examples.
Box C: Energy storage policy and market development in California
California represents a practical example of the successful involvement of policy makers in developing a
regulatory framework to support the progress of renewable energy and storage.
It has a renewable portfolio standard in place to procure 33% of electricity from renewable energy resources
by 2020. The state is considering a further increase in the renewables procurement target. In 2014, the large
investor-owned utilities provided 21% of their retail electricity load from renewable energy resources. On the
customer side, nearly 2.4 GW of rooftop solar PV and 23 MW of wind power have been installed.
13In 2010, California’s legislature signed Assembly Bill No. 2514 into law. This required that the California Public
Utilities Commission (CPUC) consider energy storage procurement targets for load-serving entities if energy
storage was found to be commercially viable and cost-effective. The goal was to utilise energy storage to op-
timise the grid, integrate renewables and reduce greenhouse gas emissions. In 2013, the state launched a new
stakeholder process to engage utilities, industry, ratepayer advocates and other interested parties. Their task
was to evaluate applications for energy storage in California’s grid, as well as its cost-effectiveness compared
to other alternatives. Following this stakeholder process and the resulting analytical findings, the California
Public Utilities Commission established storage procurement targets for the largest three investor-owned
utilities. This prompted a mandate to procure 1 325 MW of storage capacity by 2020. Besides the three utilities,
other load-serving entities were also obliged to purchase a targeted energy storage capacity equivalent to 1%
of peak load by 2020. The procurement mandate established eligibility and other requirements. For example,
pumped-storage hydroelectricity exceeding 50 MW is not eligible. Storage facilities have to be operational
by 2024.
The energy storage procurement targets for the three largest utilities in 2014 were 90 MW for Southern Cali-
fornia Edison, 90 MW for Pacific Gas and Electric and 25 MW for San Diego Gas & Electric. These targets were
subdivided by grid connection (transmission and distribution) and customer. In November 2014, Southern
California Edison announced that it had procured 261 MW of energy storage for 2014 to satisfy local capacity
requirements resulting from power plant retirements. This is much more than the required target of 90 MW
(see table 2). Similarly, San Diego Gas & Electric is allowing for a maximum procurement of 800 MW. Pacific
Gas and Electric solicited 50 MW of storage connected to the transmission grid, 24 MW to distribution circuits
and 10 MW of storage connected to customer sites.
Table 2: Southern California Edison procurement of energy storage in 2014
Seller Resource type MW
Ice Energy Holdings Behind-the-meter thermal energy storage 25.6
Advanced Microgrid Solutions Behind-the-meter battery energy storage 50
Stem Behind-the-meter battery energy storage 85
AES In-front-of-meter battery energy storage 100
Following these mandates, the California Public Utilities Commission has produced an energy storage road-
map. This was completed in collaboration with the state transmission system operator, the California indepen-
dent system operator (CAISO) and the California Energy Commission (CEC). The roadmap identifies concerns
that need to be resolved to facilitate energy storage deployment (CAISO, CPUC, & CEC, 2014).
The important lesson from California is that the policy makers did not devise their energy storage policy with
a mandate in mind. Instead, they started off with a much more exploratory policy to assess the potential
impacts of storage, and engaged stakeholders from the beginning. Over time, Californian policy makers and
other stakeholders increased their involvement and understanding of VRE technologies, storage and other
applications. All this turned into a strong legal and regulatory framework enabling utilities to rate base energy
storage assets and services. This provided the necessary financial risk-mitigating framework to encourage
utility procurement.
Action 1.2: Provide systemic value adding storage and an understanding of what value it
might deliver to the whole system. However, it is possi-
assessment for storage
ble to implement storage at different levels of the value
Any policy aiming to use energy storage for renewables chain while these technologies interact in a complex
integration will require an assessment of the benefit of way with different parts of the system. This makes it
14 R e newa bles a nd El e c t r i c i t y StorageYou can also read