TRENDS 2014 IN PHOTOVOLTAIC APPLICATIONS - Survey Report of Selected IEA Countries between - IEA-PVPS
←
→
Page content transcription
If your browser does not render page correctly, please read the page content below
TRENDS 2014
IN PHOTOVOLTAIC APPLICATIONS

Survey Report of Selected IEA Countries between
1992 and 2013

Report IEA-PVPS T1-25:2014
COVER IMAGE
                                                                                                                   SunPower PowerGuard rooftop
                                                                                                                           solar electric system.
                                                                                                                            © Sun Power, NREL

 REPORT SCOPE AND OBJECTIVE
 Annual surveys of photovoltaic (PV) power applications and markets are carried out in the reporting countries, as part of the IEA PVPS
 Programme’s work. The Trends reports objective is to present and interpret developments in the PV power systems market and the
 evolving applications for these products within this market. These trends are analyzed in the context of the business, policy and non-
 technical environment in the reporting countries.
 This report is prepared to assist those who are responsible for developing the strategies of businesses and public authorities, and to
 support the development of medium term plans for electricity utilities and other providers of energy services. It also provides guidance
 to government officials responsible for setting energy policy and preparing national energy plans.
 The scope of the report is limited to PV applications with a rated power of 40 W or more. National data supplied are as accurate as
 possible at the time of publication. Accuracy of data on production levels and system prices varies depending on the willingness of
 the relevant national PV industry to provide data. This report presents the results of the 19th international survey. It provides an
 overview of PV power systems applications, markets and production in the reporting countries and elsewhere at the end of 2013 and
 analyzes trends in the implementation of PV power systems between 1992 and 2013.

 DISCLAIMER
 Numbers provided in this report, “Trends 2014 in Photovoltaic Applications”, are valid at the time of publication. Please note that all
 figures have been rounded.

ISBN 978-3-906042-25-1

IEA PVPS TRENDS 2014 IN PHOTOVOLTAIC APPLICATIONS
FOREWORD // IEA PVPS TRENDS 2014 IN PHOTOVOLTAIC APPLICATIONS                                                                                3
                                                                                                                                  VPS
                                                                                                                             IEA-P

FOREWORD

What you have in your hands is the 19th edition of the                expected. With PV life cycle costs of electricity reaching socket
international survey report on Trends in Photovoltaic (PV)            parity with electricity grids in some countries, Self-consumption
Applications up to 2013.                                              and new business models gain importance while Feed-in Tariffs
                                                                      continue to evolve. Overall, this is an encouraging sign for the
The “Trends Report” is one of the flagship publications of the IEA
                                                                      growing competitiveness of PV and the increasing occurrence of
PVPS Programme, documenting the evolution of PV applications
                                                                      self-sustained markets. Clearly, policy support is changing over
within its member countries as well as worldwide. Providing
                                                                      time but is still considered essential for the near term
detailed insight and analysis of the PV market development, the
                                                                      development of PV markets worldwide. Quantitatively, the
series of trends reports published since 20 years are a unique
                                                                      number of countries experiencing PV as an essential part of their
repository of the evolution of the global PV market and its
                                                                      electricity supply is increasing, with Italy in first place with close to
framework. During this period of time, PV has evolved from a
                                                                      8% of annual electricity demand coming from PV, followed by
pure niche market of small scale applications towards becoming a
                                                                      Germany (> 6%) and Greece (close to 6%). In terms of peak
mainstream electricity source. Following the difficult year of 2012
                                                                      capacity, these high shares of PV start to affect and pose
in terms of market growth, industry consolidation, policy
                                                                      challenges to the integration in the electricity system. New
uncertainty and ongoing fast cost reduction, 2013 has seen a
                                                                      business models and market designs will emerge in response to
slower evolution on the cost side but also a growing worldwide
                                                                      this development. All of these developments are clear signs that
market again, although with a different split of dominant markets
                                                                      PV is becoming more mature and a relevant part of the electricity
compared to the past. The fast rise of PV markets in Asia and
                                                                      supply system. Becoming mainstream is not always easy but
America has been confirmed as has the decline of the total market
                                                                      certainly exciting and I do hope that you will find our most recent
in Europe. Overall, 35 GW of PV were installed in IEA PVPS
                                                                      insights interesting!
member countries during 2013 (2012: 25 GW), whereas the global
PV market is estimated to be at least 39 GW, translating to more
than an average of 100 MW installed on a daily basis throughout
the year. The global installed total PV capacity is estimated at
least 137 GW at the end of 2013. PV system prices have seen a
slower decline than in the years before or even small increases,
indicating that the speed of future cost reduction may be reduced.
On the supply side, the indicators suggest that the consolidation
phase in the industry starts to be overcome although competition
remains high. At the same time, at the present comparatively low
prices, some price flexibility for different applications can be

                                                                      Stefan Nowak
                                                                      Chairman
                                                                      IEA PVPS Programme

                                                                      PV HAS EVOLVED FROM A PURE NICHE MARKET OF
                                                                      SMALL SCALE APPLICATIONS TOWARDS BECOMING A
                                                                      MAINSTREAM ELECTRICITY SOURCE.

                                                                                          IEA PVPS TRENDS 2014 IN PHOTOVOLTAIC APPLICATIONS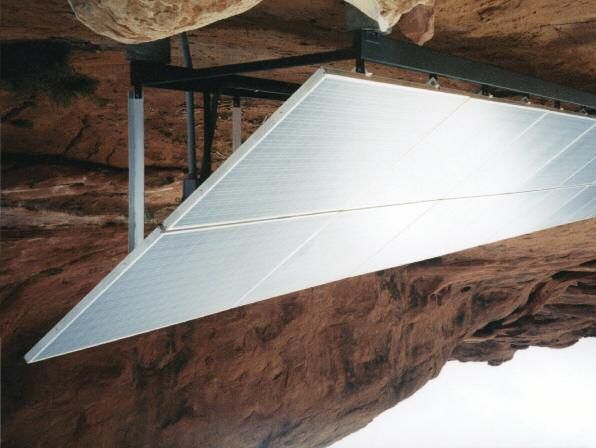
TABLE OF CONTENTS // IEA PVPS TRENDS 2014 IN PHOTOVOLTAIC APPLICATIONS        4

TABLE OF CONTENTS

FOREWORD                                                                  3

1. PV TECHNOLOGY AND APPLICATIONS                                         5
       PV TECHNOLOGY                                                      5
       PV APPLICATIONS AND MARKET SEGMENTS                                7

2. MARKET DEVELOPMENT TRENDS                                              8
       METHODOLOGY                                                        8
       THE GLOBAL INSTALLED CAPACITY                                      9
       THE MARKET EVOLUTION                                               9
       PV DEVELOPMENT PER REGION AND SEGMENT                             13
       THE AMERICAS                                                      15
       ASIA – PACIFIC                                                    17
       EUROPE                                                            23
       MIDDLE EAST AND AFRICA                                            31

3. POLICY FRAMEWORK                                                      35
       MARKET DRIVERS IN 2013                                            35
       THE COST OF SUPPORT SCHEMES                                       40
       TRENDS IN PV INCENTIVES                                           40

4. TRENDS IN THE PV INDUSTRY                                             42
       FEEDSTOCK, INGOTS AND WAFERS (UPSTREAM PRODUCTS)                  43
       PV CELL & MODULE PRODUCTION                                       44
       TRADE FRICTIONS                                                   48
       BALANCE OF SYSTEM COMPONENT MANUFACTURERS AND SUPPLIERS           48
       CONCLUSIONS ON INDUSTRY                                           49
       R&D ACTIVITIES AND FUNDING                                        50

5. PV AND THE ECONOMY                                                    53
       VALUE FOR THE ECONOMY                                             53
       TRENDS IN EMPLOYMENT                                              54

6. COMPETITIVENESS OF PV ELECTRICITY IN 2013                             55
       SYSTEM PRICES                                                     55
       GRID PARITY – SOCKET PARITY                                       58
       COMMENTS ON GRID PARITY AND COMPETITIVENESS                       59

7. PV IN THE POWER SECTOR                                                60
       PV ELECTRICITY PRODUCTION                                         60
       UTILITIES INVOLVEMENT IN PV                                       64

  CONCLUSION                                                             65

  ANNEXES                                                                66

  LIST OF FIGURES AND TABLES                                             70

IEA PVPS TRENDS 2014 IN PHOTOVOLTAIC APPLICATIONS
Canyonlands Needles Outpost, PV powers Needles general store and campground. © NREL

    one
    PV TECHNOLOGY
    AND APPLICATIONS

PV TECHNOLOGY

Photovoltaic devices convert light directly into electricity and   CELLS, MODULES AND SYSTEMS
shouldn’t be confused with other solar technologies (such as
                                                                   Photovoltaic cells represent the smallest unit in a photovoltaic
concentrated solar power - CSP or solar thermal for heating
                                                                   power producing device, typically available in 12,5 cm, 15 cm and
and cooling). The key components of a photovoltaic power
                                                                   up to 20 cm square sizes. In general, cells can be classified as
system are various types of photovoltaic cells (often called
                                                                   either wafer-based crystalline (single crystal and multicrystalline
solar cells) interconnected and encapsulated to form a
                                                                   silicon), compound semi-conductor (Thin-film), or organic.
photovoltaic module (the commercial product), the mounting
                                                                   Currently, crystalline silicon technologies account for about 80% of
structure for the module or array, the inverter (essential for
                                                                   the overall cell production in the IEA PVPS countries. Single
grid-connected systems and required for most off-grid
                                                                   crystal silicon (sc-Si) PV cells are formed with the wafers
systems), the storage battery and charge controller (for off-
                                                                   manufactured using a single crystal growth method and have
grid systems but also increasingly for grid connected ones).
                                                                   commercial efficiencies between 16% and 24%. Multicrystalline

                                                                                     IEA PVPS TRENDS 2014 IN PHOTOVOLTAIC APPLICATIONS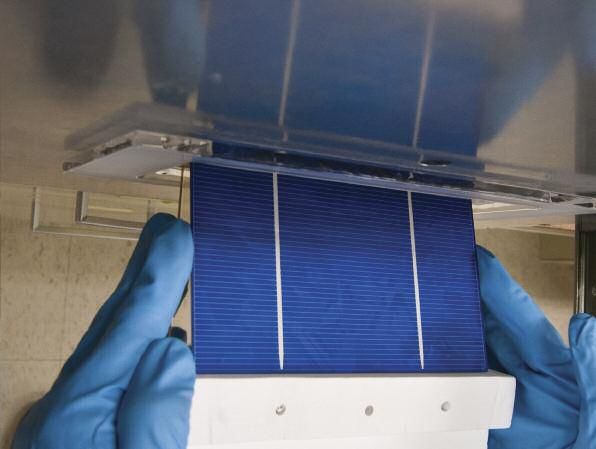
ONE // chAPtEr 1 PV TECHNOLOGY AND APPLICATIONS                                                                                           6

PV TECHNOLOGY /                 CONTINUED

silicon (mc-Si) cells, usually formed with multicrystalline wafers      A PV System consists in one of several PV modules, connected
manufactured from a cast solidification process, are becoming           to either an electricity network (grid-connected PV) or to a series
increasingly popular as they are less expensive to produce but are      of loads (off-grid). It comprises various electric devices aiming at
less efficient, with average conversion efficiency around 14-18%.       adapting the electricity output of the module(s) to the standards of
Quasi-monocrystalline silicon PV cells, manufactured using              the network or the load: inverters, charge controllers or batteries.
similar processes as multicrystalline silicon PV cells, have been
                                                                        A wide range of mounting structures has been developed
gaining recent attention. III-V compound semiconductor PV cells
                                                                        especially for building integrated PV systems (BIPV), including PV
are formed using materials such as GaAs on the Ge substrates
                                                                        facades, sloped and flat roof mountings, integrated (opaque or
and have high conversion efficiencies of 40% and more. Due to
                                                                        semi-transparent) glass-glass modules and ‘PV roof tiles’. Single or
their high cost, they are typically used in concentrator PV systems
                                                                        two-axis tracking systems have recently become more and more
with tracking systems or for space applications. Thin film cells are
                                                                        attractive for ground-mounted systems, particularly for PV
formed by depositing extremely thin layers of photovoltaic semi-
                                                                        utilization in countries with a high share of direct irradiation. By
conductor materials onto a backing material such as glass,
                                                                        using such systems, the energy yield can typically be increased by
stainless steel or plastic. Thin film modules have lower conversion
                                                                        25-35% for single axis trackers and 35-45% for double axis trackers
efficiencies but they are potentially less expensive to manufacture
                                                                        compared with fixed systems.
than crystalline cells. The disadvantage of low conversion
efficiencies is that larger areas of photovoltaic arrays are required
to produce the same amount of electricity. Thin film materials          GRID-CONNECTED PV SYSTEMS
commercially used are amorphous and micromorph silicon (a-Si),
                                                                        In grid-connected PV systems, an inverter is used to convert
cadmium telluride (CdTe), and copper-indium-gallium-diselenide
                                                                        electricity from direct current (DC) as produced by the PV array to
(CIGS). Organic thin film PV cells, using dye or organic
                                                                        alternating current (AC) that is then supplied to the electricity
semiconductors, have created interest and research,
                                                                        network. The typical weighted conversion efficiency – often stated
development and demonstration activities are underway.
                                                                        as “European”’ or “CEC” efficiency of inverters is in the range of
Further research and development is being carried out to improve        95% to 97%, with peak efficiencies reaching 98%. Most inverters
the efficiency of all the basic types of cells with laboratory          incorporate a Maximum Power Point Tracker (MPPT), which
efficiency levels of 25% for single crystal cells, and 20% for thin     continuously adjusts the load impedance to provide the maximum
film technologies being achieved.                                       power from the PV array. One inverter can be used for the whole
                                                                        array or separate inverters may be used for each “string” of
Photovoltaic modules are typically rated between 50 W and
                                                                        modules. PV modules with integrated inverters, usually referred to
315 W (72 cells) with specialized products for building integrated
                                                                        as “AC modules”, can be directly connected to the electricity
PV systems at even larger sizes. Wafer-based crystalline silicon
                                                                        network (where approved by network operators) and play an
modules have commercial efficiencies between 14 and 21%.
                                                                        increasing role in certain markets.
Crystalline silicon modules consist of individual PV cells connected
together and encapsulated between a transparent front, usually
glass, and a backing material, usually plastic or glass. Thin film      OFF-GRID PV SYSTEMS
modules encapsulate PV cells formed into a single substrate, in a
                                                                        For off-grid systems a storage battery is required to provide
flexible or fixed module, with transparent plastic or glass as the
                                                                        energy during low-light periods. Nearly all batteries used for PV
front material. Their efficiency ranges between 7% (a-Si) and 14%
                                                                        systems are of the deep discharge lead-acid type. Other types of
(CIGS and CdTe). Quality PV modules are typically guaranteed for
                                                                        batteries (e. g. NiCad, NiMH, LiO) are also suitable and have the
up to 25 years by manufacturers and are type approved to IEC
                                                                        advantage that they cannot be over-charged or deep-discharged,
61215 Ed. 2, IEC 61646 Ed. 2.0 and IEC 61730 International
                                                                        but are considerably more expensive. The lifetime of a battery
Standards. CPV modules offer now efficiencies up to 36%.
                                                                        varies depending on the operating regime and conditions but is
                                                                        typically between 5 and 10 years.

IEA PVPS TRENDS 2014 IN PHOTOVOLTAIC APPLICATIONS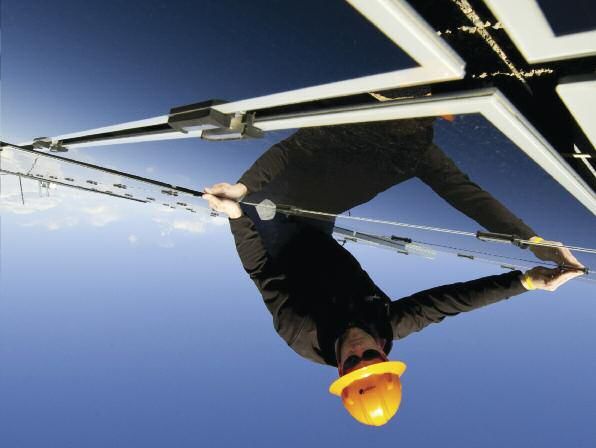
ONE // chAPtEr 1 PV TECHNOLOGY AND APPLICATIONS                                                                                             7
                                                                                                                                  VPS
                                                                                                                             IEA-P

A charge controller (or regulator) is used to maintain the battery       Off-grid non-domestic installations were the first commercial
at the highest possible state of charge (SOC) and provides the           application for terrestrial PV systems. They provide power for a
user with the required quantity of electricity while protecting the      wide range of applications, such as telecommunication, water
battery from deep discharge or overcharging. Some charge                 pumping, vaccine refrigeration and navigational aids. These are
controllers also have integrated MPP trackers to maximize the PV         applications where small amounts of electricity have a high value,
electricity generated. If there is the requirement for AC electricity,   thus making PV commercially cost competitive with other small
a ‘stand-alone inverter’ can supply conventional AC appliances.          generating sources.
                                                                         Hybrid systems combine the advantages of PV and diesel
                                                                         generator in mini grids. They allow mitigating fuel price increases,
                                                                         deliver operating cost reductions, and offer higher service quality
PV APPLICATIONS AND                                                      than traditional single-source generation systems. The combining
MARKET SEGMENTS                                                          of technologies provides new possibilities. The micro-hybrid
                                                                         system range for use as a reliable and cost-effective power source
                                                                         for telecom base stations continues to develop and expand. The
                                                                         development of small distributed hybrid generation systems for
There are six primary applications for PV power systems starting         rural electrification to address the needs of remote communities
from small pico systems of some watts to very-large-scale PV             will rely on the impetus given by institutions in charge of providing
plants of hundreds of MW.                                                public services to rural customers. Large-scale hybrids can be
                                                                         used for large cities powered today by diesel generators.
Pico PV systems have experienced significant development in the
last few years, combining the use of very efficient lights (mostly       Grid-connected distributed PV systems are installed to provide
LEDs) with sophisticated charge controllers and efficient batteries.     power to a grid-connected customer or directly to the electricity
With a small PV panel of only a few watts essential services can be      network (specifically where that part of the electricity distribution
provided, such as lighting, phone charging and powering a radio or       network is configured to supply power to a number of customers
a small computer. Expandable versions of solar pico PV systems           rather than to provide a bulk transport function). Such systems may
have entered the market and enable starting with a small kit and         be on or integrated into the customer’s premises often on the
adding extra loads later. They are mainly used for off-grid basic        demand side of the electricity meter, on residential, commercial or
electrification, mainly in developing countries.                         industrial buildings, or simply in the built environment on motorway
                                                                         sound-barriers, etc. Size is not a determining feature – while a
Off-grid domestic systems provide electricity to households and          1 MW PV system on a roof-top may be large by PV standards, this
villages that are not connected to the utility electricity network       is not the case for other forms of distributed generation.
(also referred to as the grid). They provide electricity for lighting,
refrigeration and other low power loads, have been installed             Grid-connected centralized systems perform the functions of
worldwide and are often the most appropriate technology to meet          centralized power stations. The power supplied by such a system
the energy demands of off-grid communities. Off-grid domestic            is not associated with a particular electricity customer, and the
systems in the reporting countries are typically up to 5 kW in size.     system is not located to specifically perform functions on the
                                                                         electricity network other than the supply of bulk power. These
Generally they offer an economic alternative to extending the            systems are typically ground-mounted and functioning
electricity distribution network at distances of more than 1 or 2 km     independently of any nearby development.
from existing power lines. Defining such systems is becoming
more difficult where, for example, mini-grids in rural areas are
developed by electricity utilities.

                                                                                            IEA PVPS TRENDS 2014 IN PHOTOVOLTAIC APPLICATIONS
© Dennis Schroeder / NREL

    two
    MARKET DEVELOPMENT TRENDS

                                                                   METHODOLOGY

More than twenty years of PV market development have seen          This report counts all installations, both grid-connected and
the deployment of at least 137 GW of PV systems all over the       reported off-grid installations. By convention, the numbers
world. However the diversity of PV markets calls for an in-depth   reported refer to the nominal power of PV systems installed.
look at the way PV has been developing in all major markets, in    These are expressed in W (or Wp). Some countries are reporting
order to better understand the drivers of this growth.             the power output of the PV inverter (the device converting DC
                                                                   power from the PV system into AC electricity compatible with
                                                                   standard electricity networks. The difference between the
                                                                   standard DC Power (in W) and the AC power can range from as
                                                                   little as 5% (conversion losses) to as much as 30% (for instance
                                                                   some grid regulations in Germany limit output to as little as 70%
                                                                   of the peak power from the PV system). Conversion of AC data
                                                                   has been made when necessary (Spain, Japan and Canada for
                                                                   instance), in order to calculate the most precise installation
                                                                   numbers every year. Global totals should be considered as
                                                                   indications rather than exact statistics.

IEA PVPS TRENDS 2014 IN PHOTOVOLTAIC APPLICATIONS
TWO // chAPtEr 2 MARKET DEVELOPMENT TRENDS                                                                                                                            9
                                                                                                                                                        VPS
                                                                                                                                                   IEA-P

THE GLOBAL
INSTALLED CAPACITY                                                                  THE MARKET EVOLUTION

The IEA PVPS countries represented more than 125 GW of                              The IEA PVPS Programme’s 24 countries have installed at least
cumulative PV installations all together, mostly grid-connected, at                 35 GW of PV in 2013, with a minimum worldwide installed
the end of 2013. Eight countries that are not part of the IEA PVPS                  capacity amounting to 39 GW. While they are hard to track with a
Programme represented 10,7 additional GW, mostly in Europe:                         high level of certainty, installations in non IEA PVPS countries
Greece with 2,56 GW, Czech Republic with 2,17 GW installed,                         pushed the installed capacity to around 40 GW in 2013 in the most
Romania with 1,15 GW and Bulgaria with 1,02 GW and below the                        optimistic case. It is certain that between 39 and 40 GW have been
GW mark Slovakia and Ukraine. Next to these countries, India                        installed in 2013. The most remarkable trend of 2013 is the growth
installed more than 2,3 GW while Taiwan reached 376 MW.                             of the global PV market after a year of relative stagnation in 2012,
Numerous countries all over the world have started to develop PV                    compared to 2011. With close to 40 GW, the market grew in 2013
but few have yet reached a significant development level in terms                   by around 35%, again the highest installation ever for PV.
of installed capacity at the end of 2013.
                                                                                    China installed 12,92 GW in 2013, according to various sources,
The European Photovoltaic Industry Association believes that an                     setting an absolute record that places the country in first place
additional 3,6 GW of PV systems have been installed in the last                     with regard to all time PV installations. This is perfectly in line with
twelve years. Other sources indicate only 1 GW.                                     their political will to develop renewable sources and in particular
                                                                                    PV in the short to medium term.
Presently it seems that 136,5 GW represents the minimum
installed by end of 2013 with a firm level of certainty. Adding                     The second place goes to Japan, with 6,97 GW installed in the
3,6 GW of additional capacity spread all over the world would                       country in 2013.
increase the total to 140 GW.
                                                                                    The USA installed 4,75 GW of PV systems in 2013, with a balanced
                                                                                    share between large utility-scale PV and rooftop installations.

fIgurE 1: EVOLUTION OF PV INSTALLATIONS (GW)                                        fIgurE 2: EVOLUTION OF ANNUAL PV INSTALLATIONS
                                                                                    (MW)

     140                                                                                 45 000

                                                                                         40 000
     120

                                                                                         35 000
     100
                                                                                         30 000

     80                                                                                  25 000
GW                                                                                  MW

     60                                                                                  20 000

                                                                                         15 000
     40
                                                                                         10 000

     20
                                                                                          5 000

      0                                                                                      0
           2000 2001 2002 2003 2004 2005 2006 2007 2008 2009 2010 2011 2012 2013                  2000 2001 2002 2003 2004 2005 2006 2007 2008 2009 2010 2011 2012 2013

                 IEA PVPS countries              Non IEA PVPS countries                                 IEA PVPS countries        Non IEA PVPS countries

                                                                                                        China          Japan           USA

                                                           SOURCE IEA PVPS, EPIA.                                                                 SOURCE IEA PVPS, EPIA.

                                                                                                           IEA PVPS TRENDS 2014 IN PHOTOVOLTAIC APPLICATIONS
TWO // chAPtEr 2 MARKET DEVELOPMENT TRENDS 10
THE MARKET EVOLUTION / CONTINUED
Germany installed 3,3 GW, after three years at levels of PV Malaysia installed 48 MW for the second year of its FiT system.
installations around 7,5 GW. This occurred in the context of Taiwan installed 170 MW in a growing market.
reduced Feed-in Tariffs (FiTs), and the German authorities’ aim to
In North America, preliminary data for Canada shows the
control the development of PV in the country where the total
installation of 444 MW while the appetite for PV in Latin and
installed PV capacity is now more than 35 GW, still the world
Central America hasn’t transformed into a real market yet.
record in absolute value.
Several GW of PV plants have been validated in Chile. The real PV
Italy installed 1,6 GW in 2013, down from the 9,3 GW in 2011 and development of grid-connected PV plants hasn’t started yet in the
3,6 GW in 2012. region but much more is expected in 2014.
Together, these 5 countries represent 73% of all installations In the Middle East, Israel progressed rapidly (244 MW), with 1,5% of
recorded in 2013 and slightly less in terms of installed capacity. its electricity already coming from PV while the PV installations in
Turkey have started more slowly with around 6 MW installed in 2013
The following five places go to the UK (1,5 GW), India (1,11 GW),
Romania (1,1 GW), Greece (1,04 GW) and Australia (0,81 GW).
Together these 10 countries cover 87% of the 2013 world market. A GLOBAL MARKET
France left the top 10 and installed 643 MW in 2013. Korea, Canada While large markets such as Germany or Italy have exchanged the
and Thailand installed around 440 MW. They have respectively first two places from 2010 to 2012, China, Japan and the USA scored
reached a capacity of 1,47 GW, 1,2 GW and finally 0,82 GW. the top 3 places in 2013. Most top 10 leaders haven’t changed
except Romania which entered the top 10 in 2013 and France that
Smaller countries have performed in various ways: Belgium
left it. The number of small-size countries with impressive and
installed 236 MW and has now reached more than 3 GW. Some
unsustainable market evolutions remains stable. In 2013, Greece
countries that grew dramatically over recent years have now
and Romania installed more than 1 GW of PV. The Czech Republic
stalled or experienced limited additions: Spain (102 AC-MW) now
experienced a dramatic market uptake in 2010, immediately
totals 4,6 GW-AC of PV systems followed by the Czech Republic
followed by a collapse. Belgium and Greece installed hundreds of
(88 MW) at 2,1 GW.
MW several years in a row. 2013 started to show a more reasonable
In Europe, net-metering systems allowed the market to grow market split, with China, Japan and the USA climbing up to the first
quickly in Denmark (156 MW added) and the Netherlands places, while India, UK and Australia confirmed their market
(360 MW reported). 2013 saw also significant additions in potential. The market level necessary to enter this top 10 grew quite
Switzerland (319 MW) and Austria (263 MW). fast then stabilized in 2012, with 811 MW in 2013 against 912 MW in
fIgurE 3: THE GLOBAL PV MARKET 2013 fIgurE 4: CUMULATIVE CAPACITIES AT THE END OF 2013
OTHER OTHER
COUNTRIES, 9% COUNTRIES, 11%
CANADA, 1%
FRANCE, 2% INDIA, 2%
AUSTRALIA, 2% GREECE, 2%
GREECE, 3% CHINA, 32% BELGIUM, 2% GERMANY, 25%
ROMANIA, 3% AUSTRALIA, 2%
INDIA, 3% UK, 2%
UK, 4% FRANCE, 4%
SPAIN, 4%
ITALY, 4%
CHINA, 14%
GERMANY, 8% USA, 9%
JAPAN, 17% ITALY, 13%
USA, 12% JAPAN, 10%
SOURCE IEA PVPS, EPIA. SOURCE IEA PVPS, EPIA.
IEA PVPS TRENDS 2014 IN PHOTOVOLTAIC APPLICATIONSTWO // chAPtEr 2 MARKET DEVELOPMENT TRENDS 11
VPS
IEA-P
2012. It can be seen as a fact that the growth of the PV market took
place in countries with an already well-established market. In tAblE 1: EVOLUTION OF TOP 10 MARKETS
parallel, the downsizing of several European markets was largely RANKING 2011 2012 2013
compensated by the growth in Asian and American markets.
1 ITALY GERMANY CHINA
2 GERMANY ITALY JAPAN
PROJECTS ARE POPPING UP 3 CHINA CHINA USA
The most remarkable trend of 2013 is probably the emergence of 4 USA USA GERMANY
interest in PV in dozens of new countries around the world. 5 FRANCE JAPAN ITALY
Projects are popping up and even if many won’t be realized in the 6 JAPAN FRANCE UK
end, it is expected that installation numbers will start to be visible
7 BELGIUM AUSTRALIA INDIA
in countries where PV development was limited until now.
8 UK INDIA ROMANIA
9 AUSTRALIA UK GREECE
LARGEST ADDITIONS EVER 10 GREECE GREECE AUSTRALIA
The record from Italy with 9,3 GW has been beaten in 2013 by MARKET LEVEL TO ACCESS THE TOP 10
China with its 12,92 GW. Japan with 6,97 GW represents the 2nd 425 MW 912 MW 811 MW
entry in this list. Even with 3,3 GW, Germany’s installations in 2013
position the country in the top 10. Countries that installed at least SOURCE IEA PVPS, EPIA.
1 GW of PV system in one year are increasing and their number
is growing every year.
fIgurE 5: 20 LARGEST ADDITIONS OF CAPACITIES 2008-2013 (MW)
14 000
CHINA
13 000 12 920 MW
12 000
11 000
10 000
ITALY
9 000 9 305 MW
8 000
GERMANY GERMANY
GERMANY 7 413 MW 7 604 MW JAPAN
MW 7 000
6 988 MW 6 968 MW
6 000
5 000 USA
ITALY 3 647 MW 4 751 MW
4 000 GERMANY
SPAIN 3 806 MW USA CHINA 3 500 MW
CHINA 2 500 MW GERMANY
3 000 3 330 MW 3 369 MW 3 305MW
ITALY
GERMANY 2.322 MW
2 000
1 958 MW FRANCE USA 1 919 MW JAPAN ITALY
1 770 MW 1 718 MW 1 620 MW
1 000
0
2008 2009 2010 2011 2012 2013
2 000-4 000 0 - 2 000
8 000 - 10 000 6 000 - 8 000 4 000-6 000
12 000 - 14 000 10 000 - 12 000 MW MW
MW MW MW
MW MW
SOURCE IEA PVPS.
IEA PVPS TRENDS 2014 IN PHOTOVOLTAIC APPLICATIONSTWO // chAPtEr 2 MARKET DEVELOPMENT TRENDS 12
THE MARKET EVOLUTION / CONTINUED
OFF-GRID MARKET DEVELOPMENT In Japan, some MW have been installed, bringing the installed
capacity above 100 MW, mainly in the non-domestic segment.
The off-grid market can hardly be compared to the grid connected
market: the rapid deployment of grid-connected PV dwarfed the In some countries, off-grid systems with back-up (either diesel
off-grid market as Figure 6 clearly shows. generators or chemical batteries) represent an alternative to
bringing the grid to remote places. This trend is specific to countries
Nevertheless, off-grid applications are developing more rapidly in
that have enough solar resource throughout the year to make a PV
several countries than in the past and some targeted support has
system viable. In most developed countries in Europe, Asia or
been implemented.
America, this trend hasn’t been seen and the future development of
In Australia 28 MW of off-grid systems have been installed in 2013 off-grid applications will most probably be seen first on remote
and in Japan 14,1 MW. In China, some estimates showed that 500 islands. The case of Greece is rather interesting in Europe, with
MW of off-grid applications have been installed in 2013, with an numerous islands not connected to the mainland grid that have
unknown percentage of hybrid systems. It can be considered that installed dozens of MW of PV systems in the previous year. These
most industrial applications and rural electrification systems are systems, providing electricity to some thousands of customers will
most probably hybrid. require rapid adaptation of the management of these mini-grids in
order to cope with high penetrations of PV. The French islands in the
In most European countries, the off-grid market remains a very
Caribbean Sea and the Indian Ocean have already imposed specific
small one, mainly for remote sites, leisure and communication
grid codes to PV system owners. PV production must be forecasted
devices that deliver electricity for specific uses. Some mountain
and announced in order to better plan grid management. As an
sites are equipped with PV as an alternative to bringing fuel to
example, the island of La Reunion (France) operated more than
remote, hardly accessible places. However this market remains
150 MW of PV at the end of 2013 for a total population of 840 000.
quite small, with at most some MW installed per year per country,
While this represents roughly 50% of the penetration of PV in
with 1,2 MW in Sweden.
Germany, the capacity of the grid on a small island to absorb fast
production and consumption changes is much more challenging.
Outside the IEA PVPS network, Bangladesh installed an
fIgurE 6: SHARE OF GRID-CONNECTED AND OFF-GRID impressive amount of off-grid SHS systems in recent years.
INSTALLATIONS Around three million systems were operational by the end of 2013
with an average size of 60 W. This represents a total installed
100
capacity of around 180 MW, quite significant in the South-East
Asia region.
95
India has foreseen up to 2 GW of off-grid installations by 2017,
including 20 million of solar lights in its National Solar Mission.
90
These impressive numbers show how PV now represents a
competitive alternative to providing electricity in areas where
%
traditional grids have not yet been deployed. In the same way as
85 mobile phones are connecting people without the traditional lines,
PV is perceived as a way to provide electricity without building
complex and costly grids first. The challenge of providing
80
electricity for lighting, communication, including access to the
Internet, will see the progress of PV as one of the most reliable
75 and promising sources of electricity in developing countries in the
2000 2001 2002 2003 2004 2005 2006 2007 2008 2009 2010 2011 2012 2013 coming years.
Off-grid Grid-connected
SOURCE IEA PVPS.
IEA PVPS TRENDS 2014 IN PHOTOVOLTAIC APPLICATIONSTWO // chAPtEr 2 MARKET DEVELOPMENT TRENDS 13
VPS
IEA-P
PV DEVELOPMENT PER REGION
AND SEGMENT
The evolution of grid-connected PV towards a balanced The same pattern between decentralized and centralized PV is
segmentation between centralized and decentralized PV has visible in the Asia Pacific region and in the Americas, with a
reversed course in 2013. Centralized PV has evolved faster in domination of centralized PV installations. This shouldn’t change
spite of several countries deciding to discontinue the support for in the coming years, with the arrival of more developing countries
utility-scale PV in Europe. This evolution has different causes; for that could focus on pure electricity generation rather than Self-
example, environmental concerns about the use of agricultural consumption driven business models. The availability of cheap
land, difficulties of reaching competitiveness with wholesale capital for financing large-scale PV installations could also
electricity prices in this segment and grid connection issues. This reinforce this evolution and reduce even further the development
doesn’t imply the end of development in the utility-scale segment of rooftop PV.
in these countries but at least a rebalancing towards Self-
Figure 8 illustrates the evolution of the share of grid-connected PV
consumption driven business models. Globally, centralized PV
installations per region from 2000 to 2013. While Asia started to
represented more than 50% of the market in 2013, mainly driven
dominate the market in the early 2000s, the start of FiT-based
by China and the USA.
incentives in Europe and particularly in Germany caused a major
market uptake in Europe. While the market size grew from around
200 MW in 2000 to close to half a GW in 2003, the market started
to grow very fast, thanks to European markets in 2004. From
around 1 GW in 2004, the market reached close to 2,5 GW in
2007. In 2008, Spain fuelled market development while Europe
achieved more than 80% of the global market: a performance
repeated until 2010.
fIgurE 7: EVOLUTION OF GRID-CONNECTED PV fIgurE 8: SHARE OF GRID-CONNECTED PV MARKET PER
MARKET SEGMENTATION REGION 2000-2013
100 100
90
80 95
70
60 90
% 50 %
40 85
30
20 80
10
0 75
2000 2001 2002 2003 2004 2005 2006 2007 2008 2009 2010 2011 2012 2013 2000 2001 2002 2003 2004 2005 2006 2007 2008 2009 2010 2011 2012 2013
Grid-connected decentralized Grid-connected centralized Middle East & Africa Europe Asia Pacific America
SOURCE IEA PVPS. SOURCE IEA PVPS, EPIA.
IEA PVPS TRENDS 2014 IN PHOTOVOLTAIC APPLICATIONSTWO // chAPtEr 2 MARKET DEVELOPMENT TRENDS 14
PV DEVELOPMENT PER REGION
AND SEGMENT / CONTINUED
While Europe still represented a major part of all installations
globally in 2013, the share of Asia and America started to grow fIgurE 10: GRID-CONNECTED CENTRALIZED &
rapidly in 2012 and in 2013, with Asia taking the lead. This DECENTRALIZED PV INSTALLATIONS BY REGION
evolution is quite visible from 2010 to 2013, with the share of the IN PVPS COUNTRIES IN 2013 (MW)
Asia Pacific region growing from 17% to almost 60%, whereas the
25 000
European share of the PV market went down from 82% to 28% in
three years. This trend shows that the development of PV globally
is not anymore in the hands of European countries. 20 000
Finally, the share of the PV market in the Middle East and in Africa
remains relatively small compared to other regions of the world.
15 000
MW
10 000
5 000
0
America Europe Middle East Asia Pacific
& Africa
Grid-connected decentralized Grid-connected centralized
SOURCE IEA PVPS, EPIA.
fIgurE 9: EVOLUTION OF ANNUAL INSTALLATIONS AND TOTAL CAPACITIES PER REGION 2011/2013 (MW)
2011 2012 2013
ASIA PACIFIC, AMERICA, 8% AMERICA, 13% AMERICA, 14%
17%
INStAllEd
ASIA PACIFIC, ASIA PACIFIC,
cAPAcIty
MIDDLE EAST
ANNuAl
27% 57%
& AFRICA, 0%
EUROPE, 28%
MIDDLE EAST
& AFRICA, 1%
EUROPE, 75% EUROPE, 59% MIDDLE EAST
& AFRICA, 1%
ASIA PACIFIC,
cummulAtIVE
AMERICA, 7% ASIA PACIFIC, AMERICA, 8% AMERICA, 10%
16%
INStAllEd
MIDDLE EAST 19%
cAPAcIty
ASIA PACIFIC,
& AFRICA, 0% MIDDLE EAST 30%
& AFRICA, 1%
EUROPE, 77% EUROPE, 72% EUROPE, 59%
MIDDLE EAST
& AFRICA, 1%
SOURCE IEA PVPS, EPIA.
IEA PVPS TRENDS 2014 IN PHOTOVOLTAIC APPLICATIONSTWO // chAPtEr 2 MARKET DEVELOPMENT TRENDS 15
VPS
IEA-P
THE AMERICAS
The Americas represented 5,3 GW of installations and a total • Large Renewable Procurement programme development
cumulative capacity of 13,7 GW in 2013. If most of these (above 500 kW): competitive, non-FiT scheme with a target of
capacities are located in the USA, and in general in North 140 MW for 2014 and 2015.
America, several countries have started to install PV in the
Net-metering in Ontario allows PV systems up to 500 kW to self-
centre and south of the continent.
consume part of their electricity and obtain credits for the excess
electricity injected into the grid. However, since the FiT scheme
CANADA remains more attractive, the net-metering remains marginally used.
PV remained marginal in other provinces in 2013 despite the existence
FINAL ELECTRICITY CONSUMPTION 530 TWh
HABITANTS 35 MILLION of support schemes in a number of provinces and territories.
IRRADIATION 1 150 kWh/kW
PV INSTALLATIONS IN 2013 445 MW
PV INSTALLED CAPACITY 1 210 MW MEXICO
PV PENETRATION 0,3 %
FINAL ELECTRICITY CONSUMPTION 234 TWh
HABITANTS 122 MILLION
At the end of 2013, the installed capacity of PV systems in Canada IRRADIATION 1 780 kWh/kW
reached more than 1,2 GW, out of which 445 MW were installed in PV INSTALLATIONS IN 2013 60 MW
PV INSTALLED CAPACITY 112 MW
2013. Decentralized rooftop applications amounted to 55 MW (down
PV PENETRATION 0,1 %
from 87 MW in 2012) while large-scale centralized PV systems more
than doubled from 181 MW to 390 MW in 2013. The market was
dominated by grid-connected systems. Around 60 MW of PV systems were installed in Mexico in 2013,
increasing the total capacity in the country to about 112 MW.
Prior to 2008, PV was serving mainly the off-grid market in Canada.
At the end of 2013, a 30 MW plant was being built in Baja
Then the FiT programme created a significant market development in
California, the largest so far in Central and Latin America, and
the province of Ontario. These installations are still largely concentrated
2 GW of request for permits have been filled to the authorities.
in the province of Ontario and driven mostly by a FiT system.
In the long term, the Mexican government has announced a target of
Ontario’s FiT Programme
2 GW of PV systems in 2025 and the market is starting to take-off.
While net-metering support schemes for PV have been
The regulatory framework for PV evolved in 2013 and the 2013-
implemented in most provinces, the development took place
2017 National Energy Strategy prioritizes now the need to tap into
mostly in Ontario. This province runs a FiT system in parallel with
the RES potential.
net-metering opportunities for systems up to 500 kW.
The possibility to achieve accelerated depreciation for PV systems
This FiT programme is North America’s first comprehensive
exists at the national level (companies can depreciate 100% of the
guaranteed pricing structure for electricity production from renewable
capital investment during the first year) and some local incentives
energy sources (RES). The first part targets generators above 10 kW
such as in Mexico City could help PV to develop locally.
and up to 500 kW (the “FiT Programme”) while the second part
focuses on systems below 10 kW (“MicroFiT programme”). Eligible A net-metering scheme (Medición Neta) exists for PV systems below
PV systems are granted a FiT or microFiT for a period of 20 years. 500 kW mainly in the residential and commercial segments. The price
of PV electricity for households with high electricity consumption is
In 2013, the FiT levels were reviewed and tariffs were reduced to
already attractive from an economic point of view since they pay
follow the PV system costs decrease.
more than twice the price of standard consumers. In 2013, the
Ontario’s Long Term Energy Plan aims to install 10,7 GW of non- possibility was added for a group of neighbouring consumers (for
hydro RES sources by 2021 (revised in 2013 Long Term Energy instance in a condominium) to join together to obtain a permit to
Plan) in the province. The LTEP outlines the following annual produce PV electricity. This net-metering scheme resulted in around
procurement targets from 2014 to 2017: 5 000 new systems installed in 2013.
• 50 MW microFiT (below 10 kW) A Self-consumption scheme exists for large installations, with the
possibility to generate electricity in one point of consumption at
• 150 MW FiT (below 500 kW)
IEA PVPS TRENDS 2014 IN PHOTOVOLTAIC APPLICATIONSTWO // chAPtEr 2 MARKET DEVELOPMENT TRENDS 16
THE AMERICAS / CONTINUED
several distant sites. In this scheme, the utility charges a fee for With regard to utility-scale PV projects, these are developing
the use of its transmission and distribution infrastructure. under Power Purchase Agreements (PPAs) with utilities.
In December 2012, the National Fund for Energy Savings PACE programmes have been introduced in more than 30 states as
announced the start of a new financing scheme for PV systems for well; PACE (Property Assessed Clean Energy) is a means of
DAC consumers: 5 year loans with low interest rates can be used financing renewable energy systems and energy efficiency
to finance PV systems. measures. It also allows avoiding significant upfront investments and
eases the inclusion of the PV system cost in case of property sale.
Rural electrification is supported through a Solar Villages programme.
Large power plants have been announced that could increase the With such a diverse regulatory landscape, and different electricity
PV market to several hundreds of MW a year. prices, PV has developed differently across the country.
In December of 2012, in an effort to settle claims by U.S.
USA manufacturers that Chinese manufacturers “dumped” products into
the U.S. market and received unfair subsidies from the Chinese
FINAL ELECTRICITY CONSUMPTION 3,889 TWh government, the U.S. Department of Commerce issued orders to
HABITANTS 316 MILLION begin enforcing duties to be levied on products with Chinese made
IRRADIATION 1 300 kWh/kW
PV INSTALLATIONS IN 2013 4 751 MW
PV cells. The majority of the tariffs range between 23%-34% of the
PV INSTALLED CAPACITY 12 079 MW price of the product. In December 2013 new antidumping and
PV PENETRATION 0,4 % countervailing petitions were filled with the U.S. Department of
Commerce and the United States International Trade Commission
(ITC) against Chinese and Taiwanese manufacturers of PV cells and
Total PV capacity in the USA surpassed 12 GW at the end of 2013
modules with conclusion expected in 2014.
with 4 751 MW added during that year. The total installed solar
power capacity in the USA is now 12 079 MW – or more than
445 000 distributed installations. Once dominated by distributed OTHER COUNTRIES
installations, the US market is now lead by large-scale
installations, representing 60% of the installed capacity in 2013. Several countries in Central and South America have experienced
PV market development in 2013.
The US PV market has been mainly driven by tax credits granted
by the federal US government for some years (that will continue at In Chile, a boom in PV projects announcements has started to
least until 2017) with net-metering offered in some states as a materialize in real developments. Some MW have been installed,
complementary measure. Meanwhile at least 6 states and 17 mostly in the north of the country, and several hundred are
utilities are offering power purchase agreements similar to FiTs. 22 expected in 2014 and later. PV development takes place in a
states are offering capital subsidies, 29 states have set up an RPS context of high electricity prices and high solar irradiation, the
(Renewable Portfolio Standard) system out of which 17 have necessary conditions for reaching parity with retail electricity
specific PV requirements. Finally net-metering policies now exist in prices. The market is mostly driven by PPAs for large-scale plants.
43 states. In 2013, some jurisdictions had disputes between utilities Brazil, by far the largest country on the continent, has started to
and solar advocates that were concluded in favour of net-metering include PV in auctions for new power plants while a net-metering
policies. Meanwhile, several state public utility commissions and system is in place but without great success for smaller
utilities are in the process of developing a Value-of-Solar Tariff installations. Many expects that the PV market in Brazil will take-
(VOST) as an alternative to net metering. off through these auctions, with competitive prices. In addition
In most cases, the financing of these measures is done through Brazil runs net-metering systems but with limited results so far.
public funding and/or absorbed by utilities. In Argentina, the Government has set-up renewable energy
Third party financing is developing fast in the USA, with for targets for 2016 of 3 GW. This includes 300 MW for solar PV
instance 69% of residential systems installed under the Californian systems. However, so far the development was quite small, with
Solar Initiative being financed in such a way. Third parties are also only a few MW installed in the country.
widely used to benefit from tax breaks in the best way. These In Peru, two 20 MW plants that have been operational since end
innovative financing companies cover the high up-front 2012 were inaugurated at the beginning of 2013. Other plants are
investment through solar leases for example.
IEA PVPS TRENDS 2014 IN PHOTOVOLTAIC APPLICATIONSTWO // chAPtEr 2 MARKET DEVELOPMENT TRENDS 17
VPS
IEA-P
foreseen until 2014. Several programmes related to rural Market Drivers
electrification should be started.
Australian Government support programmes impacted significantly
Several other countries in Central and Latin America have put on the PV market in recent years.The 45 000 GWh Renewable
support schemes in place for PV electricity. Ecuador is becoming Energy Target (RET) (a quota-RPS system) consists of two parts – the
a promising market with FiT legislation (0,40 USD/kWh – 15 Large-scale Renewable Energy Target (LRET) of 41 000 GWh by
years) in place and several ground mounted projects (up to 30 2020 and the Small-scale Renewable Energy Scheme (SRES). Liable
MW) have been announced as being built in the coming years. entities need to meet obligations under both the SRES and LRET by
Other countries such as Uruguay have launched a call for tender acquiring and surrendering renewable energy certificates created
for 200 MW of PV with a PPA in early 2013 at the low 90 from both large and small-scale renewable energy technologies. The
USD/MWh rate and projects were approved. The net-metering SRES covers small generation units (small-scale PV up to 100 kW,
system launched in 2010 failed to develop the market so far. small wind turbines and micro hydroelectric systems) and solar water
Several other countries including islands in the Caribbean are heaters, creating small-scale technology certificates (STCs).
moving fast towards PV deployment. Certificates are granted based on 15 years of deemed solar
production. The number of certificates granted is equal to those
In the region, French overseas departments have seen an important produced by other technologies from January 2013 onwards; down
increase of PV penetration in the last years, with 34 MW in French from a factor 5 multiplier in 2009. The Solar Cities programme has
Guyana, 60 MW in Martinique and 64 MW in Guadeloupe and some been completed and is not supporting any further installations.
smaller numbers in Saint Martin. They represent so far the largest
density of PV installations in the Caribbean region per inhabitant. Large scale PV benefited from an auction (ACT programme) in
January 2012 for up to 40 MW and at least 70 MW were under
construction at the end of 2013. But only 2 MW were installed in
2013 in this segment. The Solar Flagship Programme announced
ASIA – PACIFIC a successful project with 150 MW of large-scale PV planned. In
addition, numerous solar cities programmes are offering various
incentives that are complementing national programmes.
The Asia Pacific region installed close to 23,3 GW in 2013 and
The market take-off in Australia accelerated with the emergence
more than 42 GW are producing PV electricity. This region
of FiTs programmes in several states to complement the national
experienced the fastest market development in 2013 and will
programmes. All FiT programmes were closed at the end of 2013.
most probably continue in the same way.
In general, incentives for PV, including FiTs, have been removed
by State Governments and reduced by the Federal Government.
AUSTRALIA
Self-Consumption
FINAL ELECTRICITY CONSUMPTION 199 TWh
No promotion of Self-consumption as such exists in Australia.
HABITANTS 23 MILLION
IRRADIATION 1 400 kWh/kW
However, zero FiTs for new connections automatically favour
PV INSTALLATIONS IN 2013 811 MW Self-consumption.
PV INSTALLED CAPACITY 3 226 MW
PV PENETRATION 2,3 %
There is increasing customer interest in onsite storage. Although
not yet cost effective for most customers, a market for storage is
already developing.
After having installed 806 MW in 2011, 1 038 MW in 2012,
Australia continued in 2013 with 811 MW installed. The country Outlook
has more than 3,2 GW of PV systems installed and commissioned, Despite the reduction and removal of most government support
mainly in the residential rooftops segment (1 million homes have schemes, the solar industry has stabilized at high volumes
now a PV system, an average penetration of 15%, with peaks up (>150,000 systems per year). This situation will be affected by the
to 30%), with grid-connected applications. Only a mere 24 MW government’s review of the Renewable Energy Target, which has
can be considered as large scale centralized power plants while recommended both SRES and LRET be wound back or scrapped.
new off-grid applications amounted in 2013 to 9 MW in the
domestic sector and 5 MW for non-domestic applications.
IEA PVPS TRENDS 2014 IN PHOTOVOLTAIC APPLICATIONSTWO // chAPtEr 2 MARKET DEVELOPMENT TRENDS 18
ASIA – PACIFIC / CONTINUED
From December 2012, FiT levels will be adjusted according to the
CHINA solar resources and a Self-consumption subsidy has been
introduced. In case of Self-consumption, the excess electricity can
FINAL ELECTRICITY CONSUMPTION 4 600 TWh
be acquired by the grid operator and a bonus can be paid on top
HABITANTS 1 357 MILLION
IRRADIATION 1 300 kWh/kW
of the wholesale electricity price. Additionally, it is expected that
PV INSTALLATIONS IN 2013 12 920 MW the FiT will progressively take over the subsidy programmes while
PV INSTALLED CAPACITY 19 720 MW Self-consumption driven applications will be more incentivized
PV PENETRATION 0,6 % than utility-scale ones.
The market is mostly concentrated in the grid connected systems,
With 12,92 GW installed in 2013 alone, the Chinese PV market has with a low market for off-grid applications. In total, distributed
beaten all previous records of yearly installations. The fast growth applications now represent much less than 50% of the total, as
drove the market from 3,5 GW in 2012 to more than triple in one opposed to the 2013 situation.
single year. With these installations, the PV installed capacity rose
to close to 20 GW, making it the second in the world so far, behind Grid connection, especially for large scale PV became more difficult
Germany and ahead of Italy. in 2013, due to inadequate grid regulations and management in
some regions. This has led to curtailment issues already in 2012 and
Since 2008, utility-scale PV has become the main segment 2013 and will be the key to further PV development. In addition, PV
developing in China and this was again the case with 12,1 GW requires adequate funding solutions that will require also more
installed in 2013. More recently rooftop PV has received some transparency from the PV sector with regard to quality. Solutions
interest and starts to develop, in both BAPV (PV on rooftops) and could be found through third party financing and the use of adequate
BIPV (PV integrated in the building envelope) segments, but at a insurance in order to better the perception of financing parties and
really slower pace. Only 800 MW were installed in 2013. The lower the cost of capital and therefore the cost of PV electricity.
growth of centralized PV applications in 2013 shows the ability of
the FiT regime to develop rapidly PV markets. This rapid growth Comments
can be explained by the willingness of developers to obtain the FiT China has finally become the very first market in the world.
at 1,0 CNY/kWh guaranteed until January 2014. Adequate policies are being put in place progressively and will
Several schemes are incentivizing the development of PV in allow the market to continue at a high level.
China. They aim at developing utility-scale PV through adequate
schemes, rooftop PV in city areas and micro-grids and off-grid
JAPAN
applications in un-electrified areas of the country. The following
schemes were in place in 2013: FINAL ELECTRICITY CONSUMPTION 979 TWh
HABITANTS 127 MILLION
• A FiT scheme for utility-scale PV that is financed by a IRRADIATION 1 050 kWh/kW
renewable energy surcharge for electricity consumers. PV INSTALLATIONS IN 2013 6 968 MW
PV INSTALLED CAPACITY 13 599 MW
• A capital subsidy for PV on buildings (the PV Building Project), PV PENETRATION 1,4 %
financed through a special fund for renewable energy.
• The so-called “Golden Sun Programme” fund that also aims Total annual installed capacity of PV systems reached 6 968 MW
to develop PV on buildings and off-grid applications. The 4th (DC) in 2013 in Japan, a 400% increase compared to 2012. The
phase started in 2012 with 1 709 MW of projects receiving the total cumulative installed capacity of PV systems in Japan reached
capital subsidy. 13,6 GW in 2013.
• The total funding for these last two programmes amounts to With the start of the FiT programme in July 2012, the market for
between 10 and 20 BCNY each year. public, industrial application and utility-scale PV systems grew
• In total, the existing programmes are covering up to 10,5 GW of fast. Most installations took place under this FiT programme in
projects already installed or approved for future installations. 2013. The breakdown of PV systems installed in 2013 is 14,1 MW
for off-grid application, 6,95 GW for grid-connected distributed
plus centralized application.
IEA PVPS TRENDS 2014 IN PHOTOVOLTAIC APPLICATIONSTWO // chAPtEr 2 MARKET DEVELOPMENT TRENDS 19
VPS
IEA-P
While the PV market in Japan developed in the traditional rooftop
market (with 1,5 million systems installed), 2012 and 2013 have KOREA
seen the development of large-scale centralized PV systems,
FINAL ELECTRICITY CONSUMPTION 475 TWh
especially in 2013 with 1,8 GW of centralized plants.
HABITANTS 50 MILLION
Investment Subsidy IRRADIATION 1 258 kWh/kW
PV INSTALLATIONS IN 2013 445 MW
The subsidy programme, restarted in 2009, aims to promote the PV INSTALLED CAPACITY 1 475 MW
dissemination of high-efficiency (depending on the technology, PV PENETRATION 0,4 %
efficiency must be above in between 8,5% and 16%) and low-price
PV systems below 10 kW. A specific certification scheme has to Since the record-breaking year of 2008, that saw 276 MW of PV
be met. This instrument was abandoned at the end of the fiscal installations, the PV market remained stagnant in Korea during
year 2013 (April 2014). the next three years. This was mainly due to the limited FiT
FiT scheme which played initially an important role in the PV market
expansion. However, 295 MW in 2012 and 445 MW in 2013,
On July 1st 2012, the existing scheme that allowed purchasing respectively, were installed, reaching the highest level of
excess PV production was replaced by a new FiT scheme. Its cost installations so far; breaking the record of annual installation.
is shared among electricity consumers with some exceptions from Thanks mainly to the newly introduced RPS scheme (with PV set-
electricity-intensive industries. This scheme has led to the fast aside requirement), the market started to react in 2013.
market development seen in Japan in 2013, and more is expected
in 2014. At the end of 2013, the total installed capacity was about 1,47 GW,
among those the grid-connected centralized system accounted for
The market was balanced between residential below 10 kW, around 82% of the total cumulative installed power. The grid-
commercial below 50 kW, industrial and large-scale centralized connected distributed system amounted to around 18% of the total
plants in 2013. cumulative installed PV power. The share of off-grid non-domestic
Self-Consumption and domestic systems has continued to decrease and represents
less than 1% of the total cumulative installed PV power.
The FiT programme is used to remunerate excess PV electricity
not Self-consumed for systems below 10 kW. However with tariffs The Korean government continued to support strongly R&D, PV
above the retail electricity prices, Self-consumption is not deployment, infrastructure building and market promotion.
incentivized. Among these, the government-driven RPS scheme and R&D
support played major roles in boosting PV deployment and
Other Support Schemes industry development.
Other schemes exist in Japan, with various aims. The “project Various incentives have been used to support PV development. In
supporting acceleration of introduction of new and renewable 2008, the “Third Basic Plan for the Promotion of Technological
energy”, the METI, was launched in 2011 and supports among other Development, Use, and Diffusion of New and Renewable Energy”
technologies, PV in the regions damaged by the Great East Japan based on the “First National Energy Basic Plan” was issued. This
Earthquake of 2011. Another subsidy comes from the Ministry of plan includes the construction of “One Million Green Homes” and
Environment and supports climate change enabling technologies for “200 Green Villages” by 2020. Based on this plan, the RPS
local authorities’ facilities, industrial facilities, schools, local (Renewable Portfolio Standards) scheme has replaced the previous
communities and cities. Such projects are also promoting the use of “FiT” scheme in 2012. The RPS was launched in 2012 as planned
local storage (batteries) to favour the development of renewable and will be active until 2020. Currently the “Fourth Basic Plan for the
sources of energy. Other schemes can be found as well, showing Promotion of Technological Development, Use, and Diffusion of
how Japan is seriously considering the development of PV as an New and Renewable Energy” based on the “Second National
alternative source of electricity for the future. Energy Basic Plan” is about to be issued. The new plan will include
expansion of yearly PV set-aside requirement, shortening the
target year by one year (now 2015 from originally 2016).
IEA PVPS TRENDS 2014 IN PHOTOVOLTAIC APPLICATIONSYou can also read