Sector Skills Plan
    2021/22

Final Submission

31 August 2020
←
→
Page content transcription
If your browser does not render page correctly, please read the page content below
Sector Skills Plan
2021/22
Final Submission
31 August 2020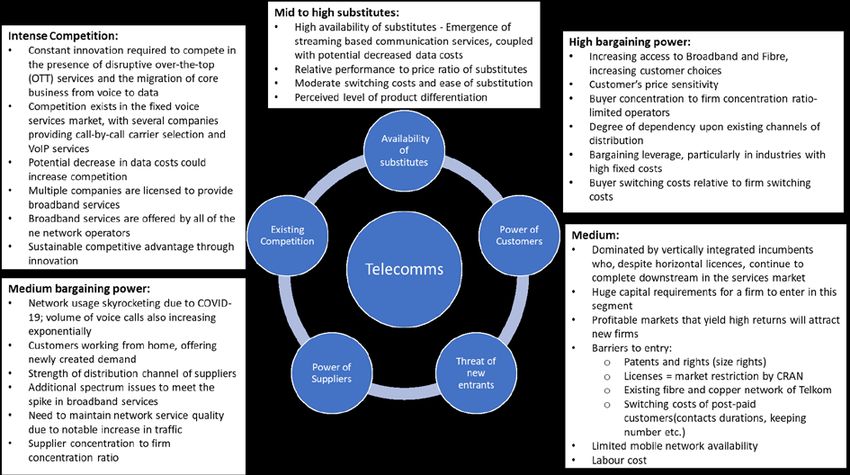
Acronyms
4IR            Fourth Industrial Revolution                                     MCSE      Microsoft Certified Solutions Expert
5G             Fifth-Generation Wireless Technology                             MDDA      Media Development and Diversity Agency
ACASA          Association for Communication and Advertising South Africa       MICT      Media, Information and Communication Technologies
AI             Artificial Intelligence                                          MTSF      Medium Term Strategic Framework
AR             Augmented Reality                                                NAB       National Association of Broadcasters
ATR            Annual Training Report                                           NDP       National Development Plan
B-BBEE         Broad-Based Black Economic Empowerment                           NGO       Non-Governmental Organisation
BABOK          A Guide to the Business Analysis Body of Knowledge               NGP       New Growth Path
CAGR           Compound Annual Growth Rate                                      NLPE      Neuro-Linguistic Programming Executive
CBO            Community- Based Organisations                                   NLRD      National Learner Record Database
CECS           Centre of Excellence in Cyber Security                           NQF       National Qualifications Framework
CEO            Chief Executive Officer                                          NSI       National System of Innovation
CISCO          Commercial & Industrial Security Corporation                     NSDP      National Skills Development Plan
CISSP          Certified Information Systems Security Professional              OFO       Organising Framework for Occupations
COBOL          Common Business-Oriented Language                                OGS       Online Grant System
CompTIA        Computing Technology Industry Association                        PC        Personal Computer
COVID-19       Corona Virus Disease 2019                                        PRINCE2   Projects in Controlled Environments 2
DCDT           Department of Communications & Digital Technologies              PICC      Presidential Infrastructure Coordinating Commission
DHET           Department of Higher Education                                   QCTO      Quality Council for Trades and Occupations
DEF            Deaf Empowerment Firm                                            QMR       Quarterly Monitoring Report
DPSA           Department of Public Service and Administration                  SACIA     Southern African Communications Industries Association
DTT            Digital Terrestrial Television                                   SAP       Systems Applications and Products
EE             Employment Equity                                                SDF       Skills Development Facilitator
ETQA           Education and Training Quality Assurance                         SDL       Skills Development Levy
FOSS           Free Open Access Software                                        SEDA      Small Enterprise Development Agency
GDP            Gross Domestic Product                                           SETA      Sector Education and Training Authority
GITOC          Government Information Technology Officers Council               SET       Science, Engineering and Technology
HEI            Higher Education Institution                                     SIC       Standard Industrial Classification
HEMIS          Higher Education Management Information System                   SIP       Strategic Integrated Projects
HRDSSA         Human Resource Development Strategy of South Africa              SITA      State Information Technology Agency
HTFV           Hard to Fill Vacancy                                             SKA       Square Kilometre Array
IBM            International Business Machines                                  SLA       Service-Level Agreement
IIBA           International Institute of Business Analysis                     SMME      Small, Medium and Micro-enterprises
ICASA          Independent Communications Authority of South Africa             SPO       Sectoral Priority Occupations
ICT            Information and Communication Technology                         SSP       Sector Skills Plan
IITPSA         Institute of Information Technology Professionals South Africa   STB       Set Top Box
IoT            Internet of Things                                               TIA       Technology Innovation Agency
IPAP           Industrial Policy Action Plan                                    TVET      Technical Vocational Education and Training
ISACA          Information Systems Audit and Control Association                USAASA    Universal Service and Access Agency of South Africa
IT             Information Technology                                           VOD       Video on Demand
ITA            Information Technology Association                               VOIP      Voice Over Internet Protocol
M&E            Monitoring and Evaluation                                        VR        Virtual Reality
MANCO          Management Committee                                             WIL       Work Integrated Learning
MCSA           Microsoft Certified Solutions Associate                          WP-PSET   White Paper on Post Schooling Education and Training
MCSD           Microsoft Certified Solutions Developer                          WSP       Workplace Skills Plan

         iii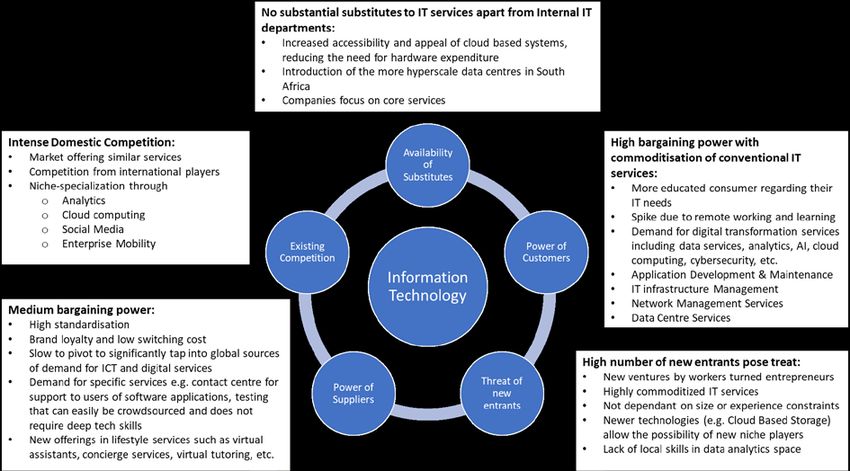
Executive Summary
The MICT Sector Skills Plan (SSP) has been developed over the period of NSDP to map out and plan for
occupational skills needs in the Advertising, Film and Electronic Media, Electronics, Information
Technology and Telecommunications industries. The SSP is updated each year to analyse the changes
in the Sector’s labour market and does so against the backdrop of the economic performance of the
Sector and developmental agenda of the country. It sizes up the gap between the demand and supply
for skills and finally outlines strategies for dealing with the identified challenges.
Sector Profile and Analysis
As of 2020, the MICT Sector is made up of 28 829 spread across five Sub-sectors. This represents a
6.18% decline from 30 727 in 2019. The Information Technology Sub-Sector is the largest Sub-Sector,
accounting for 51% of employers. The Telecommunications and Electronics Sub-Sectors each account
for 13%, closely followed by Advertising (12%) and Film and Electronic Media (11%). Overall, the
number of levy-paying employers decreased slightly from 7,902 in 2019 to 7,207 in 2020.
Although the MICT Sector is characterised by rapid technological change, research points to sluggish
economic growth for the Sector. While the current COVID-19 pandemic has significantly disrupted the
economy, the South African MICT Sector is placed favourably to leverage the opportunities created.
The MICT Sector experienced a 2.2% growth in employment from 2018 to 2020. Employment in the
Information Technology Sub-Sector is the largest of the Sub-Sectors with 85% of employees in 2020.
The Sub-Sectors with the smallest portion of employees are Advertising (1%) and Film and Electronic
Media (1%).
Skills Demand, Supply and Scarcity
The following is a list of the top 10 occupations with hard to fill vacancies in the MICT Sector (and the
quantities needed).
     •   Software developer (2 740)
     •   Computer Network and Systems Engineer (1 780)
     •   ICT Systems Analyst (1498)
     •   Management Consultant (Business Analyst) (504)
     •   ICT Security Specialist (385)
     •   Multimedia Specialist (360)
     •   Programmer Analyst (351)
     •   Developer Programmer (306)
     •   ICT Project Manager (174)
     •   ICT Sales Representative (78)

The MICT SETA has engaged in several partnerships with TVET colleges and institutes for Sectoral and
occupational excellence (ISOEs) to improve delivery of training programmes. Furthermore, the SETA
has mapped occupations against career pathways so that it is easy to identify Sectoral Priority
Occupations interventions and, in that way, ensure seamless funding of skills development through
the 80% Sectoral Priority Occupations allocation of the discretionary grants.

Sector Skills Priority Actions
The following set out the proposed broad skills development objectives for the Sector:
     1. Improve the trustworthiness of the data used for skills planning through data triangulation.
        Such systematic and in-depth research will be achieved through collaboration with industry
        bodies, universities and acclaimed research institutions. Each of the occupations with hard to
        fill vacancies will be mapped to learning pathways.

iv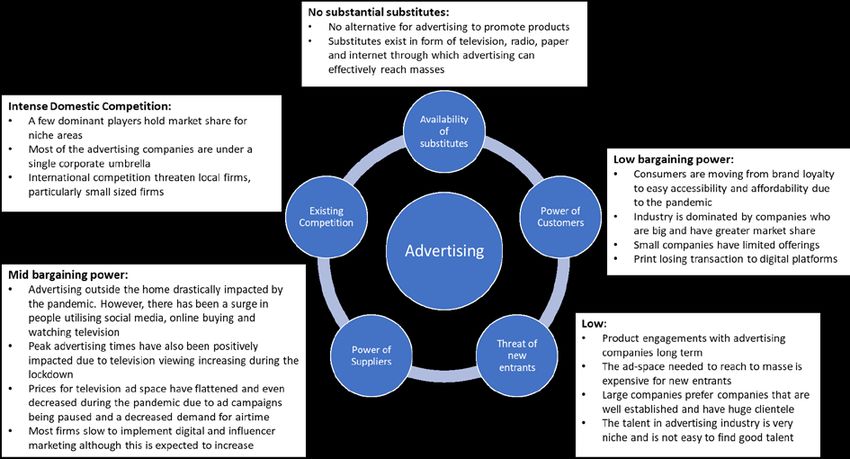
2. Better position the MICT Sector to enable the Fourth Industrial Revolution through increasing
       access to and uptake of relevant skills development interventions, and by developing required
       qualifications and learning interventions. This will be achieved further through support by the
       SETA for the development of the skills required to research, develop and commercialise 4IR
       technologies and products. The impact of COVID-19 in relation to the enablement of 4IR
       cannot be ignored therefore, in implementing 4IR priority programmes, companies that have
       been and will be impacted by COVID-19 are also accounted for in the SETA’s strategies.
    3. Set realistic targets in collaboration with industry, ensure implementation through the
       allocation of discretionary grants and monitor delivery of Service Level Agreement
       deliverables as a way of addressing sectoral occupational shortages and skills gaps. This will
       prioritise the development of skills that enable 4IR occupations and specialisations. The
       COVID-19 phenomenon has been taken into consideration with regard to the SETA’s strategic
       planning and has been acknowledged as a catalyst for the necessary 4IR related skills
       development
    4. Identify TVETs with the potential for meaningful collaboration and enter into partnerships
       with them. These partnerships will recognise some of the TVETs as Centres of Specialisation,
       linking them with industry and ensuring that programmes offered are aligned to identified
       skills gaps for ease of learner placement on programmes such as WIL.
    5. Scope skills development needs and priorities in rural areas, provide career and vocational
       guidance, support government in addressing e-governance issues and assist aspirant training
       providers to attain accreditation and deliver MICT SETA programmes. The SETA will support
       initiatives which apply technology in a manner that enables transformation of the Sector, with
       regards to female learners, learners with disabilities and rural learners. The development of
       skills related to 4IR can contribute to assisting learners with disabilities, for instance, through
       the development of teaching aids.
    6. Improve provision of skills development to SMMEs, entrepreneurs and community-based
       organisations, particularly with regard to 4IR. This will enable the development and
       commercialisation of technologies and products that improve localisation and increase
       exports. The SETA will develop cross-sectoral partnerships and projects in the delivery of
       learning interventions. These partnerships are especially important now during the COVID-19
       phenomenon (the impact of which will outlast the pandemic) as SMMEs are in a more
       vulnerable position attempting to keep up with 4IR trends and technology in order to stay
       relevant in the current MICT Sector environment.
    7. Identify and develop occupational qualifications through the QCTO for occupations in high
       demand in consultation with the Sector. Furthermore, the SETA will put in place mechanisms
       to prioritise 4IR related qualifications and ensure increased number of accredited skills
       development providers offering occupational qualifications in high demand on an annual
       basis.

The rest of the SSP follows with more details on the salient points captured in this Executive Summary.
We trust it will serve as an influential guide on the Sector and inform relevant, cutting-edge
interventions to move the Sector-and the country-forward.

Mr. Mdu Zakwe
CEO: MICT SETA

v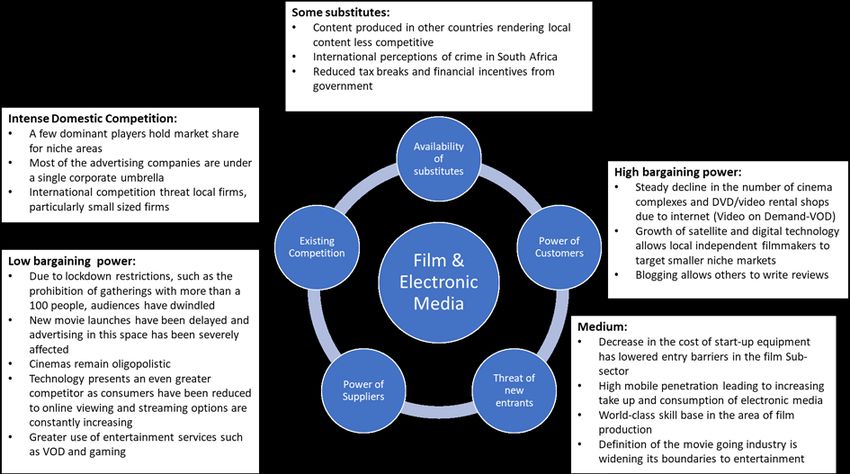
Table of Contents
Foreword ......................................................................................................................... ii
Acronyms ........................................................................................................................ iii
Executive Summary ......................................................................................................... iv
List of Figures ................................................................................................................ viii
List of Tables ................................................................................................................... ix
SSP Research Process and Methods .................................................................................. 1
Chapter 1: Sector Profile .................................................................................................. 3
  1.1     Introduction................................................................................................................. 3
  1.2     Scope of Coverage ....................................................................................................... 3
  1.3     Key Role Players .......................................................................................................... 4
  1.4     Economic Performance ............................................................................................... 6
  1.4.1 Impact of COVID-19 .................................................................................................... 7
  1.4.2 Advertising .................................................................................................................. 8
  1.4.3 Film and Electronic Media .......................................................................................... 9
  1.4.4 Electronics ................................................................................................................. 10
  1.4.5 Information Technology (IT) ..................................................................................... 11
  1.4.6 Telecommunications................................................................................................. 11
  1.5     Employer Profile ........................................................................................................ 12
  1.6     Labour Market Profile ............................................................................................... 13
  1.6.1 Employment Trends Across Employers in the Industry............................................ 14
  1.6.2 Employee Geographic Distribution........................................................................... 14
  1.6.3 Race and Gender Profiles.......................................................................................... 15
  1.6.4 Disability and Age Profiles ........................................................................................ 16
  1.6.5 Occupational Segmentation ..................................................................................... 16
  1.7     Conclusion ................................................................................................................. 17
Chapter 2: Key Skills Change Drivers............................................................................... 18
  2.1     Introduction............................................................................................................... 18
  2.2     Factors Affecting Skills Demand and Supply ............................................................. 18
  2.2.1 4IR Technologies as Change Drivers ......................................................................... 19
  2.2.1.1 Artificial Intelligence ................................................................................................. 19
  2.2.1.2 Cloud Computing ...................................................................................................... 19
  2.2.1.3 Big Data Analytics ..................................................................................................... 20
  2.2.1.4 5G .............................................................................................................................. 20
  2.2.1.5 Internet of Things (IoT) ............................................................................................. 20
  2.3     Skills Implications of Change Drivers......................................................................... 21
  2.4     Policy Frameworks Affecting Skills Demand and Supply .......................................... 21
  2.5     Conclusion ................................................................................................................. 22
Chapter 3: Occupational Shortages and Skills Gaps ......................................................... 23
  3.1     Introduction............................................................................................................... 23
  3.2     Sectoral Occupational Demand................................................................................. 23
  3.2.1 Advertising Sub-sector Occupations with Hard to Fill Vacancies ............................. 23
  3.2.2 Film and Electronic Media Sub-sector Occupations with Hard to Fill Vacancies ..... 24
  3.2.3 Electronics, Information Technology and Telecommunications (ICT) Sub-sectors
  Occupations with Hard to Fill Vacancies ............................................................................... 24
  3.3     Skills Gaps .................................................................................................................. 25

vi
3.4    Extent and Nature of Supply ..................................................................................... 26
  3.4.1 MICT SETA Accredited Qualifications ....................................................................... 27
  3.4.2 Qualifications Under Development .......................................................................... 29
  3.4.3 Higher Education ...................................................................................................... 29
  3.4.4 TVET Colleges ............................................................................................................ 31
  3.4.5 Vendor Programmes ................................................................................................. 32
  3.5    Sectoral Priority Occupations .................................................................................... 34
  3.6    Conclusion ................................................................................................................. 38
Chapter 4: SETA Partnerships ......................................................................................... 39
  4.1    Introduction............................................................................................................... 39
  4.2    An Analysis of Existing SETA Partnerships................................................................. 39
  4.2.1 Partnerships for Special Priorities............................................................................. 40
  4.3    Planned Partnerships ................................................................................................ 43
  4.4    Conclusion ................................................................................................................. 43
Chapter 5: SETA Monitoring and Evaluation ................................................................... 44
  5.1    Introduction............................................................................................................... 44
  5.2    Sector Skills Planning Reflections ............................................................................ 44
  5.2.1 SETA’s Approach to Monitoring and Evaluation....................................................... 44
  5.2.2 Monitoring and Evaluation Data to Support Research and Planning....................... 46
  5.2.3 Extent to Which Previous Strategic Priorities Were Addressed ............................... 46
  5.3    Plan of Action............................................................................................................ 48
  5.3.1 Mechanisms That Need to be Placed to Address Key Strategic Priority Areas ........ 48
  5.3.2 Measures to Ensure Current Priorities are achieved .............................................. 48
  5.4    Conclusion ................................................................................................................. 48
Chapter 6: Strategic Skills Priority Actions ...................................................................... 49
  6.1    Introduction............................................................................................................... 49
  6.2    Key Skills Findings from Previous Chapters............................................................... 49
  6.3    Recommended Priority Actions ................................................................................ 50
  6.4    Measures Planned to Support National Strategies and Plans .................................. 52
  6.5    Conclusion ................................................................................................................. 53
Bibliography ................................................................................................................... 54

vii
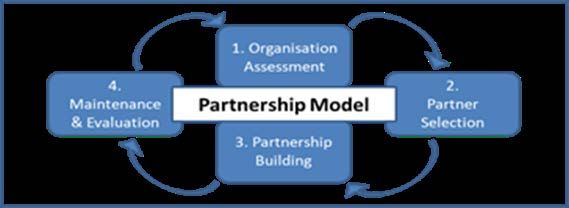
List of Figures
Figure 1: Sector Contribution to GDP ........................................................................................ 6
Figure 2: COVID-19 Impact on MICT Sector ............................................................................... 8
Figure 3: Advertising Porter’s Analysis ...................................................................................... 9
Figure 4: Film and Electronic Media Porter’s Analysis............................................................. 10
Figure 5: Electronics Porter’s Analysis ..................................................................................... 10
Figure 6: Information Technology Porter’s Analysis ................................................................ 11
Figure 7: Telecommunications Porter’s Analysis ..................................................................... 12
Figure 8: MICT Sector of Employers per Sub-sector ................................................................ 12
Figure 9: Employment in the MICT Sector ............................................................................... 14
Figure 10: Number of Employees by Sub-sector ..................................................................... 14
Figure 11: Employee Geographic Distribution ......................................................................... 15
Figure 12: Race and Gender Profiles of Employees ................................................................. 15
Figure 13: Disability and Age Profiles of Employees................................................................ 16
Figure 14: Occupations by OFO major Groups ........................................................................ 17
Figure 15: 4IR Technologies as Change Drivers ....................................................................... 18
Figure 16: Top 5 Qualifications enrolled for ............................................................................ 27
Figure 17: Learnerships & Skills Programmes Enrolment 2017-2019 ..................................... 28
Figure 18: Learnerships & Skills Programmes Completions 2017-2019 .................................. 28
Figure 19: Graduations for 2018 in public HEIs by major field of study .................................. 30
Figure 20: Number of students enrolled in TVET colleges, 2016 to 2018 ............................... 31
Figure 21: SETA Partnership Model ......................................................................................... 42
Figure 22: MICT SETA’s Approach to Monitoring and Evaluation ........................................... 45
Figure 23:Risk Informed Monitoring and Evaluation Plan ....................................................... 48

viii
List of Tables
Table 1: The MICT SETA SIC Code List ........................................................................................ 3
Table 2: Key role players in the MICT Sector ............................................................................. 4
Table 3: MICT Sector Size of Employers per Sub-sector .......................................................... 13
Table 4: MICT Sector Size of Employers Per Province ............................................................. 13
Table 5: Race Profile by OFO Major Group .............................................................................. 16
Table 6: MICT Sector Policy interventions ............................................................................... 21
Table 7: Advertising Hard to Fill Vacancies .............................................................................. 23
Table 8: Film and Electronic Media Hard to Fill Vacancies ...................................................... 24
Table 9: ICT Occupations with Hard to Fill Vacancies .............................................................. 24
Table 10: Skills gaps and the top occupations that they apply to ........................................... 25
Table 11: Enrolments in public HEIs by major field of study ................................................... 29
Table 12: Enrolments in Private HEIs by NQF Field ................................................................. 30
Table 13: Possible Qualifications mapped to Occupations ..................................................... 33
Table 14: Top 10 Sectoral Priority Occupations List for the MICT Sector ............................... 35
Table 15: Partnership with TVET Colleges ............................................................................... 39
Table 16: Partnership with Universities ................................................................................... 40
Table 17: Special Project Partnerships..................................................................................... 40
Table 18: Partnerships with SMMEs ........................................................................................ 41
Table 19: Partnerships with Industry Vendors to Map Qualifications .................................... 41
Table 20: Partnerships with Research Institutions .................................................................. 42
Table 21: MICT SETA’s Planned Partnerships .......................................................................... 43
Table 22: Data Used by Three Core Divisions .......................................................................... 46
Table 23: Status of Implementation of Strategic Priority Areas for 2019 ............................... 46
Table 24: Recommended Priority Actions ............................................................................... 50
Table 25: MICT SETA’s Efforts to Support National Strategies and Plans ............................... 53

ix
SSP Research Process and Methods
In producing this SSP a mixed-method approach that included quantitative and qualitative research methods was adopted. In addition, data is triangulated
across various sources (i.e. verified), thus, in the resultant SSP, ensuring a scientifically sound and accurate depiction of the Sector and its needs. The process
begins with the collection of WSPs/ATRs from employers. These are then analysed to extract key trends, examples of which are the top hard to fill vacancies
and skills gaps as reported by the largest number of employers. From this analysis, the data is distilled into shorter lists that are validated first in the surveys,
then in the interviews and, finally, in the focus groups-with each iteration producing a progressively shorter and more accurate list. Thus, the SETA follows a
process of multi-layered verification and triangulation, ensuring a thoroughly tested view of the final insights.
The following are some of the research methods that have been adopted by the MICT SETA to inform the development of the SSP.

 Topic          Nature (Design)   Objectives of Study                    Data Collection Tool       Sample Size and Scope            Data Sources and           Time
                of the Study                                                                                                         Data Sets                 Frame

 Stakeholder    Qualitative       The objectives of these interviews     • Interview               • The scope of the interviews     • MICT SETA Levy          2020
 Interviews                       are to get an understanding of key       questionnaire             was employers, industry           Huge File
                                  developments in the Sector and                                     associations, research          • Key role players list
                                  gather insights regarding hard to fill                             institutions and trade unions
                                  vacancies, skills gaps, future skills                            • 35 interviews were
                                  and change drivers in the MICT                                     conducted
                                  Sector. In addition, consultations had
                                  a special focus on the impact of the
                                  Fourth Industrial Revolution (4IR)
                                  and COVID-19. This study covers the
                                  views of various stakeholders across
                                  all the Sub-sectors of the MICT
                                  Sector.

 Stakeholder    Quantitative       • The goal of this survey was to     • Survey                   • The scope of the survey was     • MICT SETA Levy          2020
 Survey         and Qualitative      assess stakeholders’ opinions on                                employers, industry               Huge File
                                     developments and skills                                         associations, research          • MICT SETA Training
                                     requirements in the Sector. The                                 institutions, training            Provider List
                                     survey focussed on skills needs                                 providers and trade unions      • Key role players list
                                     and the impact of 4IR and COVID-                              • 411 Surveys were conducted
                                     19.

1
Topic Nature (Design) Objectives of Study Data Collection Tool Sample Size and Scope Data Sources and Time
of the Study Data Sets Frame
• The survey also sought to validate
the findings from the WSP
submissions with regards to hard
to fill vacancies and skills gaps.
Employer Qualitative The objectives of these group • Focus group guide • 6 focus groups sessions were • MICT SETA Levy 2020
and Industry discussions are to test the findings of • Structured discussion conducted: one for each of Huge File
Association the draft SSP regarding hard to fill with employers and the five Sub-sectors (IT,
Focus vacancies, skills gaps, future skills Industry Associations. Telecommunications,
Groups and change drivers in the MICT Electronics, Film & Electronic
Sector. This study covers the views of Media, and Advertising) and
small to large employers and an additional focus group
industry associations across all the with an industry chamber of
Sub-sectors of the MICT Sector. SMMEs
• Overall, 70 stakeholders
attended across the 6 focus
groups
MICT SETA Quantitative The objective of the survey was to • Survey • The scope of the survey was • MICT SETA Levy 2020
COVID-19 and Qualitative ascertain the impact of the COVID-19 employers and training Huge File
Pulse Survey pandemic on the Sector and providers • MICT SETA Training
employers’ states of readiness to • The sample size reached was Provider List
resume learning programmes and 65
business operations given the
lockdown imposed at that time.
Conclusion
The MICT SETA utilises various research outputs to compile the SSP. This approach enables the SETA to produce a plan that is detailed and informed by data
and yet written in a language that is clear and simple; which can be understood by multiple stakeholders who use the SSP as a source. For the preparation of
this SSP in 2020, the MICT SETA benefitted from receiving feedback from DHET on the past submission, which provided key guidelines, especially on Chapter
5. Given that the SSP is made up of multiple research sources and a combination of methodologies, the process may take up to four months to complete. A
bibliography of sources is provided at the end of the SSP with the specific details of the sources that were utilised in the preparation of the SSP.
2Chapter 1: Sector Profile
1.1 Introduction
This chapter presents and profiles the shape and size of the Media, Information and Communication
Technologies (MICT) Sector including its scope of coverage and key role players, economic
performance, employer profile and labour market profile. It also provides an economic trend analysis
and projection of how the economy of the Sector may unfold, the potential impact of COVID-19 and
concludes with implications for skills development. In profiling the five Sub-sectors of the MICT Sector,
research data from multiple sources, including publicly available literature and MICT SETA databases,
were analysed.
1.2 Scope of Coverage
The MICT Sector is made up of five Sub-sectors that are interrelated but also quite distinct and
identifiable. These are advertising, film and electronic media, electronics, information technology and
telecommunications.
The Department of Higher Education and Training, under section 9(1) of the Skills Development Act
(Act No. 97 of 1998), as amended, re-established the Sector Education and Training Authorities (SETAs)
within a new SETA landscape from 1 April 2020 to 31 March 2030. The Standard Industry Classification
(SIC) codes that demarcate the MICT Sector, shown in the table below, fall under four different sub-
industries, namely: (1) manufacturing; (2) transport, storage and communication; (3) finance,
insurance, real estate and business services; and (4) community, social and personal services.
Table 1: The MICT SETA SIC Code List
Sub-sector SIC Code Main Activity Description
Advertising 88310 Advertising
88311 Activities of Advertising Agents
88313 Commercial Design
Film and 96110 Motion Picture and Video Production and Distribution
Electronic Media 96112 Related Activities - Film and Tape Renting to Other Industries, Booking, Delivery and Storage
96113 Film and Video Reproduction
96132 Production and Broadcast of Radio and Television Broadcast Content
96200 News Agency Activities
88940 Photographic Activities
Electronics 35791 Manufacture of Alarm Systems
75216 Security Systems Services Except Locksmiths
75217 Office Automation, Office Machinery and Equipment Rental Leasing Including Installation and
Maintenance
86004 Electronic and Precision Equipment/ Computer Repairs and Maintenance
86010 Consumer Electronics Repair and Maintenance
86013 Other Electronic and Precision Equipment Repair and Maintenance
86014 Repair and Maintenance of Electronic Marine Equipment
87142 Research and Development of Electronic Equipment and Systems
87143 Information Technology Import and Product Integration of Pre-Manufactured Electronics IT and
Telecommunications Equipment
87146 Research and Development in The Physical and Engineering Sciences
87147 Electronics Importation and Product Integration of Pre-Manufactured Electronics IT and
Telecommunications Equipment
96133 Installation, Maintenance and Repair of Tracking Devices for Cars
Information 86001 Software Publishers
Technology 86002 Computer Systems Design and Related Services
86003 Computer Facilities Management Services
86005 Computer Rental and Leasing
86006 Computer Programming Services
86007 Other Computer Related Activities
86008 Call Centre and Customer Relationship Management Systems Development and Installations
Activities
86009 Computer System Design Services and Integrated Solutions
3Sub-sector SIC Code Main Activity Description
86011 Computer and Office Machine Repair, Maintenance and Support Services
Tele- 75200 Telecommunication
communications 75201 Wired Telecommunications Carriers
75202 Television and Radio Signal Distribution
75203 Cable Networks and Programme Distribution
75204 Telephone
75205 Wireless Telecommunications Carriers except Satellite Radio Telephone
75209 Television Broadcasting
75211 Telecommunications and Wired Telecommunication Carriers
75212 Paging
75213 Cellular and Other Wireless Telecommunications
75214 Satellite Telecommunications
75215 Other Telecommunications
86012 Communication Equipment Repair and Maintenance
87148 Telecommunications Importation and Product Integration of Pre-Manufactured Electronics IT and
Telecommunications Equipment
96131 Providing Radio and Television Transmission Signals
Source: Government Notice, No. 42589, Government Gazette, 22 July 2019
While the MICT SETA works with employers located in the Sector to develop skills, most of the skills
needs, particularly ICT skills, are required throughout the economy. The SETA needs to consider this
when conducting research into the demand and supply of skills. Though the MICT Sub-sectors are
wide-ranging, they are nevertheless interconnected. The Sector can be disaggregated into Information
and Communication Technologies (ICT) producing activities and ICT using activities. It is located on the
convergence between content, commerce, community and the tools that support them.
1.3 Key Role Players
The key stakeholders that contribute to the Sector policy and regulatory environment include industry
and employer bodies, professional bodies, and state organs. The Department of Communications &
Digital Technologies (DCDT) is the key government department that has links with the work of the
Sector. Professional associations advance professional learning and continuous development amongst
professionals in the Sector, whilst there are several trade unions representing the interests and rights
of workers within the Sector. Some of the key role players are listed in the table below.
Table 2: Key role players in the MICT Sector
Stakeholder Role
Association for ACASA is the official representative body of South Africa's advertising and communications
Communication and profession. It works with national and provincial government to promote agency and
Advertising South industry transformation and is committed to the discovery and development of new talent
Africa (ACASA) through corporate social responsibility programmes. In relation to outcome 4.2 of the NSDP,
ACASA trains for the advertising agencies and places people within the industry. Currently
it has proposed a partnership with the MICT SETA on a 3-year learning programme.
Media Development MDDA is a statutory development agency for promoting and ensuring media development
and Diversity Agency and diversity. It is a partnership between the South African Government and major print and
(MDDA) broadcasting companies to assist in, amongst others, developing community and small
commercial media in South Africa. It responds to NSDP outcome 4.2 by funding projects in
historically disadvantaged communities or inadequately served communities. It has
partnered with key stakeholders such as Sentech and SEDA with the objective of strengthening
co-operation between the parties, specifically with respect to the growth and sustainability of
enhanced media diversity and delivery. The partnerships are about mentoring small enterprises,
transferring skills on a wider scale, for the general skills upliftment of communities.
Southern African SACIA is a non-profit organisation registered as a Section 21 company in South Africa. It is
Communications specifically designed to promote the adoption of professional standards and ethical business
Industries Association practice in the communications industry throughout Southern Africa. It seeks to further the
(SACIA) interests of members through partnership and representation on a range of issues. Primary
activities include Market Research & Intelligence Services, Networking activities, and the
development of training and skills development programmes. SACIA’s activities respond to
outcome 4.2 of the NSDP.
4Stakeholder Role
Institute of IITPSA actively engages with commerce, industry, and government in order to influence
Information policy formulation on behalf of both its own members and other stakeholders. The Society
Technology also encourages the growth of professionalism and the responsible and professional use of
Professionals South Information and Communications Technology throughout the South African economy. The
Africa (IITPSA) IITPSA responds to the NSDP outcome 4.2 by working together with other interested
stakeholders to accredit university programmes with computing content at South African
Universities. It also has a “Computer Professional Education Programme” that it offers
online at Masters Degree level.
Information Technology The ITA stands at the threshold of a new era for the local ICT Industry, with its Membership
Association (ITA) and industry partners, it positions itself to play a crucial role in the growth and development
of the ICT Sector, as well as serving as a credible, effective channel of communication
between various stakeholders. One of the functions of the ITA is lobbying and negotiating
at government level on behalf of its members. Members have the opportunity of influencing
the South African legislative mechanism through verbal and written submissions by the ITA.
This has far reaching effects, which go beyond its members and positively impact the ICT
industry of South Africa as a whole. ITA responds to NSDP outcome 4.2 through learning
programmes in partnership with the MICT SETA, Microsoft SA, Siemens, SAP, Axiz, and IBM.
ITA is in partnership with the DCDT, DPSA, GITOC and SITA. These partnerships are about
building an ongoing digital government skills programme, which covers foundational digital
skills (such as computer user skills) and advanced skills (such as data analytics skills).
State Information State Information Technology Agency (SITA) is an organisation that was established in 1999 to play
Technology Agency the role of consolidating and coordinating the State’s information technology resources in order
(SITA) to achieve cost savings through scale, increase delivery capabilities and enhance interoperability.
Currently responds to the NSDP outcome 4.2 through IT learnerships programmes which also
cover individuals with disabilities.
Department of DCDT partners with universities and other partners such as IITPSA, ITA, ICASA and other
Communications & relevant industry professional bodies to develop ICT policies and legislations that advance
Digital Technologies the South African economy. The department has special partnerships with, amongst others,
(DCDT) civil society organisations, particularly those that have a major interest in skills building and
achieving race, gender and disability equity. Through its activities it responds to NSDP
outcome 4.2.
National Association The NAB is a non-profit group of organisations and individuals working in broadcasting and
of Broadcasters (NAB) related industries. The NAB assists with industry regulation and is grounded in the principles
of democracy, diversity and freedom of expression. In response to NSDP outcome 4.2, it has
offered internships in the past in fields such as digital marketing and continues to do so in
response to changing environment cause by 4IR technologies.
Government GITOC is a body made up of Chief Information Officers of government departments across
Information South Africa. It aims to discuss issues of mutual interest and mainstream excellence in
Technology Officers information technology across the public service. One of the main programmes of GITOC is
Council (GITOC) free open access software (FOSS), which they intend to implement across government. As
the ICT oversight body of government, it aims to respond to outcome 4.2 of the NSDP by
introducing ICT curriculum at the National School of Government which will uplift and align
strategic ICT pillars that are required as knowledge for Government Officials on matters
pertaining to Big Data, Government, and Cybersecurity.
Information and The ICT SMME Chamber is recognised for its importance and centrality in South Africa’s
Communication development framework, the National Development Plan, and numerous supporting policy
Technologies SMME documents of the South African government. It plays a critical role in engaging with
Chamber (ICT SMME government and other ICT stakeholders, and in lobbying government on behalf of the ICT
Chamber) SMMEs on all matters of ICT SMME development and ICT Sector transformation. It responds
to NSD outcome 4.6 on entrepreneurship and cooperative development, through a
partnership with the Technology Innovation Agency (TIA). The Chamber supports the
development of technologies from proof of concept, product prototyping, and, ultimately,
demonstration of the product in an operating environment.
Universal Service and USAASA is a State Owned Entity of government established through the Electronic
Access Agency of Communications Act, No 36 of 2005, to ensure that “every man, woman and child whether
South Africa (USAASA) living in the remote areas of the Kalahari or urban areas of Gauteng can be able to connect,
speak, explore and study using ICT.” In providing crucial infrastructure to rural communities
and educational institutions, USAASA contributes to realising NSDP outcomes 4.2 and 4.5.
51.4 Economic Performance
The Media, Information and Communication Technologies (MICT) Sector is crucial to economic
development. Although the MICT Sector is characterised by rapid technological change, research
points to sluggish economic growth for the Sector. A key driver for the sluggish economic growth is
the impact from the COVID-19 pandemic, described further in section 1.4.1. Additional factors are
examined in sub-sections 1.4.2 to 1.4.6.
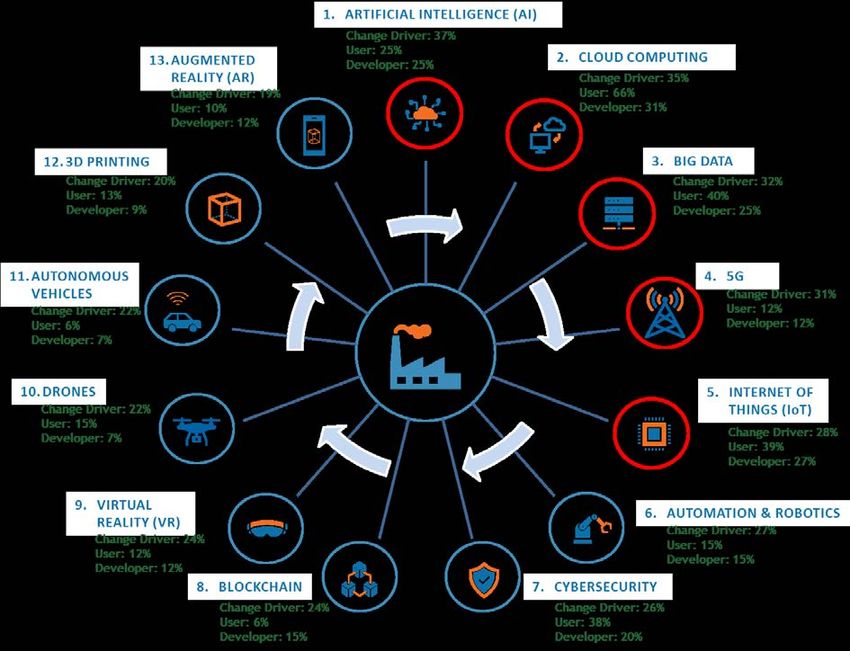
The Fourth Industrial Revolution (4IR) has brought forward new technologies such as Artificial
Intelligence, Cloud Computing, Virtual and Augmented Reality and the Internet of Things, amongst
others. While there is still uncertainty on the exact impacts of such 4IR technologies on the economy
and society, it is certain that they have already and will continue to result in profound and rapid change
(Penprase, 2018). The MICT Sector is, therefore, urged to swiftly adapt to these changes and make
considerable efforts in their adoption. These technological advancements mean that business models
and government decisions, amongst others, will have to transform and adapt due to a new set of
opportunities, challenges and uncertainties in the environment (ICASA, 2020). These new and
emerging technologies will require a significant amount of skills development in the MICT Sector so
that businesses, individuals and other stakeholders are able to utilise and benefit from such
technological advancements.
Figure 1 below illustrates each Sector’s contribution to GDP growth in the first quarter of 2020 and
last quarter of 2019. In 2019 Q4, the Transport, Storage and Communications Sector was the worst
performing, relative to other Sectors. In 2020 Q1 the Sector’s relative contribution to growth shifted
to the top half (ranking 4th out of the 10 Sectors).
Figure 1: Sector Contribution to GDP
Transport, Storage and Communication 0.0%
-0.6%
Trade, Catering and Accommodation -0.2%
-0.5%
Personal Services 0.0%
0.0%
Mining and Quarrying -1.7% 0.1%
Manufacturing -1.1%
-0.2%
Q1: 2020
Government Services 0.1%
-0.1% Q4: 2019
Finance, Real Estate and Business Services 0.8%
0.6%
Electricity, Gas and Water -0.1%
-0.1%
Construction -0.2%
-0.2%
Agriculture, Forestry & Fishing 0.5%
-0.2%
-2% -1% 0% 1% 2%
Source: Gross Domestic Product (GDP), 1st Quarter 2020 (StatsSA)
Following an increase of 0,8% in 2018, the South African annual real GDP increased by only 0,2% in
2019, the lowest reading since 2009 when the economy contracted by 1,5% (StatsSA, 2020).
The economic performance in the MICT SETA Sectors are briefly discussed below:
– South Africa’s total ICT Sector is expected to reach R393 billion ($26.4 billion) in 2020, growing by
2.5% from 2019 (ICASA, 2020). This shows a compound annual growth rate (CAGR) of 25% over
the last five years (IDC, 2020).
– The negative impact of COVID-19 on the ICT Sector in South Africa, particularly the
telecommunications and IT Sub-sectors, in comparison to other Sectors, is considerably lower.
– The South African content production industry is valued at an estimated R5.5 billion ($800 million)
a year and the film and electronic media is forecasted to grow by 4,0% in 2020 ( (Gauteng Film
Commision, 2019) (PWC, 2018).
– Total broadcasting services revenue increased by 3.8% from over R36.9 billion in 2018 to over
R38.3 billion in 2019. Revenue from subscriptions increased by 7% in 2019, however advertising
6and informational decreased by 11.4% and 21.8%, respectively between 2018 and 2019 (ICASA,
2020).
– Advertising revenue in South Africa increased by 2.8% in 2018 to a total of R29.5 billion, with a
projected CAGR of 3,4% to a total of R34.9 billion in 2023 (PwC, 2019). In 2019, total advertising
market in South Africa grew to an estimated R30.4 billion (Statista, 2019).
– In 2018, the country’s entertainment and media market, comprising of consumer and advertiser
spend, increased by 7.1% year-on-year from R120.4 billion to R128.9 billion. It is projected for the
5-year period ending 2023 this figure will increase at a 5.8% CAGR to R170.5 billion (PwC, 2019).
– Consumer Electronics revenue is expected to show an annual growth rate of 5.4% from 2020-
2024. User penetration is currently estimated to be 23.2% in 2020 and is projected to hit 32% by
2024 (Statista, 2020).
– Over the period 2015-2018, the total telecommunications revenue increased by 6.4%. In 2019
alone, this revenue increased by 3.6% to R194.2 billion (ICASA, 2020).
Further analysis of the impact of COVID-19 and economic performance of each MICT Sub-sector is
provided in the sections that follow.
1.4.1 Impact of COVID-19
The current COVID-19 pandemic has significantly disrupted many economies around the world. In an
effort to contain the pandemic and minimise its impact on the country, the South African government
declared a National State of Disaster and enforced a national lockdown, which has significantly
impacted South African society in the social, economic, health, environmental, and technological
realms. The restrictions of movement and economic activities under the new regulations resulted in a
significant halt in the South African economy, which was already in a technical recession from the
fourth quarter of 2019 (Sekyere, et al., 2020). The National Treasury had estimated economic growth
of 0.9% in 2020, rising to 1.3% in 2021 and 1.6% in 2022 (National Treasury, 2020). However, due to
the COVID-19 pandemic which hit the country in March 2020, these estimates have been drastically
revised. The South African Reserve Bank expects GDP to contract by 6.1% in 2020 as a result of the
pandemic, as compared to the 0.2% previously predicted, which is worse than during the 2008–2009
financial crisis. The Bank expects GDP to recover in following years, with an expected growth of 2.2%
in 2021 and 2.7% in 2022. In addition to this, the South African Rand has seen a significant depreciation
(Mboweni, 2020).
The South African ICT Sector is one of the most powerful tools available during the COVID-19 pandemic
(Mthembu, 2020). Thus, the negative impact on the MICT Sub-sectors is expected to be considerably
less than other Sectors of the South African economy. There is high demand for up to date and
accurate medical information, statistics, as well as information on new government regulations, to
inform all South Africans about the pandemic. Some telecommunications service providers responded
speedily in providing solutions to assist the country’s response to the pandemic, such as the provision
of zero-rated services for health and educational purposes. Telecommunications companies have also
worked alongside government to assist in tracing and tracking those who have been exposed to
COVID-19 patients, using geolocation solutions, without infringing on the privacy and human rights of
South African citizens (Mthembu, 2020).
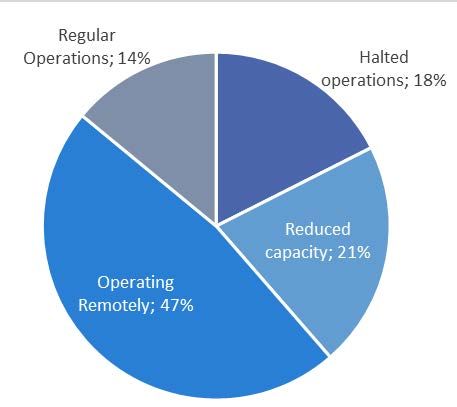
MICT SETA conducted a pulse survey regarding the impact of COVID-19 on the enterprises in the MICT
Sector. As shown in Figure 2 below, 18% of businesses in the Sector have halted operations, and 21%
have had to reduce their operational capacity. Almost half (47%) have been able to continue operating
remotely. 42% of businesses in the Sector indicated that they expect that their business will take up
to a year to recover from the impact of COVID-19, and 5% of businesses indicated that they will never
recover from this impact. Furthermore, three quarters (75%) of businesses’ workforce numbers have
changed due to COVID-19.
7Figure 2: COVID-19 Impact on MICT Sector
Current Operating Status Expectations for Business Recovery
Source: MICT SETA COVID-19 Pulse Survey, 2020
1.4.2 Advertising
In 2019, the total advertising market in South Africa grew to an estimated R30.4 billion. TV and video
advertising spending are estimated to account for the largest share (approximately 21%), with internet
said to be the second largest (Statista, 2019). However, according to the 2018 to 2023 compound
growth rates, TV’s 1.8% CAGR in this period will be surpassed by internet’s 12.4% CAGR, meaning that
by the end of 2023, internet advertising will replace TV advertising as the key advertising contributor
for the first time. At the same time, mobile will represent 50% of internet advertising revenue, an
increase of 40% from 2018. These figures illustrate the importance of mobile platforms in the
development of South Africa’s advertising industry (Statista, 2019).
Newspaper advertising is expected to consistently experience year-on-year falls from 2019 to 2023.
Much of the rise in internet advertising revenue, excluding Google and Facebook, is due to lower
quality content that is often user-generated. This is often significantly more revenue generating than
expensive, high quality content. Many media owners have responded to the opportunities and
challenges associated with the monetisation of more content through digital ads. Social media
platforms remain a significant driving force in internet advertising, mainly due to their reach and ability
to target users more intensely (PwC, 2019). These forms of digital advertising are likely to become
significantly more popular amongst advertising agencies in light of the spike in at-home media
consumption and increased use of social media platforms during the COVID-19 pandemic.
Furthermore, businesses that are closed under lockdown will generate less revenue and therefore
spend less on advertising.
The following diagram presents a Porter’s Analysis of competition in the advertising Sub-sector.
8Figure 3: Advertising Porter’s Analysis 1.4.3 Film and Electronic Media South Africa is a leader in film production, satellite distribution and interactive content, with more content consumed in the country than anywhere else in Africa. The film industry has the potential to generate significant returns for the country in which the films get shot. The production of a popular film can make a nation an ideal tourist destination as well as increase investment into the economy. The South African content production industry is valued at an estimated R5.5 billion a year. Total revenue in the film Sector, including box office and cinema advertising, amounted to R1.8 billion in 2018 and is expected to grow at a 2.7% CAGR to R2 billion by 2023. Box office revenue increased by 11.5% in 2018 to R1.3 billion, with an estimated projection of R1.5 billion by 2023. Cinema advertising is expected to grow slightly quicker than box office. In 2018, cinema revenue sat at R428 million and is expected to rise to R543 million by 2023, accounting for 27% of overall revenue (PwC, 2019). In 2018, South Africa had a total of 765 screens across the country, which is projected to rise to 785 screens by 2023. Social distancing due to COVID-19 has led to a spike in at-home media consumption as well as a growth in news broadcasting numbers as South Africans turn to news providers for timely and trusted information on the pandemic (Hall & Li, 2020). However, the limitations in the production of valuable broadcast content, such as live sports, have resulted in a significant decrease in income for advertising and media companies. Film and media outlets, such as playhouses and theatres, will therefore need to avail artists a digital platform to perform live-streaming activities which includes stand-up comedy, poetry sessions and music, amongst others (Mthembu, 2020). This is not only to keep people entertained, but to continue showcase the work of these creatives and promote local content consumption. The following diagram presents a Porter’s Analysis of competition in the Film and Electronic Media Sub-sector. 9
Figure 4: Film and Electronic Media Porter’s Analysis
1.4.4 Electronics
South Africa’s poor economic performance, rising utility prices, weakened currency and increased
costs of living negatively affect the economy, however, despite these challenges consumer electronics
continue to record positive growth rates. The Electronics and Media industry in South Africa consists
of physical media, consumer electronics and communication devices, amongst others (Statista, 2018).
Electronics and media industry revenue is expected to show an annual growth rate (CAGR) of 4.4%
between 2020 and 2024, resulting in a market volume of US$1,307m by 2024.
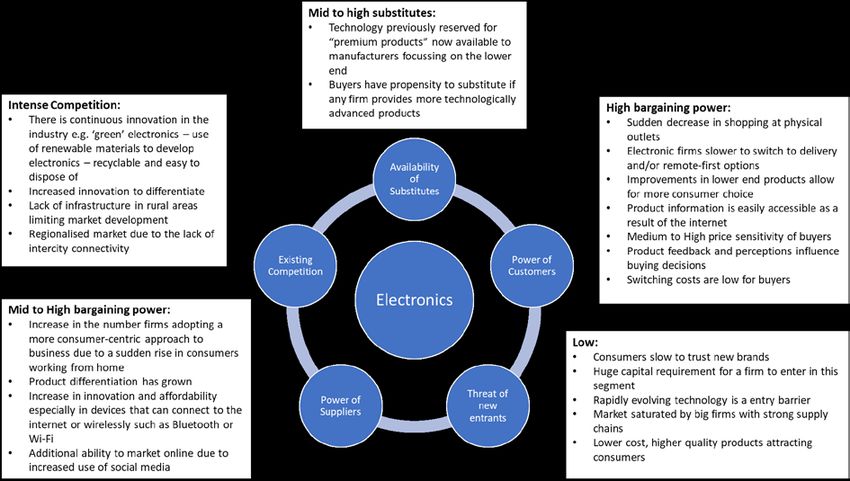
The following diagram presents a Porter’s Analysis of competition in the Electronics Sub-sector.
Figure 5: Electronics Porter’s Analysis
The market's largest segment is Consumer Electronics with a market volume of US$846m in 2020.
Consumer Electronics revenue is expected to show an annual growth rate of 5.4% from 2020 to 2024.
The number of users in the consumer electronics market was estimated at 10.41 million in 2018,
10You can also read