Population Situation Analysis of Nepal - (With Respect to Sustainable Development) - UNFPA Nepal
←
→
Page content transcription
If your browser does not render page correctly, please read the page content below
Population Situation Analysis
of Nepal
(With Respect to Sustainable Development)

UNFPA Nepal
2017
Executive Summary
The year 2014 marked the end of the successful implementation of a 20-year Programme of Action (PoA)
endorsed by the International Conference on Population and Development (ICPD) held in Cairo, Egypt
in 1994. In September 2014, in its resolution 65/234 on the review of the implementation of the PoA of
the ICPD and its follow-up beyond 2014, the General Assembly underscored the need for a systematic,
integrated and comprehensive approach to population and development, one that would respond to new
challenges relevant to population and development and to the changing development environment, as
well as reinforce the integration of the population and development agenda in global processes related
to development1. The findings and conclusions of the operational review suggest a new framework for
population and development beyond 2014 built on five thematic pillars: (i) health; (ii) dignity and human
rights; (iii) place and mobility; (iv) governance and accountability; and (v) sustainability.

At the United Nations Sustainable Development Summit on 25 September 2015, world leaders adopted
the 2030 Agenda for Sustainable Development, which includes a set of 17 Sustainable Development Goals
(SDGs) to tackle pressing global issues by 2030. The Government of Nepal, National Planning Commission
(NPC) produced a national preliminary report in 2015 on the SDGs and is currently refining the targets
and integrating them in national plans. This is expected to guide Nepal in translating SDGs into actions
at all levels, national, regional and local. It contains indicators by goals and their quantitative benchmark
data and targets. In addition, the United Nations Country Team (UNCT) Nepal has completed a Common
Country Assessment (CCA) as part of the formulation of its new United Nations Development Assistance
Framework (UNDAF) for 2018-2022.

Nepal is also aspiring to graduate from the least developed country (LDC) to a middle-income country
by 2030, the SDG indicators set by the government of Nepal will help in achieving these goals. The NPC
has also endorsed a new three year Development Plan, the 14th Plan (2016/17-2018/19), which aims to
incorporate SDG priorities for Nepal.

Against this backdrop, this report on Population Situation Analysis (PSA) of Nepal has been prepared to
provide a sound basis for evidence-based policy dialogue for integrating core population dynamics issues in
the new sustainable development plan of the Government of Nepal to ensure that ‘no one is left behind’. This
report draws on Nepal’s demographic transition and resulting population momentum using key demographic
variables for the next 15 years (2016-2030) in the context of the new federal structure of the country.
Evidence is generated using the five thematic pillars of population and development to inform integration
of key population dynamics issues in national development priorities to harness the demographic dividend
and realize national SDGs.

The major sources of data used in the analysis include: population and housing censuses, demographic
and health surveys, multiple indicator cluster surveys, living standards surveys and relevant management
information systems data. Besides, a wide range of published research and study reports have been reviewed.
Where appropriate the quantitative data and indicators that have been presented are accompanied by
meta-data underpinning the interpretation of the levels and trends implied by the data.

Nepal, like many of the South Asian countries, has been undergoing rapid demographic changes during the
last few decades. In recent years, in Nepal, fertility and mortality have been declining fast. Between 1961
and 2001, the average annual population growth rate was 2.25 percent. Since then, the population rate has
declined. Between 2001 and 2011, the average annual growth rate was 1.35 percent. The low growth during

1   Framework of Actions for the follow-up to the Programme of Action of the International Conference on Population and
    Development Beyond 2014, Report of the Secretary-General, United Nations – Accessed at:  https://www.unfpa.org/
    sites/default/files/pub-pdf/ICPD_beyond2014_EN.pdf

UNFPA Nepal 2017                                                                                                      i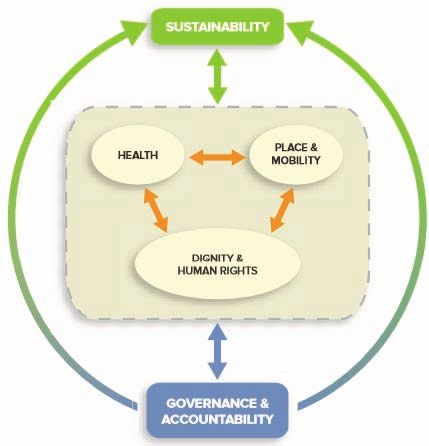
Population Situation Analysis of Nepal

this period is attributable to a large number of the absentee population (estimated at around 1.92 million as
of 2011). It can be expected that many members of the absentee population will return to Nepal when they
retire or otherwise leave the countries where they currently reside. Nepal’s population, estimated at 26.5
million as of 2011, is projected to grow to 30.4 million by 2021 and 33.6 million by 2031 (CBS, 2014).

Nepal’s population is in transition. It is currently in Stage II (death rate and birth rate are low, but death
rate remains slightly higher than birth rate), but fast approaching Stage III (death rate and birth rate are
low). While both the birth and death rates in Nepal are low, the birth rate is still higher than the death rate.
According to data from 2011, the crude birth rate (CBR) is around 24 per 1,000 population but the crude
death rate (CDR) is only around 7 per 1,000 population.

The working age population (between 15 and 64 years of age) has been increasing in Nepal, while the
proportion of the young age population has been declining. In 1991, the working age population was 52.9
percent of the total male population and 55.3 percent of the female population. In 2011, the male working
age population had increased to 57.9 percent and the female working age population had increased to 61.6
percent. The relatively lower proportion of working age men to women is likely attributable to the fact that
many men leave the country for work.

Due to these factors, in Nepal, a demographic dividend has begun. The demographic dividend is the
accelerated economic growth that may result from a decline in a country’s mortality and fertility and the
subsequent change in the age structure of the population. With fewer births each year, a country’s young
dependent population grows smaller in relation to the working-age population. With fewer people in need of
support, a country has a ‘window of opportunity’ for rapid economic growth if the right social and economic
policies developed and investments made2. There is, therefore, a window of opportunity for Nepal to take
advantage of the demographic dividend for economic growth and investment in the youth of the country.

Nepal currently has a historically high young working age population. Therefore, investments in human
development targeting adolescents and youth are critical to ensuring that they have the capabilities and
opportunities to define their futures and to spur the innovations needed for a sustainable future. It is also
necessary to protect their human rights, develop their capabilities, secure their sexual and reproductive
health and reproductive rights, and prepare them for productive and creative activities to boost the potential
economic growth. In addition, Nepal needs to cater for increasing ageing population and pay special attention
to persons with disabilities and indigenous population groups approaching extinction.

Spatial distribution of the population shows an ever declining share of the mountain and hill population
compared to the Terai population. In 1971, the proportion of the total population living in the mountain and
hill regions combined was 62 percent, this declined to 50 percent by 2011. It is projected that by 2031 this
proportion will shrink to 47 percent although the land mass in the mountain and hill regions is 77 percent.
Among the seven federal States, State Three’s share of total population is 21 percent followed by State Two
with 20 percent, States One and Five have 17 percent each, State Seven 10 percent, and State Four nine percent.
The ranking of the projected populations for the seven States remains the same, even until 2031 (CBS, 2014).

The total population of Nepal comprises of over 125 caste/ethnic groups. These can be broadly categorized
into five groups: Chhetri/Bahun, Janajati, Terai castes, Dalit, and Muslim. The largest group is Janajati
(36%), followed by Chhetri/Bahun (31%), Terai castes and Dalit both (14%) and the minority Muslim
(4%).  In four out of seven States the largest group is Janajati, in two States it is Chhetri/Bahun and in one
State it is Terai castes.

2    Source: James Gribble and Jason Bremner. 2012. The Challenges of attaining the demographic dividend. Policy Brief.
     (Washington, DC: Population Reference Bureau, September).

ii                                                                                                UNFPA Nepal 2017
Executive Summary The circumstances in which the average Nepali lives is still far removed from the targets the SDGs seek to achieve. Overall, poverty has declined but it has worsened in the high mountain region and in urban centres. School enrolment for girls has improved substantially but the dropout rate is high, they are victims of early marriage and a structurally patriarchal system. Discrimination toward women and girls is rampant, son preference is high and employment opportunities for females is low. They are often victims of physical and sexual violence. This is high among women and girls in the Terai, among Dalit and women with no education. The sex-selective abortion practice appears to be increasingly evident in some parts of Nepal as 12 of Nepal’s 75 districts, which comprise over 25 percent of the total population, show sex ratio at birth over 110 (per 100 females). The changes in population health over the past three decades are striking and yet aggregate improvements mask inequalities between sexes, among geographic regions, sociocultural groups and wealth quintiles. The persistence of under achieving sexual and reproductive health outcomes among hard to reach population groups underscores the near impossibility of further progress in the realization of health for all persons without sustained attention to strengthening the reach, right, and equity-based, comprehensiveness and quality of health services and systems. In the area of sexual and reproductive health and reproductive rights, Nepal has passed an abortion law and has several policies and programmes in place. However, when it comes to implementing these policies and programmes little is done to ensure the measures are in place and not abused, with the aforementioned sex-selective abortion becoming increasingly evident in some parts of the country. In Nepal, human rights violations against women and girls, including gender-based violence, harmful practices, such as child, early and forced marriage, women’s and girl’s unequal access to education, and women’s unequal access to employment, leadership, and decision-making, constitute major threats to their dignity and well-being. This has a knock on effect to their families and communities, as well as creating barriers to the achievement of inclusive sustainable development. The full realization of gender equality and women’s empowerment is, therefore, imperative. Furthermore, the evidence reviewed herein highlights a growing body of social research demonstrating that stigma, discrimination and violence, and thereby the exclusion of persons from full participation in society, have negative costs that manifest in their physical and mental health and in their potential productivity and achievements. In order to secure the benefits to the development of human creativity, innovation and productivity, greater investment, now and in the future, is required to create more just, non-discriminatory, non-violent societies. For many in Nepal migration is more a necessity than a choice for family or individual survival. Sustainability through security of mobility and place means ending forced migration and supporting people who do want to move. For those who want to remain where they are, it means building better livelihood options and creating social conditions of dignity, equality, and opportunity, in order to decrease push factors. The analysis presented in this report highlights some of the data gaps and measurement challenges for each of the goals of the 2030 Agenda. Given the enormous data need required by the SDGs, Nepal is not currently in a position to produce the data and statistics required for monitoring progress in the attainment of all 17 goals and 169 targets of the 2030 Agenda. Concerted efforts to strengthen the capacity of national statistical systems will be critical to the measurement of progress towards achieving the SDGs, informed decision-making and strong accountability. At the same time, the statistical community will need to develop new methodologies, as currently there are no internationally agreed statistical definitions and guidelines for some indicators. Nepal, therefore, needs to strengthen data collection, analysis, and use. Data is available from population censuses, vital registration systems, routine administrative systems and periodic sample surveys, but importantly, their overall quality must improve. Sample survey data is of comparable standard but it does not capture all types of data the country needs. Vital registration systems UNFPA Nepal 2017 iii
Population Situation Analysis of Nepal

have to be developed and strengthened to allow it to be an alternative source of data for development
planning and monitoring.

The report concludes with a set of broad policy implications for Government of Nepal and relevant
stakeholders of Nepal’s sustainable development.

1.   Prepare for a growing population
     Until 2001, the fertility rate in Nepal was high, but the mortality rate was declining, resulting in a
     moderate rate of population growth. Despite declining fertility and mortality in recent years, Nepal’s
     population, which was 26.5 million as of 2011, is projected to grow to 30.4 million by 2021, and 33.6
     million by 2031. In order to maintain social and economic developments that have so far been achieved,
     and to make greater progress in the years to come, Nepal needs to make preparations to meet the
     challenges arising from this dual situation.

2.   Plan for potential returnee migrants
     Between 1961 and 2001, the average annual population growth rate was above 2 percent. Since then,
     the population rate has declined. Between 2001 and 2011, the growth rate was 1.35 percent. The low
     growth during this period is attributable to the large number of the absentee population; estimated at
     around 1.92 million. It can be expected that many members of the absentee population will return to
     Nepal when they retire or otherwise leave the countries where they currently reside. Nepal, therefore,
     needs to plan for these potential returnee migrants in order to sustain the increased population size.

3.   Make the most of demographic dividend
     Since the demographic dividend has begun in Nepal, with the growth of the working age population
     becoming higher than the growth of total population, Nepal must prioritize investment in education,
     work skills, empowerment, and employment for young people to reap the benefit of the demographic
     dividend.

4.   Introduce policy interventions to retain population in their place of origin
     The analysis of migration data demonstrates that the volume of internal migration to the Terai increased
     in terms of absolute number in every subsequent census. The Terai as a safety valve for the rapidly
     growing population of the highland zone cannot be a long-term solution. The Terai itself is increasingly
     under pressure to accommodate a large number of internal migrants, the growth resulting from its own
     natural increase and apparently increasing immigration. Given the declining job opportunities in foreign
     countries for the Hill emigrants, it has now become necessary to think of plans and programmes that
     can sustain the Mountain and Hill population in their place of birth.

5.   Streamline urbanization
     In 2011 there were 58 municipalities, with the proportion of urban population to the total population at
     17 percent. However, by 2015 this number increased to 2173, resulting in the proportion of the population
     living in municipalities increasing to 42 percent. In order to determine what constitutes a municipality
     and manage expectations, it will be important to have clear criteria in place and apply these consistently.
     The Government of Nepal should continue to promote inclusive and sustainable urbanization, including
     access for all people to adequate, safe and affordable housing, and basic services.

6.   Eradicate poverty uniformly

3    Total number of municipalities and metropolitan cities has increased to 246, as per the latest report of the Government
     of Nepal

iv                                                                                                    UNFPA Nepal 2017
Executive Summary
Poverty levels have decreased over the years in Nepal. However, there are zones, areas, and social
groups where this reduction has not had a significant impact. The poverty reduction programme should
focus on the areas and groups that have not made much progress so far. The initiatives in the areas of
population and development, which began with the ICPD in 1994, should continue. This will contribute
to achieving SDG 1, ending poverty in all its forms everywhere.
7. Provide schooling and a skill learning environment for young girls to avoid early marriage
Despite the Government law of banning early marriage, a sizeable proportion of girls are married early.
This can be reduced by creating a conducive environment to give these girls agency over their own
future and thereby hopefully avoiding early marriage.
8. Empower girls and women to lead a decent life
Provide ample opportunities and freedom to girls and women to live a life of dignity and freedom. Enact
policies and laws to punish any acts that reinforce harmful practices that help to continue or strengthen
harmful practices such as early marriage, dowry, Chhaupadi (isolation of females from their family,
during menstruation), and any other practices that subjugate females.
9. End gender-based violence
Research shows that, in Nepal, about one in five women face physical violence and about one in eight
women face sexual violence throughout their life. The perpetrators are often their intimate partners.
There is therefore a need to ensure strong implementation of laws that penalise the perpetrators,
provide services to support survivors and promote women and girls’ empowerment at all levels.
10. Recognize and address harmful practice of gender-biased sex selection
In Nepal, sex selection and son preference are topics that need to be explored extensively. Some
sources of data show an unnatural rise in SRB in certain areas of Nepal. Sex selection in favour of boys
is a reflection of pervasive socio-cultural and economic injustice and discrimination against women
and girls and may also have significant implications for future population dynamics in the country.
Therefore, this calls for further trend analysis and research to generate evidence to substantiate the
existing knowledge related to the skewed sex ratios at birth.
11. Reduce births to adolescent mothers
Births to adolescent mothers has decreased over the years, however, it remains high at 71 births per
1000 adolescent mothers4. On average, the number is higher (80 births) in rural areas than in urban
areas (33 births), moreover, it varies considerably between regions. As adolescent girls face huge
risks during this period, comprehensive sexuality education as well as sexual and reproductive health
programmes must be geared to these adolescents to ensure that underage pregnancy is reduced.
12. Address the needs of elderly population
With gradually improving health conditions in the country, people are living longer. As of 2011, the
number of people 60 years of age and over was approximately 2.5 million. Social protection programmes
should be designed to address the needs of the increasingly large elderly population.
13. Provide care and support to the disabled
The government has a number of programmes to take care of the disabled, but this is not sufficient.
Over two percent of the total population are disabled; the scale of support needs to be raised.
4 Key indicators from the 2016 DHS were released at the time of publishing of this report. They show an even higher
number of births to adolescent mothers. Subsequent updates of the PSA will reflect the latest estimates.
UNFPA Nepal 2017 vPopulation Situation Analysis of Nepal
14. Mainstream indigenous peoples
In Nepal, there are more than 62 indigenous groups; they should be given opportunities to sustain
their own cultural heritage and be provided opportunities commensurate with full social, political and
economic integration to allow them adequate and equitable access in the prevailing political system.
15. Strengthen social protection system
Specific aspects of social protection systems, relevant to the wellbeing of families and households, such
as increasing efforts to ensure health, education and welfare services, and supporting and assisting
vulnerable families (divorced/separated women), should be prioritized in policies and plans of the
government.
16. Create an environment for all to attain the highest standard of health
Numerous UN and bilateral development agencies have defined a human rights-based approach to
health as one that aims to realize the right to the highest attainable standard of health. The human
rights based approach to health, based on seven key principles: availability, accessibility, acceptability,
quality of facilities and services, participation, equality and non-discrimination, and accountability,
should be adopted and implemented. Efforts must be made in making the provision of services and
underlying social determinants affecting the sexual and reproductive health of women and girls, reflect
the expansion and strengthening of a human rights-based approach to health.
17. Formulate policies and programmes to drastically reduce early age mortality
Despite good gains in early age mortality reductions in Nepal, more efforts are needed to reduce
mortality in the first month of life and sustain healthy life until the child is five years old. Programmes
must be selective in focusing in the areas or communities where early age mortalities are high.
18. Improve nutritional status of children and mothers
Nutritional status of pregnant mothers and new-born children such as height, weight of children,
anaemia, and nutritious food during pregnancy, must be addressed. Special attention should be paid to
young mothers as they are more susceptible to complications during and after pregnancy.
19. Ensure universal access to sexual and reproductive health and reproductive rights (SRH/RR)
Policies are in place to address reproductive health and rights of women, however these policies are
poor in implementation. A strong and robust implementation mechanism must be designed to empower
women to exercise their SRH/RR.
20. Strengthen family planning programme
Data shows that Contraceptive Prevalent Rate (CPR) for modern methods is stagnant. However, the
practice of family planning can contribute to good health and wellbeing of women. Policies should be
made to enable women and men to practice safe family planning methods, while at the same time
unmet need for FP should be addressed.
21. Strengthen governance and accountability
Sustainable development cannot be achieved without evidence-based governance. Effective governance
demands good statistics to monitor progress and to hold leaders accountable for their activities and
achievements. Investing in statistical capacity in demography, public health, human rights, migration,
economic growth, employment, and climate change makes it possible to understand their linkages and
impact on sustainable development, and to shape the policy process.
vi UNFPA Nepal 2017Executive Summary
22. Strengthen disaggregated data collection, analysis, and use, for evidenced based planning and
monitoring at the national and sub-national level
In line with “leaving no one behind” and Nepal’s federal structure, Nepal should ensure adequate
evidence-based measures that allow monitoring of inequality and inequity in access to public services, in
addition to accountability structures and access to information. This evidence gathering should include
sampling that will enable stratification and comparisons by caste and ethnicity, gender, age (including
youth and older persons), persons with disabilities, household wealth, and with greater attention to
spatial circumstances. Especially important is evidence that reflects insecurity of place, such as slums
or informal settlements, among recent migrants and internally displaced and conflict-affected persons.
UNFPA Nepal 2017 viiForeword The youth of Nepal can find themselves both in a vulnerable and advantageous position. With support from family, government, and society, the youth of today can thrive and help build a prosperous and peaceful Nepal. When the youth of Nepal have the advantages of equality, good health, strong education and the ability to decide their own future, then the country as a whole, benefits. This analytical study on Population Situation of Nepal suggests that the time to invest in the youth of Nepal is now. With the window of opportunity open investment must be made to ensure all girls and boys have the chance to develop their skills, find employment, and contribute to economic growth. To capture the demographic dividend, Nepal needs to ensure that the youth of today can secure their reproductive health rights, which they have access to family planning services, creating an environment for girls to have equal opportunities to boys in education, and that decent jobs are created for these skilled individuals to access. Only then can Nepal as a whole utilise the demographic dividend, capturing the window of opportunity promises to transform the failures of Nepal’s youth and ensure no one is left behind. The consequences not to seize upon this opportunity are too great. Therefore, developing policies and sincere investments to secure their future requires governments know the size, sex, location, and age structure of their present and future populations. Data collection, management, and analysis is key in ensuring that the most marginalized members of Nepali society are reached, that their voices are heard. In promulgating the new Federal Constitution and committing to the realization of the 2030 Agenda for Sustainable Development, Nepal recognized that the dignity of the individual is fundamental and that the Agenda’s Goals and targets should be met for all people and for all segments of society. Ensuring that these commitments are translated into effective action requires a precise understanding of target populations. However, the disaggregated data needed to address all vulnerable groups— including children, youth, persons with disabilities, people living with HIV, older persons, indigenous peoples, refugees, internally displaced persons and migrants—as specified in the 2030 Agenda, are sparse. The analysis of some socio-demographic variables included in this study shows how data disaggregated by age, sex, states, and caste/ethnic groups can highlight significant variations. We hope that this study can contribute to generating some of the evidence required to inform policies and plans, especially at the sub-national level, as the country moves towards a federal structure where local investments and localized strategies and investments will be crucial. Finally, I would like to extend my appreciation to the study team including Dr. Yagya Bahadur Karki the lead author (former member of the National Planning Commission), and UNFPA Country Office colleagues Bijay Kumar Thapa, Tirtha Man Tamang, and Johnnie Auld, for the preparation of this report. I also acknowledge the contributions from our colleagues Sabrina Juran, Population and Development Branch/UNFPA Headquarters, and Christophe Lefranc, UNFPA Asia and Pacific Regional Office, for their valuable feedback on the draft report. Giulia Vallese Country Representative to Nepal United Nations Population Fund UNFPA Nepal 2017 ix
Disclaimer:

This report has been prepared by Dr. Yagya Bahadur Karki, a senior demographer and former member of the
National Planning Commission, Government of Nepal with support from technical staff of the UNFPA Country
Office, Nepal. The findings, interpretations, and conclusions expressed in this work do not necessarily reflect
the views of UNFPA. The analysis is based on the available published datasets as of end 2016, including
population and housing census, national household surveys and other administrative data. The report will be
updated as and when new data becomes available.

Recommended citation:
Population Situation Analysis of Nepal, United Nations Population Fund, 2017

x                                                                                           UNFPA Nepal 2017
Contents

1.     Introduction..................................................................................................................................................................1

       1.1      Background and rationale......................................................................................................................................................1

       1.2      Data sources..............................................................................................................................................................................1

2.     Population Dynamics.................................................................................................................................................. 3

       2.1      Population size and growth: national level......................................................................................................................3

       2.2      Population size and growth: State level...........................................................................................................................4

       2.3      Population growth: District level........................................................................................................................................6

       2.4      Demographic transition .......................................................................................................................................................6

       2.5      Age-sex structure...................................................................................................................................................................7

       2.6      Demographic dividend  ........................................................................................................................................................9

       2.7      Social demography: Caste/ethnicity .............................................................................................................................. 11

3.     Thematic Pillars of Population and Development............................................................................................... 14

       3.1      Dignity and human rights...................................................................................................................................................14

       3.2      Health...................................................................................................................................................................................... 25

       3.3      Place and mobility .............................................................................................................................................................. 43

       3.4      Governance and accountability.......................................................................................................................................49

       3.5      Sustainability......................................................................................................................................................................... 52

4.     Integration of Population Dynamics in the SDG Agenda....................................................................................54

       4.1      Paths to sustainability: Population and Development beyond 2014................................................................... 54

       4.2 Linkages between the SDGs and ICPD......................................................................................................................... 57

5.     Policy Implications................................................................................................................................................... 60

Bibliography.......................................................................................................................................................................63

Annexes..............................................................................................................................................................................66

Glossary of terms..............................................................................................................................................................72

UNFPA Nepal 2017                                                                                                                                                                                            xi
Acronyms and abbreviations ADB Asian Development Bank ANC Antenatal Care ASRH Adolescent Sexual and Reproductive Health BMI Body Mass Index CBS Central Bureau of Statistics CBR Crude Birth Rate CCA Common Country Analysis CDR Crude Death Rate CPR Contraceptive Prevalence Rate DD Demographic Dividend DDI Demographic Dividend Index DoCR Department of Civil Registration FP Family Planning FPAN Family Planning Association of Nepal FWLD Forum for Women, Law and Development GBSS Gender-Biased Sex Selection GBV Gender-Based Violence GDP Gross Domestic Product HIV Human Immunodeficiency Virus ICPD International Conference on Population and Development INSEC Informal Sector Service Centre IUD Intra-Uterine Device LDC Least Developed Country MIS Management Information System MMR Maternal Mortality Ratio MoFALD Ministry of Federal Affairs and Local Development MoH Ministry of Health NCASC National Centre for AIDS and STD Control NCDs Non-Communicable Diseases UNFPA Nepal 2017 xiii
Population Situation Analysis of Nepal

NDHS     Nepal Demographic and Health Survey

NEET     Not in Education, Employment and Training

NFS      Nepal Fertility Survey

NLFS     Nepal Labour Force Survey

NLSS     Nepal Living Standards Survey

NMICS    Nepal Multiple Indicator Cluster Survey

NPC      National Planning Commission

NPCS     National Planning Commission Secretariat

NPHC     National Population and Housing Census

OEWGA    Open-Ended Working Group on Ageing

PoA      Programme of Action

PSA      Population Situation Analysis

SDGs     Sustainable Development Goals

SLC      School Leaving Certificate

SRHRR    Sexual and Reproductive Health and Reproductive Rights

SMAM     Singulate Mean Age at Marriage

SR       Sex Ratio

SRB      Sex Ratio at Birth

TFR      Total Fertility Rate

UNCT     United Nations Country Team

UNDAF    United Nations Development Assistance Framework

UNFPA    United Nations Population Fund

UNICEF   United Nations Children’s Fund

UNPD     United Nations Population Division

VDC      Village Development Committee

WFS      World Fertility Survey

WHO      World Health Organization

xiv                                                                      UNFPA Nepal 2017
1. Introduction

1.1 Background and rationale
The United Nations Population Fund’s (UNFPA) activities call for an increased strategic focus, based on
the needs, priorities, and national development strategies of individual countries. The Population Situation
Analysis (PSA), a conceptual and methodological guide developed in 2010 by the Technical Division of UNFPA
Headquarters, expresses the commitment of the Fund to mainstream population dynamics, reproductive
health, and gender issues into National Development Strategies, explicitly adopting a human rights, cultural
and gender perspectives. It responds to the demand by countries that international cooperation should
promote national capacity-building and recognize national ownership and leadership as prerequisites for
development, in accordance with the principles agreed at the International Conference on Population and
Development (ICPD) and the Millennium Declaration5.

The PSA is a process that should help UNFPA to be a partner for national actors and the UN system in
strategic decision making on public policies, especially in the elaboration of national development strategies
based on the Sustainable Development Goals (SDGs) and human rights commitments, while mainstreaming
the agenda of the ICPD. Therefore, this PSA, serving as an analytical contribution from the population
perspective, could constitute a key resource in the process of Common Country Analysis (CCA) for United
Nations Development Assistance Framework (UNDAF) to better harmonize the support provided to the
country by UNFPA and the UN system at large in relation to the effective implementation of national SDGs
over the next 15 years. This analysis is expected to provide a sound basis for evidence-based policy dialogue
for integrating core population dynamics issues in the new sustainable development plan of the Government
of Nepal to ensure that ‘no one is left behind’.

This PSA draws on Nepal’s demographic transition and resulting population momentum using key
demographic variables for the next 15 years (2016-2030) in the context of the new federal structure of
the country. Evidence is generated using the five thematic pillars of population and development to inform
integration of key population dynamics issues in national development priorities to harness the demographic
dividend and realize national SDGs.

1.2 Data sources
The PSA has taken a comprehensive approach in terms of the use of the data and information production and
analysis at macro level, at the level of key individual sectors, including both productive and social sectors as
well as at the household or individual level as far as possible. The analysis used both primary and secondary
sources available from the national statistical system as appropriate. The primary sources include those to
be the national data, whereas the secondary include the data that have already undergone some processing
and that are being used for inter-country comparisons by international agencies. The use of national data
was felt essential in order to have a comprehensive analysis of key indicators at the disaggregated levels-
particularly by geographical areas (such as new States), caste/ethnicity and other important socio-economic
and demographic characteristics. However, we have also used data from international organizations such as
the United Nations Population Division particularly for the estimation of the length of Nepal’s demographic
window of opportunity as the national statistical system does not have population projections longer than
20 years from a specific baseline year.

More specifically, the major sources of data used in the analysis include: population and housing censuses,
demographic and health surveys, multiple indicator cluster surveys, living standards surveys and relevant

5   Population Situation Analysis: A Conceptual and Methodological Guide (UNFPA, 2010)

UNFPA Nepal 2017                                                                                               1
Population Situation Analysis of Nepal

management information systems data available as of end 2016. Besides, a wide range of published research
and study reports have been reviewed. Where appropriate the quantitative data and indicators that have
been presented are accompanied by meta-data underpinning the interpretation of the levels and trends
implied by the data.

It is also important to note that while conducting the analysis of the data effort has been made to assess
their quality of data in terms of their consistency, coverage and reliability of estimates particularly of
disaggregated figures. Also recognizing that the quality of data may vary by source and over time, this PSA
report has documented, by using footnotes, any deviations from and between different sources.

2                                                                                       UNFPA Nepal 2017
2. Population Dynamics
This chapter deals with the population dynamics of Nepal. Population dynamics is the study of human
population, including its size, distribution, composition, and the factors that determine changes in these
variables. Population change is driven by birth, death rates, immigration and emigration. While presenting
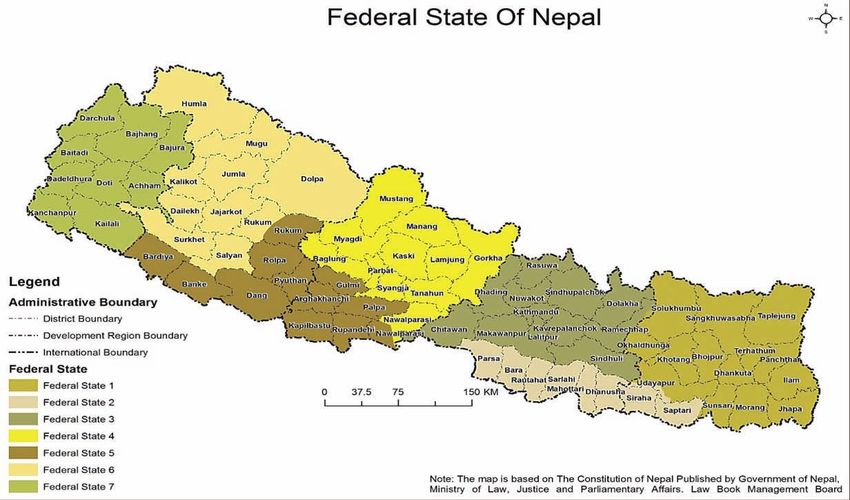
the data on population dynamics of Nepal, an attempt has been made to reflect on the seven federal states
(referred to as States) of Nepal as illustrated in the Map 1 below.
Map 1: Federated States of Nepal based on the Constitution of Nepal 2015
2.1 Population size and growth:
national level Figure 1: Growth of total population and average annual growth
rate, Nepal 1911–2031
Nepal exemplifies a developing
country where fertility has been high 40 3
2.62
and mortality has declined steadily 35 33.6 2.5
2.28
resulting in a population momentum. 2.08
2.25
30.4
2.05
30
From the first population count in 1911, 26.5
2
1.64
the population had doubled by the time M
i 25 23.2 P
the 1971 census was conducted, rising l
l
1.37 1.5 e
r
20 1.16 18.5 1.35 1.10
from 5.6 million to 11.6 million. The last i
o 1
c
e
15.0
census of 2011 showed a population n 15 n
s t
11.6
of 26.5 million, presenting an average 10 9.4
0.5
8.3
annual growth rate of 1.35 percent 5.6 5.6 5.5 6.3
0
during the intercensal period 2001- 5
NA
-0.13
-0.07
2011 (Figure 1, see Appendix 1 for data). 0 -0.5
1911 1930 1952/54 1971 1991 2011 2031
The annual growth rates of Nepal’s Year
Annual growth rate (%)
population were low until 1941, this is
attributed to incomplete census taking Source: Pathak, R. S. and K. Lamichhane. 2014. and CBS. 2014. Population projection
2011-2031
UNFPA Nepal 2017 3Population Situation Analysis of Nepal
and mainly counting the male population (Singh, 1983). The average annual growth rate during 1941-1952/54
period was above 2 percent which is attributed to two reasons; the low coverage of the 1941 census and the
improved census taking in the 1952/54 (Banister and Thapa, 1981). The population growth rate dipped to 1.6
percent per annum during the 1952/54-1961 period. Again, attributed to two reasons, an undercount of the total
population, especially of children under five, and as the census enumeration was done at two points in time in
1952 and in 1954, there were several complications when the data was combined into one count (Krotki and
Thakur, 1971). For 40 years from 1961 to 2001 the average annual population growth rate was above 2 percent,
this is reported to be primarily due to a fast declining mortality without a corresponding decline in fertility.
Between 2001 and 2011 the average annual growth rate suddenly declined to less than 2 percent per annum
(Figure 1). According to the Central Bureau of Statistics (CBS), the low growth rate was largely due to the high
volume of the absentee population, counted at 1.92 million (2012). The average annual growth rate for females
during the intercensal period was 1.63 percent while for males it was 1.05 percent. It must be noted, however,
that many of the absentees not included in the census count will be returnees who were working overseas and
would return home once they retire or leave their current place of work outside the country.
Figure 1 also shows population sizes and growth rates for 2021 and 2031 based on population projection
(medium variant) made by the CBS (CBS, 2014). The total population of Nepal is projected to grow to 30.4
million by 2021 and further to 33.6 million by 2031 and the corresponding average annual growth rates are
estimated to be 1.37 percent and 1.10 percent respectively (CBS, 2014).
2.2 Population size and growth: State level
The 2015 Constitution of Nepal (Ministry of Law, Justice, Constitutional Assembly and Constitutional Affairs,
September 2015) federated Nepal into 7 States (see Appendix II for distribution of districts by States),
however, the existing population distribution is uneven. In terms of population size State Three is the largest,
therefore its population provides the State with a large labour force, followed by State Two (Table 1).
Table 1: Population distribution of federal States based on 2011 population census
States Population Percent of Number of Number of districts with
population districts negative population growth
One 4,534,943 17.1 14 9
Two 5,404,145 20.4 8 0
Three 5,529,452 20.9 13 7
Four (a)
2,460,756 9.3 10 8
Five (b) 4,485,128 16.9 11 3
Six(c) 1,527,563 5.8 10 0
Seven 2,552,517 9.6 9 0
Nepal 26,494,504 100.0 75 27
(a)
East of Bardghat of Nawalparasi has been annexed to State Four
(b)
Rukum east is part of State Five and
(c)
Rukum west is part of State Six
Source: Karki, Y. B. 2016. Population First. Republica. February 1. Kathmandu.
State Six is the smallest followed by State Four. During the 2001-2011 decade, 27 districts of the country had
negative population growth rate and in States Four, 80 percent of districts experienced negative population
growth. In this respect, State Four is in the most disadvantageous position. Among the 14 districts of State
One, nine districts are experiencing negative population growth. States Two, Six, and Seven do not have any
district with negative population growth.
4 UNFPA Nepal 2017Population Dynamics
Between 2001 and 2011 (Figure 2), the total population of Nepal increased by 14.4 percent while in States
Three and Six, the percentage increase was about the same, 21 percent (Figure 2). The second highest increase
(17%) is seen in State Two, followed by State Seven (16%), State Five (14%), State One (8%) and the lowest
increase (4%) is seen in State Four (Figure 2). A similar pattern is found with respect to average annual
growth rates of population in the seven States during the period 2001-2011.
Figure 2: Population size and % change, by State, 2001-2011
Among the seven States (Figure 3), State Three tops the list in population size right through to 2031,
State Two coming second. In 2011 State One was the third largest but State Five will take this position in
the future. State Six comprising mainly of Karnali zone (a mountainous region) is ranked as the smallest
in population size through to 2031.
Figure 3: Population size and % change, by State, 2021-2031
UNFPA Nepal 2017 5Population Situation Analysis of Nepal
2.3 Population growth: District level
The 2011 census showed a negative growth rate in 27 of the 75 districts of Nepal for the 2001-2011 intercensal
period. Previous censuses showed no district with negative growth rate. Of the 27 districts, eight are Mountain
and 19 are Hill districts (see Map 2 below and Appendix III for data).
Map 2: Intercensal annual population growth rate 2001-2011 by district
Source: CBS and UNFPA, 2003 and CBS, 2012
2.4 Demographic transition
The population of a country generally passes through a series of stages during which it transitions from a
situation where both mortality and fertility are high, to a position where both mortality and fertility are low.
Both before and after the transition population growth tends to be very slow. During the transition, population
growth is very rapid, especially Figure 4: Demographic transition in Nepal, 1961-2031
because the decline in mortality
tends to occur before the
decline in fertility.
The population of Nepal is
approaching ‘Stage III’ of a
demographic transition. This is
characterised by low fertility
and low mortality. However,
currently it is in the lower end
of ‘Stage II’ where death rate
and birth rate are low, but birth
rate remains slightly higher
than the death rate. Recent
data, available as of 2011,
indicates that the CBR is about
24 per 1,000 population but
Source: Krotki, K. J. And Thakur, H. N. 1971; Karki, Y. B. 1984; Karki, Y. B. 1992; MOH, New ERA
the CDR is only about 7 per
and ORC Macro 2002; MOH, New ERA and ICF Intl 2012; CBS. 2014; CBS, 1977; NPC, 1985;
1,000 population (Figure 4). CBS, 2003; Joshi, P. L. 2014
6 UNFPA Nepal 2017Population Dynamics
Projected CBRs and CDRs up to 2031 also show that Nepal’s population will still be in late Stage II of a
demographic transition as birth and death rates, as indicated by the medium variant projection6, will by 2031
not be very low. As mentioned, Nepal is going through a demographic transition and there are different ways
of calculating the ‘window of opportunity’ (S. Zhang, E. Loaiza and R. Snow, 2016). However, the important
issue is that Nepal is in the middle of this window and in order to reap the benefits of the demographic
dividend Nepal must be prepared to invest in education, empowerment, and employment of young people
(World Economic Forum, 2015).
2.5 Age-sex structure
Age structure and population pyramids
In Nepal, the young age population is declining and the working age population is increasing. In 1991 the working
age male population, defined internationally as aged 15-64, was 52.9 percent of the total male population and
the corresponding figure was 55.3 percent for females (Figure 5). The 1991 pyramid also indicates that fertility
was beginning to decline 10 years prior to 1991.
As of 2011, the male working age population increased to 57.9 percent and the corresponding figure for
females was 61.6 percent (Figure 6). This shows that the proportion of working age population increased
more rapidly for females than for males, however, it must be noted that among the males a large number
(1,684,086) were absentees working outside the country while the respective figure for females was 237,408.
A population growth projection conducted by CBS shows that by 2021 the male working age population will
increase from 58 percent in 2011 to 64 percent in 2021, with the corresponding figures for females 62 percent
and 67 percent respectively (Figure 7).
Population projections for 2031 (Figure 8) shows an increase of working age male population to 66 percent
(CBS) and for females 69 percent. CBS projections show fewer female children (9.3 percent females vs. 10.7
percent males) in age group 0-4 in 2021, this pattern continues to 2031. This indicates a decrease in female
births each year, with potential implications on the sex ratio balance and implications with respect to gender
discrimination and human rights violations.
Population Pyramids based on 2011 census data for 7 States are shown in Appendix IV.
6 In general, population projections are made using three variants: high variant, medium variant and low variant. CBS
2014 used these three variants for population projection. Each variant is comprised of fertility, mortality and migration
assumptions over time; for high variant CBS used slow decline in fertility, plausible decline in mortality and migration, for
medium variant all three components assumed plausible decline and for low variant fast fertility decline and plausible
decline in mortality and migration was assumed.
UNFPA Nepal 2017 7Population Situation Analysis of Nepal 8 UNFPA Nepal 2017
Population Dynamics

Dependency ratio
Declining fertility and improving mortality over the years have contributed to the decline in the dependency
ratio7 in Nepal. Analysis of total population by age since 1971 shows that the dependency ratio was high in
1971 in that for every 100 persons of working age, 77  were dependent (Figure 9). The dependency ratio was
still high in 2011 when every 67 persons were dependent on 100 persons of the working age population. It is
expected that by 2021 nearly half of the population will depend on about the same proportion of the working
age population and by 2031 proportionally more people will be of working age compared to the dependent
population.

                                       Figure 9: Dependency ratio 1971-2031, Nepal

Source: CBS, 2012. National Population and Housing Census 2011: National Report. CBS and UNFPA, 2003. Population Census 2001:
 National Report; CBS. 1993. Population Census – 1991. Vol. I. CBS. 1984. Population Census – 1981. Vol.  I. and CBS, 1975. Population
                                                        Census 1971. Vol. I

2.6 Demographic dividend
The demographic transition affects the age structure of the population. The demographic dividend is the
accelerated economic growth that may result from a decline in a country’s mortality and fertility and the
subsequent change in the age structure of the population. With fewer births each year, a country’s young
dependent population grows smaller in relation to the working-age population8. With fewer people to support,
a country has a window of opportunity for rapid economic growth if the right social and economic policies are
developed and investments are made.

There is a variety of different methodologies clustering countries in “Pre-“, “Early-“,”Late-“ and “Post-“
dividend”, in countries in which the Window of Opportunity is “closed”, “opening”, “open”, “passing” or simply

7    Dependency ratio is the ratio of economically active population generally defined as those belonging to 15 - 59 or 15 - 64
     age group to the economically inactive population age 0-14 and 60+ or 65+. In this report 15-64 age group is taken as
     economically active.
8    James Gribble and Jason Bremner. 2012. The Challenges of attaining the demographic dividend. Policy Brief. (Washington,
     DC: Population Reference Bureau, September).

UNFPA Nepal 2017                                                                                                                    9
Population Situation Analysis of Nepal
in countries with an “open” or “closed” windows from different agencies including UNFPA, the World Bank
and UNICEF (Herrmann, 2016).
This analysis suggests that small changes in parameters can alter the predictions of when the Window of
Opportunity opens and closes to a large extent. In addition, these methodologies do not take into account
other factors that heavily influence a country’s ability to benefit from a demographic dividend, such as quality
education for young people, the access of women to the formal labour force and employment opportunities
for young people. Therefore, the calculations of exact period of the Window of Opportunity (opening year and
closing year) by different sources may vary depending on the methodologies used or factors considered for
the estimation (Herrmann, 2016).
Demographic Dividend at national level
In Nepal, the demographic dividend has begun, with the growth of the working age population becoming
higher than the growth of total population. This is likely to end sometime in the coming decades9 when the
growth of the working age population becomes lower than the growth of total population, implying that we
are currently in the window of opportunity for Nepal to reap the benefits of demographic dividend (Figure 10).
Figure 10: Demographic window of opportunity: Population growth rates by working status, Nepal
Source: Calculated by Y. B. Karki using population census data of 1981, 1991, 2001, 2011, CBS. 2014 Population Projection 2011-2031 and
Population Projection of UNDESA (UNPD) 2015
Demographic Dividend at the sub-national level
In line with a 3E Policy Framework recommended by the World Economic Forum to Reap the Demographic
Dividend: Empower, Educate, Employ; UNFPA has performed a small area estimation at the district level that
revealed decisive variations on the sub-regional level with respect to the dependency ratio and relevant three
indicators in empowerment, education, and employment, of young people.
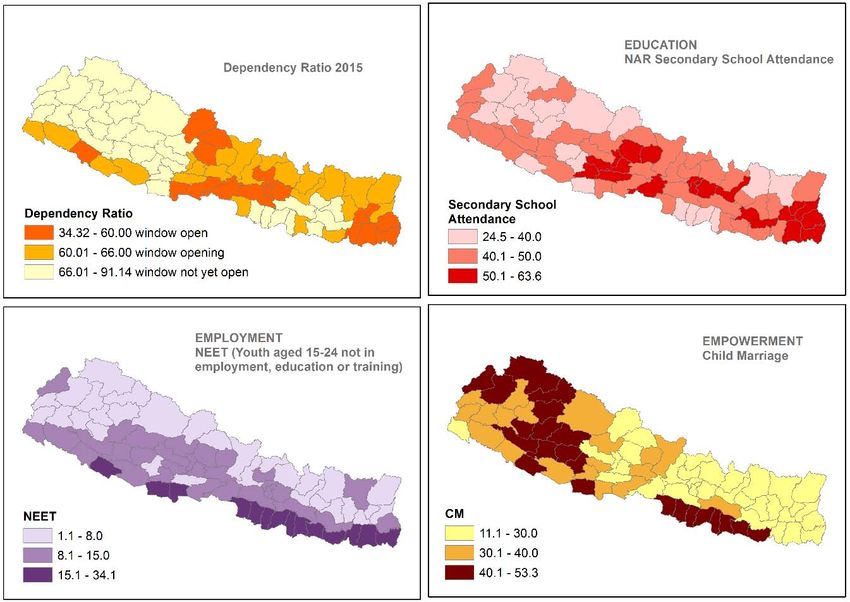
The district-level spatial distributions regarding the status of the demographic dividend according to the
9 CBS Projection used only up to 2031 (CBS, 2014) and after that UN Population Department data used (UNPD, 2015)
10 UNFPA Nepal 2017Population Dynamics
Demographic Dividend Index (DDI) components, and the dependency ratio in 2011, are illustrated in the maps
below. Through comparison of the four maps, it is possible to identify the districts where human capital is
low. For example, most districts located in the north-east of the country have a relatively low dependency
ratio of less than 66 percent. However, most districts have a secondary school attendance rate lower than
50 percent, with two districts lower than 40 percent. Among the 20 districts along the south boundary
of Nepal, eight districts with low dependency ratios of lower than 66 percent have a high NEET value
of over 15 percent. Most districts with high percentages of child marriage have a correspondingly high
dependency ratio. The maps shown below suggest a need to ensure access to health services, jobs,
and education, as well as an urgent effort to reduce child marriage among the districts with the high
proportion of vulnerable young people.
Map 3: The four maps show dependency ratio, schooling, unemployment, and child marriage, by district
Source: UNFPA, TD/PDB, 2016
2.7 Social demography: Caste/ethnicity
Despite being a relatively small country, Nepal is comprised of 125 caste/ethnic groups as stated in the 2011
census (CBS, 2012). These 125 caste/ethnic groups are grouped into 8 broad major groupings: Chhetri, Bahun,
Hill Janajati, Terai Janajati, Terai other castes, Hill Dalit, Terai Dalit and Muslim (see Appendix V for grouping of
broad caste/ethnic groups). In addition to the identified groups, CBS has codes for (1) Dalit others, (2) Janajati
Others (3) Terai others, (4) Undefined others and (5) Foreigners. The first three are added to the above relevant
categories, while ‘unidentified others’ and ‘foreigners’ have been excluded due to their very low size.
UNFPA Nepal 2017 11You can also read