Travel Management Priorities for 2013 - CWT Perspectives January 2013
←
→
Page content transcription
If your browser does not render page correctly, please read the page content below

CWT Perspectives
Travel Management Priorities for 2013
                                January 2013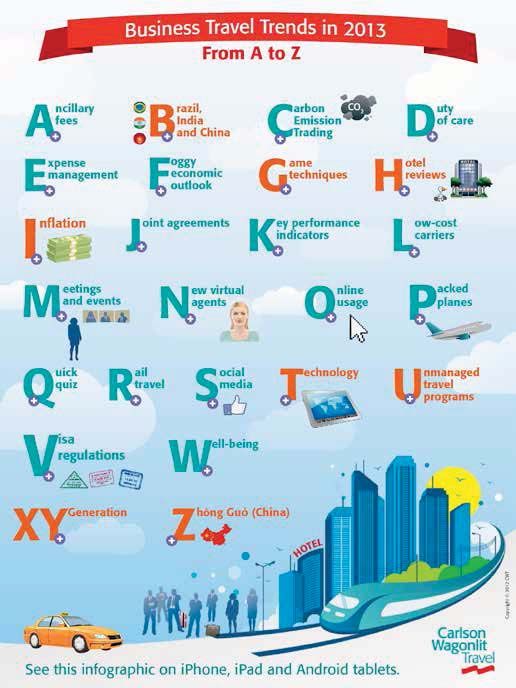

Contents

Executive summary ......................................................................................................5

2013 priorities and planned measures ..................................................................8
   Global annual survey ....................................................................................................................................................................... 8
   2013 priorities .................................................................................................................................................................................... 8

2013 business travel trends from A to Z .......................................................... 20
   Ancillary fees .....................................................................................................................................................................................21
   Brazil, India and China ...................................................................................................................................................................24
   Carbon emission trading ..............................................................................................................................................................30
   Duty of care to employees ..........................................................................................................................................................32
   Expense management ..................................................................................................................................................................34
   Foggy economic outlook ..............................................................................................................................................................35
   Game techniques ...........................................................................................................................................................................37
   Hotel reviews ....................................................................................................................................................................................39
   Inflation in prices .............................................................................................................................................................................41
   Joint agreements between airlines ...........................................................................................................................................44
   Key performance indicators ........................................................................................................................................................47
   Low-cost carriers ..............................................................................................................................................................................49
   Meetings and events (hybrid and virtual) ..............................................................................................................................52
   New virtual agents ..........................................................................................................................................................................54
   Online adoption ...............................................................................................................................................................................55
   Packed planes ..................................................................................................................................................................................56
   Quick quiz ..........................................................................................................................................................................................57
   Rail travel ............................................................................................................................................................................................58
   Social media......................................................................................................................................................................................61
   Technology.........................................................................................................................................................................................62
   Unmanaged travel programs ......................................................................................................................................................64
   Visa regulations ................................................................................................................................................................................67
   Well-being ..........................................................................................................................................................................................69
   Generations X and Y ......................................................................................................................................................................70
   Zhng Guó (China) ........................................................................................................................................................................72

About the CWT Travel Management Institute ................................................... 74

                                                                                                                                      Travel Management Priorities for 2013 | 3
Executive summary
Survey on travel management priorities for 2013
Large and mid-sized companies share the same travel priorities, according to CWT’s latest global client survey on travel
management priorities. In 2013, companies of all profiles will continue to make driving air and ground savings their top focus,
followed by improving traveler compliance and optimizing hotel spend. As areas that offer major savings opportunities, it
is no surprise they dominate the rankings in these economically challenging times. Other recognized sources of hard savings,
optimizing online adoption and optimizing the travel policy, come next, while “softer” ways to enhance program performance
take on less importance overall.

    Figure 1
    Travel managers’ priorities for 2013
                                                                                        p
                                        2013
                                       Ranking                               Priority                         Respondents

                                           1     Driving air and ground transportation savings                     61%

                                           2     Improving traveler compliance                                     64%

                                           3     Optimizing hotel spend                                            59%

                                           4     Optimizing online adoption                                        55%

                                           5     Optimizing the travel policy                                      49%

                                           6     Enhancing the traveler experience                                 43%

                                           7     Further consolidating the travel program                          33%

                                           8     Developing key performance indicators                             34%

                                           9     Addressing safety and security needs                              25%

                                          10     Tackling meetings and events                                      16%

                                          11     Making the program more environmentally friendly                   8%
   Notes:
      CWT asked travel managers to select their top five travel management priorities for 2013 and rank them in order of importance. The responses were weighted
      to take into account how often each priority was ranked 1st, 2nd, 3rd, 4th or 5th. The “Respondents” column shows the proportion of travel managers who
      included the priority in their top five.
      “Driving air and ground transportation savings” was identified as a priority by fewer travel managers than “improving traveler compliance” (61% compared to
      64%) but ranked higher overall because it figured higher in travel managers’ top five.

   Source: CWT Travel Management Institute
   Based on a survey of 706 travel managers worldwide (November 2012)

This year’s results also reveal some differences between regions, reflecting the market conditions faced by respondents as
well as program maturity. For example, while driving air and ground savings remains the top priority for country/regional
travel managers in Europe, the Middle East and Africa, and Latin America, improving traveler compliance is considered more
important by travel managers in Asia Pacific and North America, as well as those responsible for global programs. Compared to
the total sample, optimizing online adoption is also a stronger focus for country/regional travel managers in EMEA and global
travel managers (who rank it 3rd instead of 4th). As could be expected, global travel managers accord a higher priority than
their regional colleagues to further consolidating the travel program. Travel managers in Asia Pacific, on the other hand, rank
safety and security higher (7th vs. 9th in the total sample), while in Latin America, more importance is attached to developing
key performance indicators (4th vs. 8th) and enhancing the traveler experience (5th vs. 6th).

                                                                                                           Travel Management Priorities for 2013 | 5
Figure 2
     2013 priorities by travel managers’ scope of responsibility

        Asia Pacific                    Europe, Middle East               Latin America                   North America                         Global
                                              and Africa
      Priority        Respondents     Priority     Respondents        Priority        Respondents      Priority        Respondents     Priority        Respondents
      Compliance              66%     Air & ground             64%    Air & ground              82%    Compliance                65%   Compliance                  75%
      Air & ground            59%     Compliance               62%    Hotel                     59%    Air & ground              57%   Air & ground                56%
      Hotel                   53%     Online adoption          59%    Compliance                57%    Hotel                     60%   Online adoption             57%
      Travel policy           51%     Hotel                    60%    KPIs                      50%    Online adoption           54%   Hotel                       56%
      Online adoption         49%     Travel policy            51%    Traveler experience 50%          Travel policy             53%   Consolidation               46%
      Traveler experience 47%         KPIs                     35%    Online adoption           48%    Traveler experience       51%   Traveler experience         41%
      Safety & security       32%     Traveler experience 34%         Travel policy             32%    Consolidation             35%   Travel policy               35%
      Consolidation           27%     Consolidation            31%    Consolidation             32%    KPIs                      32%   KPIs                        38%
      KPIs                    22%     Safety & security        23%    Safety & security         25%    Safety & security         28%   Safety & security           17%
      Environment             7%      Meetings & events        15%    Meetings & events         14%    Meetings & events         18%   Meetings & events           21%
      Meetings & events       7%      Environment              13%    Environment               2%     Environment               6%    Environment                 2%

    Sample size: 59 travel managers      287 travel managers               44 travel managers              253 travel managers                63 travel managers

Note: Regional results include country/regional travel managers.
Source: CWT Travel Management Institute
Based on a survey of 706 travel managers worldwide (November 2012)

Travel management in 2013: an A-Z of trends to watch
To help travel managers tackle their priorities, CWT has produced an “A-Z” of trends impacting the travel program.
(See Figure 3 on Page 7.) These can be grouped into a number of broader developments.

To start with, technology is firmly in the spotlight, playing an ever-important role in keeping travelers happy, safe and
productive while helping companies to drive compliance and manage their programs more effectively. With Generation Y or
the younger generation of travelers already surpassing other populations of business travelers in some countries, companies
can no longer ignore the need for a social media strategy or the benefits of recent tools such as games techniques,
corporate hotel review sites, and virtual/hybrid solutions for meetings and events. Meanwhile, airlines and airports are
embracing the future with new virtual travel agents. Online booking tool adoption will continue to rise, especially in
Eastern countries. But companies will not lose sight of the human element, looking at ways to increase traveler well-being
and fulfill their duty of care to employees.

Despite a foggy economic outlook, companies can expect slight growth in travel in the more developed business travel
markets contrasted with faster growth in developing countries. Brazil, India and China will play a starring role, with business
travel spend increasing at around twice the pace of the world average (12.6 percent, 21.5 percent and 14.7 percent forecast
growth respectively, compared with 8.1 percent globally).1 However, even in the fastest-growing markets, inflation in travel
prices is expected to be modest overall at around a few percentage points across most travel categories.

A number of developments in the supplier landscape are also worth watching. As airlines continue to take a cautious
approach to capacity increases, packed planes will remain the norm, underlining the importance of advance booking. New
joint airline agreements, the growing presence of low-cost carriers and more extensive high-speed rail networks will
offer opportunities for companies worldwide, particularly in travel programs focusing on optimizing the trade-offs between air
and high-speed rail. When considering different supplier proposals, travel managers will increasingly consider the total cost of
spend, including ancillary fees that now represent an estimated 5-10 percent of companies’ total travel budgets. To do so,
more companies will focus on more effective expense management.

1
    GBTA Foundation, GBTA BTI Outlook Annual Global Report and Forecast, Prospects for Global Business Travel 2012-2016 (July 2012)

6
Regulatory changes will have a varied impact. For example in China (“ZhŮng Guó” in transliteration), new rules allowing
international airlines to ticket via foreign global distribution systems will be slow to take effect, partly due to lengthy approval
procedures. On the other hand, relaxed visa regulations in some countries should bring good news for the impacted passport
holders. Meanwhile, the European Union’s controversial new carbon emission trading system will likely see higher airline
costs passed on in fuel surcharges. On this “green” theme, more companies will be tracking their carbon footprints in their key
performance indicators.

Finally, all eyes will be on the growing debate surrounding “unmanaged” business travel or “open booking,” which some
industry observers are advocating as an alternative to travel booked through travel counselors and online booking tools. Lacking
sufficient proof of real cost savings and traveler satisfaction, this form of “travel management 2.0” seems to be weighed down
by disadvantages. However, much awaited further research should be published by the Global Business Travel Association, as
well as by the CWT Travel Management Institute later this year…

Figure 3
Business travel trends in 2013

Source: CWT Travel Management Institute
                                                                                       Travel Management Priorities for 2013 | 7
2013 priorities and planned measures
Global annual survey
CWT conducts an annual online survey of travel managers to benchmark their priorities and the measures they plan to implement
over the year to come.

This year, the sample more than doubled to 706 travel managers, up from 290 last year. Further, the scope of the survey
was extended to include companies with mid-sized national programs (representing at least US$2 million of travel spend) in
addition to those with the largest international programs (more than US$100 million of travel spend over at least 2 regions).

2013 priorities
In 2013, the overall ranking of priorities remains fairly stable compared to 2012. As can be expected, travel managers intend to
focus most on areas representing the greatest savings opportunities rather than those linked more to the traveler experience.

What is more surprising perhaps is that the ranking of priorities is identical for companies with major global programs and those
with mid-sized national programs that may not have reached the same levels of maturity. Also worth highlighting are a number
of regional variations:

    Driving air and ground savings is the top priority overall but an especially high priority for travel managers in Latin
    America, 82 percent of whom ranked this area in their top five.

    Improving traveler compliance is the top priority for travel managers with global responsibilities, 75 percent of whom
    ranked the area in their top five, as well as respondents in Asia Pacific (66 percent) and North America (65 percent).

    Optimizing hotel spend is highly ranked by all categories of travel managers (53-60 percent, depending on the region).

    Optimizing online adoption is accorded more importance by travel managers in Europe, the Middle East and Africa, and
    travel managers with global responsibilities (ranked by both as the number three priority).

    Optimizing the travel policy is a priority for 49 percent of respondents overall, although the percentage per region varies
    quite considerably—from 32 percent in Latin America to 53 percent in North America.

    Enhancing the traveler experience is a top five priority for more travel managers in North America and Latin America
    (51 percent and 50 percent respectively) than in Europe, the Middle East and Africa (34 percent).

    Further consolidating the travel program is a high priority for more global travel managers (46 percent) than the overall
    sample (33 percent).

    Developing key performance indicators is ranked higher by travel managers in Latin America (in 4th position, compared
    to 8th overall).

    Addressing safety and security needs is a stronger focus for Asia Pacific (32 percent of respondents, ranking 7th) than
    the overall sample (25 percent, ranking 9th).

    Tackling meetings and events is cited more often by global travel managers than the overall sample (21 percent and
    16 percent respectively).

    Making the program more environmentally friendly is almost always the lowest-ranking priority for the different
    categories of travel managers.

8
Figure 4
 Travel managers’ priorities for 2013

                                     Total sample                                                                   Surveyed companies by sector
  2013
 Ranking                                   Priority                         Respondents
                                                                                                                                   Media, hotels, restaurants & transportation
     1       Driving air and ground transportation savings                     61%
                                                                                                                                   6%
                                                                                                  Industrial manufacturing
     2       Improving traveler compliance                                     64%                                                            Other
                                                                                                                        3%
                                                                                                                                              7%       Chemicals, pharmaceuticals
     3       Optimizing hotel spend                                            59%                 Aerospace,                                          & healthcare
                                                                                              defense, oil, gas                                        8%
     4       Optimizing online adoption                                        55%             & construction
                                                                                                        27%
     5       Optimizing the travel policy                                      49%
                                                                                                                                                            IT & telecommunications
     6       Enhancing the traveler experience                                 43%
                                                                                                                                                            15%
     7       Further consolidating the travel program                          33%
                                                                                                 Banking, consulting
     8       Developing key performance indicators                             34%                      & insurance
                                                                                                                              Consumer products, food & retail
                                                                                                              18%
     9       Addressing safety and security needs                              25%                                                                         16%

    10       Tackling meetings and events                                      16%

    11       Making the program more environmentally friendly                   8%
          Sample size: 706 travel managers

                                                  Breakdown by travel managers’ scope of responsibility
    Asia Pacific                      Europe, Middle East               Latin America                         North America                                 Global
                                            and Africa
  Priority        Respondents       Priority     Respondents        Priority        Respondents            Priority         Respondents            Priority        Respondents
  Compliance              66%       Air & ground              64%   Air & ground              82%         Compliance                    65%        Compliance                  75%
  Air & ground            59%       Compliance                62%   Hotel                     59%         Air & ground                  57%        Air & ground                56%
  Hotel                   53%       Online adoption           59%   Compliance                57%         Hotel                         60%        Online adoption             57%
  Travel policy           51%       Hotel                     60%   KPIs                      50%         Online adoption               54%        Hotel                       56%
  Online adoption         49%       Travel policy             51%   Traveler experience 50%               Travel policy                 53%        Consolidation               46%
  Traveler experience 47%           KPIs                      35%   Online adoption           48%         Traveler experience           51%        Traveler experience         41%
  Safety & security       32%       Traveler experience 34%         Travel policy             32%         Consolidation                 35%        Travel policy               35%
  Consolidation           27%       Consolidation             31%   Consolidation             32%         KPIs                          32%        KPIs                        38%
  KPIs                    22%       Safety & security         23%   Safety & security         25%         Safety & security             28%        Safety & security           17%
  Environment             7%        Meetings & events         15%   Meetings & events         14%         Meetings & events             18%        Meetings & events           21%
  Meetings & events       7%        Environment               13%   Environment                2%         Environment                   6%         Environment                 2%

Sample size: 59 travel managers         287 travel managers              44 travel managers                       253 travel managers                     63 travel managers

 Notes:
     CWT asked travel managers to select their top five travel management priorities for 2013 and rank them in order of importance. The responses were weighted
     to take into account how often each priority was ranked 1st, 2nd, 3rd, 4th or 5th. The “Respondents” column shows the proportion of travel managers who
     included the priority in their top five.
     “Driving air and ground transportation savings” was identified as a priority by fewer travel managers than “improving traveler compliance” (61% compared to
     64%) but ranked higher overall because it figured higher in travel managers’ top five.
     Regional results include country/regional travel managers.

 Source: CWT Travel Management Institute
 Based on a survey of 706 travel managers worldwide (November 2012)

                                                                                                                     Travel Management Priorities for 2013 | 9
Asia Pacific

In Asia Pacific, the number one priority for travel managers is improving traveler compliance, with driving air and ground
savings falling to 2nd place. Optimizing hotel spend remains the third priority, while optimizing the travel policy comes
further up the rankings (4th rather than 5th), swapping places with optimizing online adoption. Another area that is given
more importance is addressing safety and security needs, which ranks 7th in Asia Pacific, compared to 9th in the total sample.
In contrast, developing key performance indicators ranks slightly lower (9th vs. 8th). (See Figure 4 on Page 9.)

Compared with other regions, travel managers in Asia Pacific intend to place more focus on:
     Communicating/providing training on the travel policy and empowering travel counselors to enforce rules (to improve
     compliance)
     Tightening air and ground travel policy while finding the right balance between negotiated and restricted fares, as well as
     exploring low-cost carrier opportunities (to drive air savings)
     Mandating preferred booking channels and consolidating hotel spend on fewer properties to leverage larger volumes in
     negotiations (to optimize hotel spend)
     Increasing the scope of online booking tool (OBT) implementation and mandating OBT usage (to optimize online adoption)

And less focus on:
     Negotiating fuel surcharges and ancillary fees (to drive air and ground savings)
     Globalizing volumes and contracts (to further consolidate the travel program)

                          Figure 5
                          Asia Pacific key indicators (air)

                             Average ticket price in economy class
                             Domestic                                                   US$283
                             Continental                                                US$503
                             Intercontinental                                           US$1,242

                             Average ticket price in business class
                             Continental                                                US$1,775
                             Intercontinental                                           US$4,667

                             Intercontinental flights booked in business class           34%

                             Flights booked at least 14 days in advance
                             Domestic                                                   21%
                             Continental                                                41%
                             Intercontinental                                           57%

                          Source: CWT Travel Management Institute
                          Based on tickets booked by CWT clients (Q3 2012)

10
Figure 6
Top priorities and planned measures for travel managers in Asia Pacific
2013
Ranking Priority Planned measures Respondents*
Communicate and provide training on travel policy 72%
Actively remind employees of policy 67%
Improving
1 traveler
compliance
Engage management throughout the organization 59%
Track and communicate compliance levels 56%
Empower travel counselors to enforce compliance 49%
Find the right balance between negotiated and restricted fare usage 57%
Driving air
Tighten air policy (class of travel, use of connecting flights, advance booking, etc.) 51%
and ground
2 transportation Work with airline alliances 43%
savings Negotiate point-of-origin pricing 40%
Concentrate volume on a limited number of suppliers 40%
Consolidate hotel spend on fewer properties to leverage larger volumes in negotiations 61%
Optimizing Mandate preferred booking channels 58%
3 hotel spend Mandate the use of preferred hotels 58%
Consolidate multiple sources of hotel data 52%
Address advance purchase behavior 57%
Optimizing
4 the travel policy
Standardize the policy regionally or globally 50%
Aim for best-in-class travel policy guidelines 37%
Enhance communication/training 76%
Optimizing
Track and communicate online booking tool (OBT) usage 69%
5 online
adoption Increase scope of OBT implementation 45%
Mandate OBT usage 45%
* Percentage of respondents who selected the planned measure having cited the corresponding priority in their top five
Source: CWT Travel Management Institute
Based on a survey of 59 travel managers in Asia Pacific (November 2012)
Travel Management Priorities for 2013 | 11Europe,
In Europe, the Middle East and Africa, driving air and ground transportation savings and improving traveler compliance
remain the top two priorities for travel managers. Compared to the total sample, optimizing online adoption comes higher
in the ranking, switching places with optimizing hotel spend (ranking 3rd and 4th respectively). Optimizing the travel
policy remains in 5th place, while enhancing the traveler experience ranks slightly lower (7th vs. 6th in the total sample).
(See Figure 4 on Page 9.)
Compared with other regions, travel managers in Europe, the Middle East and Africa intend to place more focus on:
Tightening air and rail policy (to drive air and ground transportation savings)
Addressing advance purchase behavior (to optimize the travel policy)
And less focus on:
Negotiating point-of-origin pricing (to drive air and ground transportation savings)
Implementing an expense management tool (to improve traveler compliance)
Implementing social media tools/apps (to improve the traveler experience)
Figure 7
Europe, Middle East and Africa key indicators (air)
Average ticket price in economy class
Domestic US$447
Continental US$577
Intercontinental US$1,617
Average ticket price in business class
Continental US$1,689
Intercontinental US$6,523
Intercontinental flights booked in business class 39%
Flights booked at least 14 days in advance
Domestic 36%
Continental 46%
Intercontinental 64%
Source: CWT Travel Management Institute
Based on tickets booked by CWT clients (Q3 2012)
12Middle East and Africa
Figure 8
Top priorities and planned measures for travel managers in Europe, Middle East and Africa
2013
Ranking Priority Planned measures Respondents*
Driving air Tighten air policy 40%
and ground
1 transportation
Find the right balance between negotiated and restricted fare usage 40%
savings Concentrate volume on a limited number of suppliers 38%
Actively remind employees of policy 71%
Improving
2 traveler
compliance
Engage management throughout the organization 56%
Communicate and provide training on travel policy 47%
Enhance communication/training 58%
Optimizing
3 online
adoption
Track and communicate online booking tool (OBT) usage 44%
Encourage travel counselors to steer travelers to the OBT 40%
Mandate the use of preferred hotels 54%
Optimizing
4 hotel spend
Negotiate amenities (e.g., Internet, breakfast and parking) 39%
Consolidate hotel spend on fewer properties to leverage larger volumes in negotiations 39%
Address advance purchase behavior 61%
Optimizing the
5 travel policy
Standardize the policy regionally or globally 38%
Aim for best-in-class travel policy guidelines 30%
* Percentage of respondents who selected the planned measure having cited the corresponding priority in their top five
Source: CWT Travel Management Institute
Based on a survey of 287 travel managers in Europe, Middle East and Africa (November 2012)
Travel Management Priorities for 2013 | 13Latin America
Driving air and ground transportation savings also remains the top priority when looking at the survey results for Latin
America. Optimizing hotel spend and improving traveler compliance switch places, ranking 2nd and 3rd respectively.
However, optimizing online adoption and the travel policy drop to 7th and 8th place as travel managers in this region make
a higher priority of developing key performance indicators and enhancing the traveler experience (in 4th and 5th place).
(See Figure 4 on Page 9.)
Compared with other regions, travel managers in Latin America intend to place more focus on:
Implementing advance booking rules and tightening rental car policy (to drive air and ground savings)
Introducing mandates on preferred hotels (to optimize hotel spend)
Tracking changed/cancelled bookings and related costs (as key performance indicators)
Offering traveler profile management tools (to enhance the traveler experience)
And less focus on:
Introducing measures to optimize the rail program, in view of the limited offering in this region (to drive ground savings)
Implementing social media tools (to enhance the traveler experience)
Figure 9
Latin America key indicators (air)
Average ticket price in economy class
Domestic US$269
Continental US$824
Intercontinental US$1,403
Average ticket price in business class
Continental US$1,857
Intercontinental US$4,581
Intercontinental flights booked in business class 25%
Flights booked at least 14 days in advance
Domestic 22%
Continental 36%
Intercontinental 55%
Source: CWT Travel Management Institute
Based on tickets booked by CWT clients (Q3 2012)
14Figure 10
Top priorities and planned measures for travel managers in Latin America
2013
Ranking Priority Planned measures Respondents*
Driving air Concentrate volume on a limited number of suppliers 58%
and ground
1 transportation
Work with airline alliances 47%
savings Implement advance booking rules 42%
Mandate the use of preferred hotels 77%
Optimizing
2 hotel spend
Consolidate hotel spend on fewer properties to leverage larger volumes in negotiations 50%
Negotiate amenities (e.g., Internet, breakfast and parking) 50%
Improving Actively remind employees of policy 72%
3 traveler
compliance
Communicate and provide training on travel policy 64%
Engage management throughout the organization 60%
Modified/cancelled booking and related costs 77%
Developing
4 KPIs Missed air savings (vs. lowest logical airfares) 46%
Average ticket price evolution and benchmarking 41%
Enhancing the Offer mobile services 55%
5 traveler experience Offer traveler profile management tool 41%
* Percentage of respondents who selected the planned measure having cited the corresponding priority in their top five
Source: CWT Travel Management Institute
Based on a survey of 44 travel managers in Latin America (November 2012)
Travel Management Priorities for 2013 | 15North America
In North America, travel managers’ top priority is improving traveler compliance, which pushes driving air and ground
transportation savings to 2nd place. Their 3rd, 4th and 5th priorities match the results of the total sample: optimizing hotel
spend, online adoption and the travel policy. (See Figure 4 on Page 9.)
Compared with other regions, travel managers in North America intend to place more focus on:
Negotiating multi-year contracts and implementing flexible, dynamic negotiations with suppliers throughout the year
(to drive air savings)
Extending the geographical scope of the travel program and standardizing processes (to further consolidate the travel
program)
Leveraging technology (to tackle meetings and events)
And less focus on:
Finding the right balance between negotiated and restricted fare usage (to optimize air and ground savings)
Implementing advance booking rules (to optimize hotel spend)
Defining criteria for using travel alternatives (to optimize the travel policy)
Figure 11
North America key indicators (air)
Average ticket price in economy class
Domestic US$562
Continental US$761
Intercontinental US$1,567
Average ticket price in business class
Continental US$2,410
Intercontinental US$6,055
Intercontinental flights booked in business class 37%
Flights booked at least 14 days in advance
Domestic 47%
Continental 56%
Intercontinental 66%
Source: CWT Travel Management Institute
Based on tickets booked by CWT clients (Q3 2012)
16Figure 12
Top priorities and planned measures for travel managers in North America
2013
Ranking Priority Planned measures Respondents*
Actively remind employees of policy 76%
Improving Engage management throughout the organization 64%
1 traveler
compliance Communicate and provide training on travel policy 58%
Track and communicate compliance levels 58%
Concentrate volume on a limited number of suppliers 46%
Driving air
and ground Negotiate multi-year contracts and implement flexible, dynamic negotiations with
2 transportation suppliers throughout year 46%
savings
Tighten the air policy (class of travel, connecting flights, advance booking, etc.) 42%
Negotiate amenities (e.g., Internet, breakfast and parking) 49%
Optimizing Consolidate hotel spend on fewer properties to leverage larger volumes in negotiations 47%
3 hotel spend Mandate the use of preferred hotels 45%
Request last-room availability (LRA) agreements from hoteliers 41%
Enhance communication/training 71%
Optimizing
4 online Track and communicate online booking tool (OBT) usage 60%
adoption Encourage travel counselors to steer travelers to the OBT 44%
Address advance purchase behavior 52%
Optimizing
5 the travel policy
Standardize the policy regionally or globally 50%
Aim for best-in-class travel policy guidelines 47%
Enhancing
6 the traveler
experience
Offer mobile services 62%
* Percentage of respondents who selected the planned measure having cited the corresponding priority in their top five
Source: CWT Travel Management Institute
Based on a survey of 253 travel managers in North America (November 2012)
Travel Management Priorities for 2013 | 17Global travel managers
Like travel managers in North America and Asia Pacific, global travel managers make improving traveler compliance their top
priority for 2013, followed by driving air and ground transportation savings. Online adoption and hotel spend are their
next main areas of focus, followed by consolidation, which comes higher in their list of priorities compared to the total sample
(5th vs. 7th). (See Figure 4 on Page 9.)
Compared with country/regional travel managers, global travel managers intend to place more focus on:
Implementing traveler messaging tools (to improve compliance)
Negotiating point-of-origin pricing and introducing more mandates (to drive air transportation savings)
Globalizing volumes and contracts, and consolidating sourcing (to further consolidate the travel program)
Implementing a wider range of measures (to support all priorities)
And less focus on:
Tightening the travel policy (to optimize air and ground savings)
Tracking changed/cancelled bookings and the related costs (to drive air savings)
18Figure 13
Top priorities and planned measures for global travel managers
2013
Ranking Priority Planned measures Respondents*
Engage management throughout the organization 79%
Track & communicate compliance levels 75%
Improving
1 traveler compliance
Actively remind employee of policy 66%
Communicate & provide trainings on travel policy 53%
Implement traveler messaging tool (CWT Program Messenger) 53%
Concentrate volume on a limited number of suppliers 69%
Driving air
Work with airline alliances 63%
and ground
2 transportation Negotiate point-of-origin pricing 46%
savings
Negotiate multi-year contracts and implement flexible, dynamic negotiations with suppliers
46%
throughout year
Review and update online booking tool (OBT) configuration/settings periodically 75%
Optimizing Enhance communication/training 72%
3 online
Enhance OBT features 64%
adoption
Track and communicate OBT usage 64%
Consolidate hotel spend on fewer properties to leverage larger volumes in negotiations 51%
Optimizing
4 hotel spend
Mandate the use of preferred hotels 49%
Negotiate amenities (e.g., Internet, breakfast and parking) 49%
* Percentage of respondents who selected the planned measure having cited the corresponding priority in their top five
Source: CWT Travel Management Institute
Based on a survey of 63 global travel managers (November 2012)
Travel Management Priorities for 2013 | 192013 business travel trends from A to Z
The following table shows the cross-over between travel managers’ priorities and key market trends for 2013.
Survey results and commentary are included in the A-Z of trends as described on Pages 21-72.
Figure 14
Travel managers’ priorities and key industry trends at a glance
rience
ents
ption
urity
n
s & ev
r expe
t
d
lidatio
policy
nmen
& sec
liance
g r oun
e ado
ng
ies
e
Conso
Enviro
Comp
Safety
Travel
Travel
Onlin
Hotel
Meeti
Priorit
Air &
KPIs
Page
Trends
A - Ancillary fees 21
B - Brazil, India and China 24
C - Carbon emission trading 30
D - Duty of care 32
E - Expense management 34
F - Foggy economic outlook 35
G - Game techniques 37
H - Hotel reviews 39
I - Inflation 41
J - Joint agreements 44
K - KPIs 47
L - Low-cost carriers 49
M - Meetings and events 52
N - New virtual agents 54
O - Online usage 55
P - Packed planes 56
Q - Quick quiz 57
R - Rail travel 58
S - Social media 61
T - Technology 62
U - Unmanaged travel programs 64
V - Visa regulations 67
W - Well-being 69
X Y - Gen X&Y 70
Z - Zhōng Guó (China) 72
Source: CWT Travel Management Institute
20A ncillary fees on top of fares and rates will be
watched closely by travel managers in all areas of the
travel program and leveraged in negotiations.
Air & ground Compliance Hotel Travel policy KPIs
CWT estimates that ancillary fees account for 5-10 percent of the corporate air budget2 and can add up to 33 percent to the cost of
a hotel stay.3 Car rental “extras” on top of daily or weekly rates can also be significant. More travel managers are therefore looking
beyond fares and rates to effectively manage the total cost of travel.
How to tackle ancillary spend?
Three main areas are likely to capture more attention:
Clarifying the policy on ancillary fees. In a previous CWT survey4 only 35 percent of surveyed travel managers said their
travel policy included a special section on ancillary fees. At the very least, companies need to let travelers know which fees are
reimbursable, but they can also distinguish between different traveler categories (e.g., by allowing frequent travelers to claim
reimbursement for airport lounge access). These policy items should be supported by regular communications to travelers.
Tracking ancillary spend. CWT’s survey of travel managers’ priorities reveals that nearly one in two global travel managers
(46 percent) intend to monitor ancillary spend. But how? Until more ancillary fees are booked through global distribution systems
(see Page 23), expense reports and credit card figures will remain the best sources of data on ancillary spend. Travel management
companies can provide support with tracking, spend estimates and data analysis, enabling clients to monitor program performance
on both the traveler and airline sides.
Negotiating ancillary fees with suppliers. Forty-four percent of all surveyed travel managers intend to negotiate hotel amenities
to optimize spend, while 34 percent of global travel managers plan to negotiate fuel surcharges and other ancillary fees to drive
savings in air and ground transportation. Companies can ask suppliers to provide information on ancillary fees so they can more
accurately compare competing offers, and this can lead to better discounts or even waived fees and improved conditions for
travelers. For example, some CWT clients with large spend volumes have successfully negotiated frequent flyer perks (e.g., lounge
access and priority boarding) for all their travelers.
A major source of revenues for suppliers
This focus on ancillary fees is particular important given that suppliers seem in no hurry to reintegrate them into basic prices.
Some airlines have introduced fare bundles that include selected ancillary services. (One of the latest examples is American
Airlines, which in December 2012 launched optional “Choice Essential” and “Choice Plus” packages offering one free checked
bag and waived ticket change fees along with other services.) Generally speaking, however, ancillary fees continue to be a major
source of revenues for suppliers:
The U.S. hotel industry is expected to record a 3.5 percent year-on-year increase in 2012 revenues from amenity
fees (e.g., Internet, telephone, business center access and resort fees), reaching an estimated US$1.95 billion according
to a forecast by New York University.5 The report suggests the increase comes less from new types of fees than higher
charges for the same services and increased volume.
2
CWT Travel Management Institute, Mastering the Maze: A Practical Guide to Air and Ground Savings (2012)
3
CWT Travel Management Institute, Room for Savings: Optimizing Hotel Spend (2009)
4
See Footnote 2
5
Bjorn Hanson, Divisional Dean of New York University’s Preston Robert Tisch Center for Hospitality, Tourism and Sports Management, Trend Analysis Report (August 2012)
Travel Management Priorities for 2013 | 21Global airline ancillary revenues are also increasing but holding quite steady as a proportion of all revenues, at 5.4
percent in 2012 vs. 5.6 percent in 2011 according to a forecast by global distribution system provider Amadeus.6 Globally,
ancillary fees are expected to bring in US$36.1 billion in 2012, with the strongest revenue increases in Latin America and
the Caribbean; the Middle East and Africa; and Asia Pacific.
Airlines continue to evolve their offering by adding new ancillary services, with recent announcements including
onboard Wi-Fi on some U.S. carriers’ international flights, and a “no-show fee” reportedly in the works for Southwest’s
restricted tickets.
Two “classic” fees (checked bags and cancellation fees) still represent airlines’ largest ancillary revenues. Amadeus
reports for example, that these two charges represented 65 percent of total ancillary revenue at Delta Air Lines and
52 percent at American Airlines in 2011.
Fuel surcharges appear to be a new source of revenue for many airlines, having become disconnected from actual fuel
costs. According to CWT transaction data, fuel surcharges have risen on all kinds of flights, especially intercontinental, since
first quarter 2012, even when oil prices have dropped or stabilized. The trend is particularly marked on domestic routes, as
shown in Figure 15. As yet, few companies consider fuel surcharges a negotiable item, but they may want to bring them to
the negotiating table with airlines. Their travel management company can help in tracking fuel surcharges and ancillary fees
in general.
Figure 15
Fuel surcharges appear somewhat disconnected to oil price trends
Notes:
This chart encompasses all classes of service for network carriers based in every region of the world. 12 carriers were included in 2011 and 19 in 2012.
Values have been recalculated using flat exchange rates to eliminate artificial price variations.
Source: CWT, based on Amadeus and U.S. Energy Information Administration data
6
Amadeus/IdeaWorks, Amadeus Worldwide Estimate of Ancillary Revenue for 2012 (August 2012)
22Airline ancillary fee distribution: still a work in progress
Two problems typically faced in the corporate air travel program are knowing how ancillary fees compare between airlines
and impact the cost of travel, and how to track traveler spend on ancillary fees when they are paid as separate expenses
rather than included in the fare.
For the moment, airlines do not systematically make ancillary fees and packages available in global distribution systems
(GDSs). The issue is not so much that the technology is unavailable but that the industry needs to agree on standards,
and in particular, airlines need to provide the content without discrimination across all distribution channels.
A number of initiatives look promising although the desired changes will not happen overnight:
More airlines will be equipped technologically to enable e-ticketing of ancillary services via an “electronic
miscellaneous document” (EMD). This system, developed under the leadership of the International Air Transport
Association (IATA), enables ancillary fee data to be included in IATA’s billing and settlement system. IATA’s objective
is for all commercial carriers to be EMD-capable by the end of 2013. However, to be useful to corporate buyers,
this system must be adopted for airline sales through GDSs. Carriers are only just starting to use the capability. (See
below.)
Airlines have begun to provide more ancillary products through GDSs. For example, in 2012, Delta Air Lines
reached agreements to sell Economy Comfort (extra legroom) through the Amadeus and Travelport GDSs, while
US Airways began selling ChoiceSeats (preferred seating assignments) through Sabre, initially without enabling
EMDs. Air France adopted Amadeus’s solution to distribute its SeatPlus seating on long-haul flights and enable travel
counselors to use EMD for tracking and fulfillment.
U.S. airlines may be required by law to display ancillary fees through all sales channels if the U.S. Department
of Transportation includes this measure in new rules expected in May 2013. Its controversial “Enhancing Airline
Passenger Protections III” regulation has already been postponed several times.
IATA is pushing ahead with a New Distribution Capability (NDC) aimed at providing airlines with identical
capabilities across all sales channels and greater consistency for clients. Basically, the system would involve
GDSs accessing content directly from participating airlines through shared application programming interface (API)
technology. Although this technology already exists—it is used, for example, to access content from some low-cost
airlines—the aim is to implement a more powerful and efficient industry-wide standard that would support product
differentiation and customization (e.g., optional service packages). Participation is optional, but airlines and GDSs
must choose to cooperate for IATA to achieve its aims.
Travel Management Priorities for 2013 | 23B
razil, India and China will continue driving growth
in business travel spend, at around twice the world
average.
Air & ground Hotel Online adoption
Global business travel spending is expected to grow by 8.1 percent7 in 2013, at just over twice the forecast rate of economic growth
(3.6 percent).8 However, business travel spending will grow at two speeds: slower overall in developed countries (mostly well
under 5 percent), and much faster (double-digit growth) in some developing countries. Three countries in particular stand out: India
(21.5 percent forecast growth), China (14.7 percent) and Brazil (12.6 percent). Some of their key features are described here.
Figure 16
Forecast global business travel spending (US$ billions)
2012 2013 % change
1 United States 254.9 266.7 +4.6%
2 China 194.8 223.6 +14.7%
3 Japan 66.2 67.4 +1.8%
4 Germany 50.8 52.5 +3.3%
5 United Kingdom 40.2 41.3 +2.8%
6 France 35.7 36.1 +1.1%
7 Italy 32.9 32.5 -1.2%
8 Korea 31.1 34.7 +11.8%
9 Brazil 30.1 33.9 +12.6%
10 Canada 22.5 23.1 +2.3%
11 India 22.4 27.2 +21.5%
12 Australia 21.7 22.7 +4.6%
13 Russia 22.1 23.8 +7.8%
14 Spain 17.9 17.6 -1.6%
15 Netherlands 18.5 18.9 +2.2%
Source: GBTA Foundation, GBTA BTI Outlook ( July 2012, September 2012, October 2012, January 2013)
7
GBTA Foundation, GBTA BTI Outlook Annual Global Report and Forecast, Prospects for Global Business Travel 2012-2016 (July 2012)
8
International Monetary Fund, World Economic Outlook (October 2012)
24Brazil
Projected business travel spend in 2013: US$ 33.9 billion (+12.6 percent vs. 2012)
The world’s 6th largest economy
Population: 199 million
16 cities with more than 1 million inhabitants
24 percent of the population aged under 15
6.5 percent estimated unemployment (2013)
Sources: International Monetary Fund, World Economic Outlook (October 2012), Central Intelligence Agency, World Factbook (January 2013), Brazilian Institute
of Geography and Statistics (2012), Population Reference Bureau, World Population Data Sheet (2012)
Brazil’s economy is forecast to grow by 4 percent in 2013, resuming faster growth after slower performance
in 2012 and 2011 (1.5 percent and 2.7 percent respectively, compared to 7.5 percent in 2010, according to the
International Monetary Fund).
The country boasts a highly dynamic airline industry, with many recent mergers and changes in global alliance
membership:
Avianca-TACA merged in 2009 and entered Star Alliance in 2012
GOL announced the decision to drop the Webjet brand name in 2012 after receiving final approval for its
merger with the carrier
Azul and Trip announced their intended merger in 2012
TAM, newly merged with LAN, announced it would leave Star Alliance (without confirming it would join LAN in
oneworld)
Figure 17
Market share in Brazil’s domestic aviation market
1% 5% 5% 9% 5% 35% 40%
ca
t
L
M
Av do
IP
ul
bje
GO
Az
TA
TR
ian
are
We
ss
Pa
Source: ANAC – National Civil Aviation Agency of Brazil (October 2012)
Capacity and traffic are set to grow in 2013 especially in the domestic market, despite a slowdown in the second
half of 2012. New entrants will continue to expand rapidly although perhaps taking less market share away from newly-
merged leaders TAM and GOL than in previous years.
Travel Management Priorities for 2013 | 25There is no strong distinction between low-cost carriers and network carriers in Brazil.
Hotels are experiencing an upward trend in occupancy despite a slowdown in 2012. Brazil reportedly has the
most rooms under construction (3,831) in the Central/South America region.9 About 50 percent of available hotels
are independent.
A high proportion of travel content is unavailable in global distribution systems, although airlines are progressively
reintroducing content. (In 2005, the country’s two largest carriers, TAM and GOL, pulled all of their domestic content
out of GDSs, in effect removing 90 percent of Brazil’s inventory.)
Online adoption among Brazilian companies is being driven by online booking tools specifically developed for the
market, given the fragmentation of content.
Credit cards are widely accepted for travel in Brazil, which is not the case of all Latin American countries.
A high-speed rail network is in the pipeline, with several routes planned: Campinas–Sao Paulo–Rio de Janeiro,
Brasilia–Goiania, Belo Horizonte–Curitiba, and Ribeirao Preto–Uberlandia. The project is still in the planning stage,
however, with no firm launch dates yet.
CWT forecasts low to high price increases for Brazilian business travel in 2013, depending on the category:
Air: +1.6 percent to +6.1 percent
Hotel: +13.1 percent to +14.8 percent
Car: +2.3 percent to +3.4 percent
9
STR Global, Global Development Pipeline Report (September 2012)
26India
Projected business travel spend in 2013: US$27.2 billion (+21.5 percent vs. 2012)
The world’s 10th largest economy
Population: 1.20 billion
53 cities with more than 1 million inhabitants
31 percent of the population aged under 15
9.8 percent estimated unemployment (2011)
Sources: International Monetary Fund, World Economic Outlook (October 2012), Central Intelligence Agency, World Factbook (January 2013), Population
Reference Bureau, World Population Data Sheet (2012), Office of the Registrar General and Census Commissioner, India (2011)
India’s GDP is expected to grow by 6 percent in 2013, compared to 4.9 percent (forecast) in 2012, 6.8 percent in
2011 and 10.1 percent in 2010.
Given this strong GDP growth, combined with a young population and expanding middle class, the country’s
aviation market is likely to remain among the world’s fastest growing over the coming decades. However,
carriers such as Kingfisher and Air India are struggling to maintain profitability in a predominately low-cost market.
(Budget airlines account for more than 60 percent of domestic business.) One key issue is fuel prices being kept
artificially high by government regulation.
Figure 18
Indian carriers’ share of the domestic market
3% 6% 7% 18% 19% 19% 28%
lite
ia
ys
Jet
igo
Jet r
Air
e
Ind
sh
wa
Ind
Go
ice
gfi
Air
Air
Sp
Kin
Jet
Source: CWT
Also worth noting:
India’s hotels are expanding faster than in any other Asia Pacific country, with 54,738 rooms10 in the pipeline.
Although India’s rail network is one of the world’s largest in the world, it currently has no high-speed lines.
Several projects are under review for possible construction within the next few years.
The first section of Mumbai Metro, a new mass rapid transit system, is due to open in 2013. Running on a
dedicated elevated rail corridor, the system will link the northern and southern parts of the city, as well as its
suburbs.
Although drivers are not required to hold an Indian driving license, foreigners renting vehicles tend to prefer
hiring a chauffeur to get round the country’s busy roads.
CWT forecasts varied price trends for Indian business travel in 2013:
Air: +0.3 percent to +1.7 percent Car: +2.6 percent to +4.6 percent
Hotel: -3.6 percent to -5.1 percent
10
STR Global, Global Development Pipeline Report (September 2012)
Travel Management Priorities for 2013 | 27China
Projected business travel spend in 2013: US$223.5 billion (+14.7 percent vs. 2012)
The world’s 2nd largest economy
Population: 1.34 billion (July 2012)
90 cities with more than 1 million inhabitants
16 percent of the population aged under 15
4 percent estimated unemployment (2013)
Sources: International Monetary Fund, World Economic Outlook (October 2012), Central Intelligence Agency, World Factbook (January 2013), Population
Reference Bureau, World Population Data Sheet (2012)
China’s economic growth is likely to accelerate again in 2013 at a forecast 8.2 percent, after slowing slightly over
the last few years (from 10.4 percent in 2010 to 9.2 percent in 2011 and a forecast 7.8 percent in 2012).
In line with its booming economy, China’s aviation industry is growing rapidly. More than 90 percent of the
domestic market is shared by four airlines (Figure 19). Three of these (China Airlines, China Eastern and China
Southern, all members of SkyTeam) will fly as a regional alliance in January 2012. SkyTeam remains the largest alliance
in China with 44 percent of the market, compared with Star Alliance’s 20 percent. Chinese low-cost carriers offer flights
mainly on sub-routes with the exception of Spring Airlines, which operates primary domestic routes from its base at
Shanghai Hongqiao International airport.
Figure 19
Chinese airlines’ share of the domestic market
9% 11% 24% 25% 31%
p
p
rs
p
p
ou
ou
ou
ou
he
Gr
Gr
Gr
Gr
Ot
rn
ina
es
rn
e
ste
irlin
Ch
uth
Ea
nA
Air
So
ina
ina
ina
Ch
Ha
Ch
Source: CWT
Chinese high-speed rail has been developing at a remarkable rate, providing an alternative to many air routes
for business travelers. According to the International Union of Railways,11 China will have 742 miles of high-speed
rail in operation and 5,612 miles under construction by 2012, making its network the world’s largest.
11
Source: International Union of Railways, High-Speed Lines in the World (July 2012)
28Also worth noting:
China has the world’s second largest pipeline of hotel rooms under development (214,971 rooms) after the
United States (299,201 rooms).12
Most foreigners renting a car in China also hire a chauffeur since a Chinese driver’s license is required.
Online booking continues to rise.
Credit cards are widely accepted in the region.
Foreign global distribution systems (GDSs) are now authorized to sell non-Chinese airline content, following
the government’s decision in October 2012 to relax regulation. (See Page 72.)
CWT forecasts low price increases for Chinese business travel in 2013:
Air: +0.6 percent to +1.7 percent
Hotel: +0.3 percent to +1.2 percent
Car: +2.1 percent to +3.9 percent
12
STR Global, Global Development Pipeline Report (September 2012)
See Pages 41-43 on inflation in travel prices worldwide.
Travel Management Priorities for 2013 | 29C
arbon emission trading: non-European carriers will be
exempt from the controversial EU Emissions Trading
Scheme until the fall, pending a global agreement
through the International Civil Aviation Organization.
Air & ground
Much has been written about the European Union’s Emissions Trading Scheme (EU ETS) and whether or not airlines from outside
the region should participate, but what does it mean in practice? What impact can travel managers expect to air travel costs in 2013?
What the EU ETS is and why it was introduced
In a nutshell:
The European Commission describes the EU ETS as “a cornerstone of the European Union’s policy to combat climate change
and its key tool for reducing greenhouse gas emissions cost-effectively.”
It is a “cap and trade” system that works by fixing an annual allowance for the total emissions emitted by companies in specific
industries, and requiring any companies exceeding this limit to buy surplus credits from those emitting less.
Companies can trade credits or “bank” them for use at a later date, but the main aim is to encourage businesses to reduce their
carbon footprints by associating them with a financial cost.
From 2013, there will be a single EU-wide cap on emissions and the system of free allowances will gradually be replaced by
auctions.
In January 2012, the scheme opened up to aviation, or more specifically, all airlines operating domestic or international flights arriving
at or departing from EU airports. After a good deal of controversy, however, the European Commission announced in November 2012
that “as a gesture of goodwill” it would defer application of the scheme to flights into and out of Europe until after the fall, pending new
proposals by the International Civil Aviation Organization (ICAO). Meanwhile, the EU ETS will continue to apply to flights in and between
30 European countries (the 27 EU Member States plus Iceland, Liechtenstein and Norway).
Why it is controversial: unfair and illegal or a step in the right direction?
The EU ETS has met with strong reactions from airlines, industry groups and governments:
Opponents argue that the European Commission has unilaterally imposed an extraterritorial tax and that the rules
discriminate against certain airlines (e.g., those operating more carbon-intensive shorter routes, older fleets or flights with lower
passenger occupancy levels). Reportedly, a group of 29 countries lobbied the European Union in 2012 to suspend the EU ETS,
including China, India, Russia and the United States—with an underlying threat of trade war and retaliatory measures such as
reviewing bilateral air agreements, suspending discussions on EU airlines’ operating or landing rights, and imposing additional
charges on EU airlines. The Obama Administration even introduced the “European Union Emissions Trading Scheme Prohibition Act
of 2011” to prevent U.S. airlines from participating in the scheme.
On the other hand, the European Commission maintains that its action does not constitute a tax, which would be in breach
of the EU-U.S. Air Transport Agreement, and that it is compatible with international law, as confirmed by the European Court of
Justice in a case brought by some U.S. airlines and trade associations. Moreover, it is “committed to finding a comprehensive and
non-discriminatory multilateral agreement within the ICAO, and the EU legislation is designed to be amended in the light of such an
agreement.” The European Commission insists that it will reinstate the rules for foreign airlines if “suitable progress” is not made at
the ICAO’s fall General Assembly.
30You can also read