UGANDA'S HOUSING CONSTRUCTION AND HOUSING RENTAL ACTIVITIES
←
→
Page content transcription
If your browser does not render page correctly, please read the page content below
UGANDA’S HOUSING
         CONSTRUCTION AND HOUSING
                  RENTAL ACTIVITIES
       HOUSING ECONOMIC VALUE CHAIN AND
     HOUSING COST BENCHMARKING ANALYSIS

                                                                     August 2020
                                                         HOUSING AND THE
                                                               ECONOMY

DAVID GARDNER, KEITH LOCKWOOD, & JACUS PIENAAR
CONSULTANTS TO THE CENTRE FOR AFFORDABLE HOUSING FINANCE IN AFRICA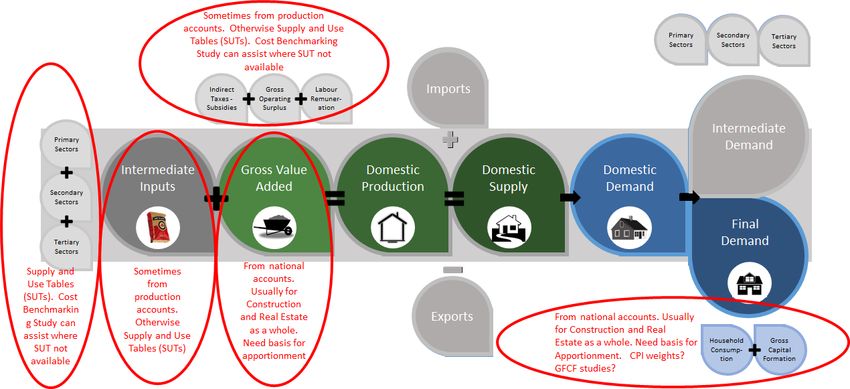
Executive summary
This report uses CAHF’s Housing Cost Benchmarking and Housing Economic Value Chain Modelling
methodologies to analyse the Ugandan housing market. The report provides an overview of the structure of
Uganda’s housing supply and demand for housing and determines the contribution of housing construction and
rental activities to Uganda’s economy. Further, it provides a basis for comparing the costs of constructing
housing in Uganda in relation to housing costs in other African countries. These analyses are used to identify
key areas of Uganda’s housing system that can be improved to maximise the potential production of owned
and rented housing that better matches the demand profile of Uganda’s urban and rural households.
Uganda has a population of 46 million people in 2020, growing at a rate of 3.6 percent a year, making it the
country with the third-highest population growth rate in Africa. Currently, Uganda has a low rate of
urbanisation, with only one quarter of its population living in urban areas. However, with a projected
urbanisation rate of 5.6 percent per annum, Uganda’s urban areas are poised for rapid increases in households
requiring decent, affordable housing. Uganda’s urban households will grow from 2.9 million in 2020 to 3.8
million in 2025—a total increase in housing needed of 180 000 units per annum.
Uganda’s housing agenda is rapidly becoming urban-focused. While the majority of Uganda’s households will
still live in rural areas over this period, the total number of housing units required in urban areas will be greater
than that in rural areas. Unsupported, Uganda’s urban housing needs will be met through a combination of the
following processes: First, through the rapid expansion of basic informal rental housing (such as rooms with
shared or separate ablutions) in informal or slum areas. Second, existing built-up areas will face increased
population densities through more co-living arrangements as households are forced to share housing. Third,
through the extension of existing formally and informally developed housing to accommodate larger or
multiple households. Fourth, through the incremental building of houses by households able to access land,
with or without secure tenure; and finally, through formal housing development, sale and rental. Without
substantial changes to Uganda’s current housing policy and processes, a vast majority of households will
continue to be housed through informal processes.
CAHF’s Housing Economic Value Chain analysis estimates that housing construction and rental activities
contributed a combined output of 11.0 percent of Uganda’s GDP in 2018 at UGX12 135 billion (US$8 460
million). This combined value indicates total GVA of UGX6 430 billion (US$4 308 million) and intermediate
inputs of UGX5 706 billion (US$4 152 million). Seventy-five percent of the intermediate inputs were sourced
from secondary sectors (a majority of which are locally manufactured goods), 22 percent from tertiary sectors
and only 2 percent from primary sectors. Total intermediate inputs were equivalent in value to 5.2 percent of
Uganda’s GDP in 2018, while the direct GVA contribution was 5.8 percent.
In 2018, Uganda invested almost UGX 8 trillion (US$ 2.1 billion) in the construction of housing. Of this, 67
percent comprised intermediate inputs into the construction process and the remaining 33 percent was value
added by construction-related activity. Intermediate inputs into dwelling construction were equivalent to a very
significant 4.8 percent of Uganda’s GDP in 2018, while the gross value added contributed a further 2.4 percent.
The relative economic impacts of housing construction in Uganda are substantially greater than in South Africa,
where intermediate inputs into housing construction were equivalent to 1.2 percent of GDP in 2018 and the
GVA only contributed 0.5 percent of GDP. This shows the very important impact that housing construction has
on a developing economy such as Uganda.
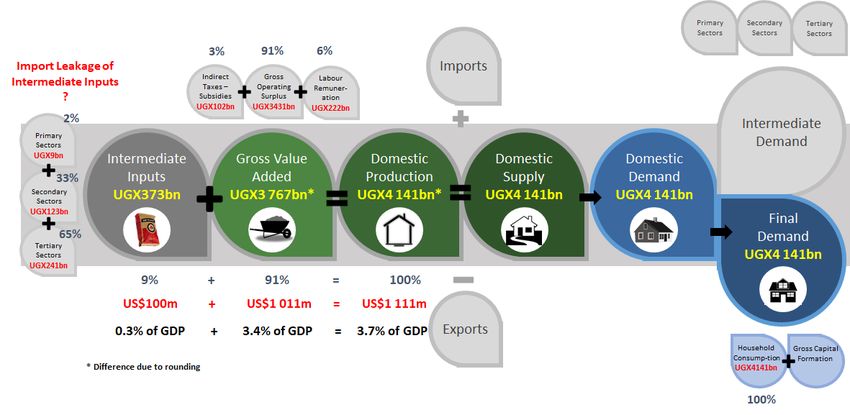
The total economic value added from residential rental services was UGX 4.1 trillion (US$ 1.1 billion), comprising
9 percent intermediate inputs of UGX 373 billion (US$ 100 million) and 91 percent gross value added of UGX 3.7
trillion (US$ 1 billion). This relatively under-developed rental sector is due to the relatively small proportion of
urban households that rent (29 percent), as well as to the under-developed nature of the rental sector, where
most rentals are provided by small-scale and household landlords.
CAHF’s Housing Cost Benchmarking methodology defines six key housing typologies and size configurations,
specifies their design and completes a detailed cost breakdown for Kampala, Uganda. Comparing the cost of a
standard 55m2 house in Kampala against major cities in five African countries,1 the cost benchmarking shows
that Kampala has the third-highest construction cost (US$58 596) after Pretoria, South Africa (US$40 199) and
1From lowest to highest estimated cost: Pretoria, South Africa; Lagos, Nigeria; Kampala, Uganda; Dodoma, Tanzania and
Nairobi, Kenya.
UGANDA’S HOUSING CONSTRUCTION AND HOUSING RENTAL ACTIVITIES | AUGUST 2020 ii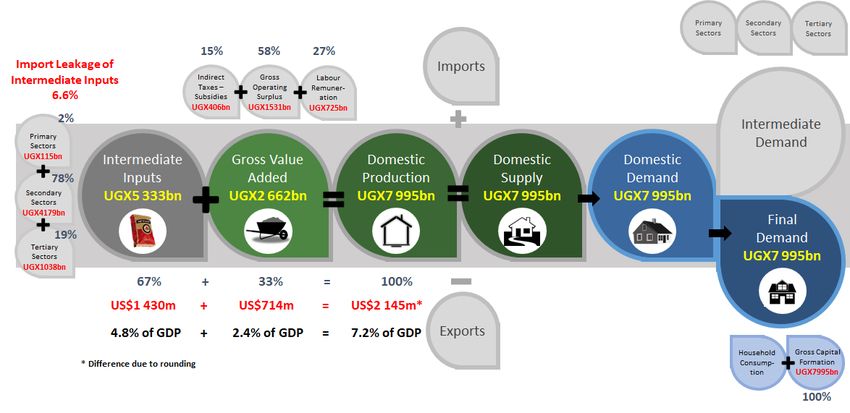
Lagos, Nigeria (US$52 103). Building the standard house in Kampala is 46 percent more expensive than in
Pretoria, while in Nairobi (the most expensive of the five cities) it is 11 percent more expensive than Kampala.
In total, 43 percent (US$25 092) of the total cost of developing this standard house is for construction-related
inputs, showing that 57 percent of the total cost of developing such a house is for other cost items. The next
largest cost categories are infrastructure (14 percent / US$8 102); VAT (14 percent / US$8 450); developer
overhead (10 percent / US$5 790); other development costs (7 percent / US$4 178); compliance costs (7 percent
/ US$3 820) and then land cost (5 percent / US$3 165). When comparing the costs of different housing typologies
(smaller detached houses and medium and higher-rise units), multi-storey typologies increase average
construction costs (with higher buildings requiring higher-specification construction and fittings such as
elevators and emergency exits). However, there are significant savings on land and infrastructure costs that
substantially offset the construction cost increases.
While Uganda’s housing development costs are in the mid-range of five countries benchmarked in sub-Saharan
Africa, this analysis shows significant potential for reducing overall housing development costs in Uganda.
Construction costs alone are 51 percent higher than in Pretoria, South Africa and all other major cost categories
have potential for cost reductions through minimising relatively high input costs, as well as reducing process
and holding costs incurred due to delays in the development process.
This analysis highlights the opportunity for Uganda to create a more orderly response to the rapid urbanisation
it will face in the future, given its relatively low current rates of urbanisation and current high levels of economic
growth. However, the rapid urbanisation in Uganda’s urban centers (and specifically in Kampala and Entebbe)
in the future will result in important shifts in the housing sector. This urban housing challenge will require
different responses to what has been implemented in the past if Uganda is to successfully guide and manage
urban growth and housing development.
Uganda’s housing market already plays a critical and substantial role in its economic growth and sectoral
diversification and should be an even greater contributor to Uganda’s economic growth and social prosperity
in the future. The housing economy provides an excellent, sustainable market for locally manufactured goods
and local services. However urgent attention needs to be given to the ability of Uganda’s local manufacturing
and services sectors to support and grow local housing construction demands in the future, as well as its
potential to improve its international competitiveness as a building materials exporter.
A better-functioning housing sector has diverse and interlinked benefits. First, it focuses household
expenditure on investment-oriented activities. Housing payments create long-term fixed investments in the
country’s economy by ordinary households and build housing stock that generates regular income streams
from real estate or focuses household income in assets that would otherwise be spent on rental.
Investments in housing grows Uganda’s gross fixed capital formation – the economy’s engine of production.
Houses are not only used for shelter but also to produce rental income, and stimulate regular consumption of
other goods and services. Housing construction also reaches deeply into Uganda’s upstream secondary
(manufacturing and construction) and tertiary (services) economic sectors by stimulating demand for mostly
locally produced value-added products and services.
But this is not where the economic impact of housing ends. The demand for more and better housing and other
goods and services are further enhanced through the growth in incomes of developers, contractors, landlords,
goods and services suppliers and the high number of employees that receive wages and profits from the
construction and rental of housing. And finally, a well-managed housing sector yields important increases in
government revenue from taxation, levies and regular service charges and property rates.
If all of these interrelated economic benefits from a growing housing sector are realised, they offer an
opportunity for economic and social development unsurpassed by any other economic sector. Uganda’s early-
stage urbanisation and new housing policy offer an important point at which strategies and sectoral
interventions can be developed and implemented at scale to influence its housing future. Such an opportunity
cannot be squandered. However, in order to meet the current and future housing needs of urban households,
Uganda will need to design and implement more comprehensive and targeted strategies in the housing sector,
as well as for sectors that directly support housing. Six core strategic areas are identified that Uganda must
address for the housing sector to keep pace with rapid urbanisation.
Strategy 1: Scale and deepen affordable housing supply. Uganda needs to ensure a better match between
housing supply and the real effective demand for housing of households. This requires greater down-market

 UGANDA’S HOUSING CONSTRUCTION AND HOUSING RENTAL ACTIVITIES | AUGUST 2020                                        iii
focus on producing basic housing products, as well as initiatives that improve the ability of households to access
the basic requirements for self-construction, such as secure tenure over land, basic infrastructure and access to
building inputs. This will require a shift in investment patterns by government and others in the housing sector
to support as many households into the housing sector as possible, and to ensure informal construction is
supported and recognized as the most important delivery system in the country.
Strategy 2: Strengthen local development and construction capacity. Creating stability in the local housing
construction sector is important to ensure sustainable housing development. In addition, support to and
development of Uganda’s local construction industry is required to improve business, professional and
technical skills in development and construction. Further, providing certainty in the housing sector in a way that
encourages participation of local and expatriate developers in Uganda’s housing market is key. Developing
housing is a multi-year process, and political, economic and policy certainty is critical to the sector’s success in
scaling up to meet demand.
Strategy 3: Build intermediate input capacity into the housing sector. Building a strong local manufacturing
sector is critical to sustainable housing construction. A strategy to strengthen the development of intermediate
inputs into construction in Uganda is urgently required, both to feed into its local housing development sector
as well as to encourage exports of manufactured building materials.
Strategy 4: Stimulate household effective demand for housing. Maintaining strong economic growth will be
the major stimulus for better housing affordability across the population of Uganda. In addition, Uganda’s
housing finance sector must continue to be developed to support the provision of more and better-designed
financial products enabling households to access housing. This includes end-user finance products, as well as
improved capital markets and targeted state engagement in the housing market to overcome effective demand
blockages, such as through the provision of access to basic serviced land.
Strategy 5: Improve programme and project implementation and sector monitoring. The implementation
of a coherent, inclusive programme for housing development in line with the new housing policy is required to
enhance housing outcomes across the income spectrum. This will need to be based on solid information and
analytics that continue to improve Uganda’s relatively solid data on its economy. Specifically, greater
information is required around its housing and finance markets to assist investors to understand and respond
to specific conditions in the Ugandan market.
Strategy 6: Improve the housing and real estate investment climate. Improving economic conditions will
continue to generate interest in Uganda’s housing sector. Macroeconomic stability and stable capital markets
will assist to encourage local and international investors to seek safe investment opportunities in housing
construction and rental markets in Uganda. To support this, a housing education and awareness campaign must
assist to develop a better understanding of housing and housing finance markets amongst consumers
themselves.

 UGANDA’S HOUSING CONSTRUCTION AND HOUSING RENTAL ACTIVITIES | AUGUST 2020                                      iv

Contents
Acknowledgements ...................................................................................................................................... viii
Glossary .......................................................................................................................................................... ix
Note on exchange rates ................................................................................................................................. xii
1 Introduction ............................................................................................................................................... 13
2 The context to Uganda’s housing market ................................................................................................... 14
   2.1          Demographic trends ..................................................................................................................... 14
   2.2          Economic and income trends ........................................................................................................ 16
       2.2.1        Income trends ........................................................................................................................... 16
       2.2.2        Relative sector performance and economic composition .......................................................... 17
       2.2.3        Levels of informal economic activity in Uganda ......................................................................... 20
3 Exploring residential housing construction and rental activities in Uganda ................................................. 22
   3.1      The theory of Housing Economic Value Chains .................................................................................. 23
   3.2          Data required to analyse Housing Economic Value Chains ............................................................. 25
   3.3      The Housing Construction Value Chain in Uganda ............................................................................. 27
       3.3.1        Employment in housing construction in Uganda ....................................................................... 30
       3.3.2        Uganda’s international trade in building materials .................................................................... 30
   3.4          Economic activities arising from the letting of residential housing in Uganda ................................ 33
       3.4.1        Employment in housing rental and related activities ................................................................. 35
   3.5 The combined contribution of housing construction and housing rental-related activities to Uganda’s
   economy .................................................................................................................................................... 35
   3.6          Comparing the impact of housing on selected sub-Saharan economies......................................... 36
4 Analysing Uganda’s housing market ........................................................................................................... 38
   4.1          Household income distribution ..................................................................................................... 38
   4.2          Housing market ‘pyramid’ ............................................................................................................. 40
   4.3          Housing tenure.............................................................................................................................. 41
   4.4          Housing affordability ..................................................................................................................... 42
   4.5          Housing supply .............................................................................................................................. 43
   4.6          Matching supply and demand ....................................................................................................... 45
5 Housing cost benchmarking ....................................................................................................................... 45
   5.1      Overview of housing cost benchmarking ...........................................................................................46
   5.2          Benchmarking housing development costs for Kampala, Uganda .................................................49
   5.3      Housing cost breakdown for Kampala, Uganda ................................................................................. 50
   5.4          Comparing housing cost components across five countries ........................................................... 51
   5.5          Comparing costs of six housing typologies in Kampala, Uganda .................................................... 54
6 Conclusions and recommendations ............................................................................................................ 56
   6.1          Key conclusions ............................................................................................................................. 56
   6.2          Recommendations ........................................................................................................................ 57

  UGANDA’S HOUSING CONSTRUCTION AND HOUSING RENTAL ACTIVITIES | AUGUST 2020                                                                                       v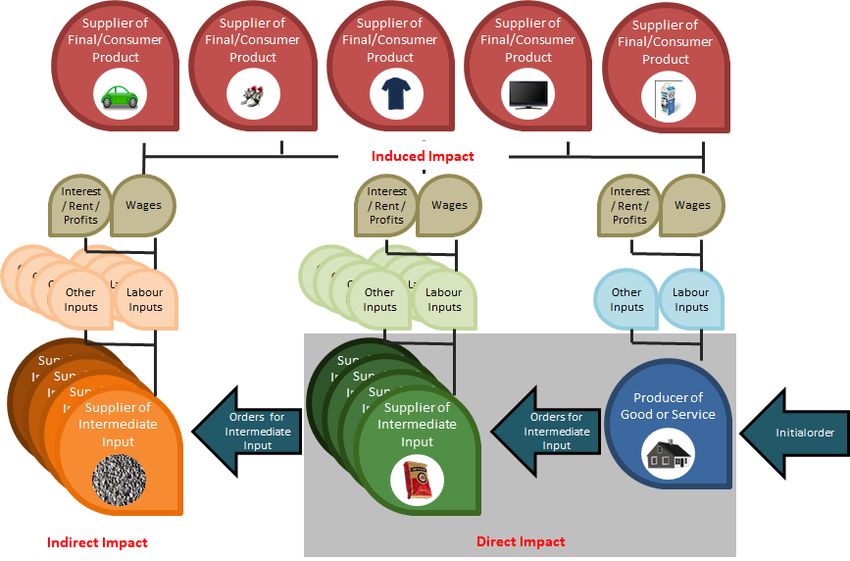
6.2.1 Strategy 1: Scale and deepen affordable housing supply ........................................................... 58
6.2.2 Strategy 2: Strengthen local development and construction capacity ....................................... 59
6.2.3 Strategy 3: Build intermediate input capacity for the housing sector .........................................60
6.2.4 Strategy 4: Stimulate household effective demand for housing ................................................60
6.2.5 Strategy 5: Improve programme and project implementation and sector monitoring ............... 61
6.2.6 Strategy 6: Improve the housing and real estate investment climate ......................................... 61
6.3 Conclusion: Using housing to drive Uganda’s social and economic growth .................................... 61
References ..................................................................................................................................................... 63
Annexure A: Housing cost benchmarking CAHF house specification .............................................................. 65
Annexure B: Detailed results of revealed competitive advantage analysis of Uganda’s exports of building
materials ........................................................................................................................................................ 70
List of tables
Table 1: Composition of gross fixed capital formation by type of asset (2013-2018) ........................................ 28
Table 2: Revealed competitive advantage of Uganda's exports of building materials ..................................... 32
Table 3: Uganda’s trade in building materials in 2018 ..................................................................................... 32
Table 4: The value of housing real estate output and its composition ............................................................. 33
Table 5: Per capita GDP at PPP and per capita spending on housing construction and housing rental at PPP . 37
Table 6: Uganda’s rural and urban population by income group (2019) ........................................................... 39
Table 7: Uganda rural and urban population growth per income group (during 2018) ..................................... 39
Table 8: Estimated housing affordability in Uganda (2018) ............................................................................. 43
Table 9: Housing cost benchmarking of six housing typologies and total costs (2019) .................................... 47
Table 10: Level 1 and Level 2 costing categories ............................................................................................. 47
Table 11: Example of five level cost breakdown – finishing, labour and materials ........................................... 48
List of figures
Figure 1: Components of the analysis ............................................................................................................. 13
Figure 2: Estimated total and additional households in Uganda (2020-2025).................................................. 15
Figure 3: Comparative trends in per capita GDP at purchasing power parity ................................................... 16
Figure 4: Comparative levels of per capita GDP at purchasing power parity across a number of African countries
(2018) ............................................................................................................................................................ 17
Figure 5: Relative trends in real GDP of the major sectors of Uganda’s economy (2008-2018) ........................ 18
Figure 6: Sector composition of Uganda’s real GDP ....................................................................................... 19
Figure 7: Sector contributions to real GDP growth between 2013 and 2018 .................................................... 20
Figure 8: Contribution of informal activity to national income across different African countries ................... 21
Figure 9: Informal economy contributions to sector GDP (2018) ..................................................................... 22
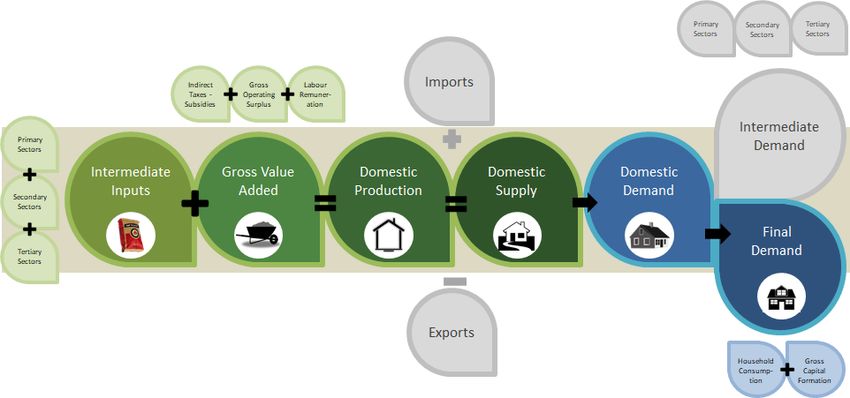
Figure 10: The Housing Economic Value Chain ............................................................................................... 24
UGANDA’S HOUSING CONSTRUCTION AND HOUSING RENTAL ACTIVITIES | AUGUST 2020 vi
Figure 11: The different impacts of a sales stimulus on the economy .............................................................. 25
Figure 12: The composition of construction value added and contribution of formal and informal activity (2013-
2018).............................................................................................................................................................. 28
Figure 13: Estimated economic value chain for housing construction in Uganda in 2018 ................................. 29
Figure 14: Sector composition of total employment and number employed in 2016/17 .................................. 30
Figure 15: High-level overview of revealed competitiveness analysis of Uganda's trade in building materials . 31
Figure 16: Estimated economic value chain for housing rental activities in Uganda in 2018 ............................ 34
Figure 17: Formal and informal contribution to real estate gross value added (2008-2018) ............................. 35
Figure 18: Estimated combined impact of housing construction and housing rental and related activities on the
Ugandan economy in 2018 ............................................................................................................................. 36
Figure 19: Per capita spending on housing construction and housing rental at PPP expressed as a percentage of
GDP per capita at PPP .................................................................................................................................... 37
Figure 20: Notional household income pyramid versus actual income distribution for 2019 ........................... 40
Figure 21: Notional household tenure distribution in Uganda for 2019 ........................................................... 41
Figure 22: Cost comparison of the standard CAHF house (2019)..................................................................... 50
Figure 23: Cost breakdown of the standard CAHF house in Kampala, Uganda (2019) ..................................... 51
Figure 24: Comparison of cost of standard CAHF house between countries (2019) ......................................... 52
Figure 25: Comparative unit costs (US$) of six housing typologies in Kampala, Uganda (2019) ...................... 54
Figure 26: Comparative costs of different housing typologies in Kampala, Uganda (2019) ............................. 55
Figure 27: Strengthening Uganda’s Housing Economic Value Chain – six focus areas ..................................... 58

  UGANDA’S HOUSING CONSTRUCTION AND HOUSING RENTAL ACTIVITIES | AUGUST 2020                                                                                     vii
Acknowledgements
This study is a part of CAHF’s Housing and the Economy project, funded with the support of FSD Africa and
UKAid. The in-depth work undertaken by other CAHF staff (Alison Tshangana and Miriam Maina) is gratefully
acknowledged. Reitumetse Selepe designed and formatted the report.
Disclaimer
CAHF notes that its Housing Cost Benchmarking and Housing Economic Value Chain methodologies continue to be
improved over time. The methodology, approach and data collection approaches are continually refined to
overcome specific constraints and challenges experienced during CAHF’s original fifteen country study and
subsequent ‘deep dive’ analyses of specific countries.
While every effort has been made to ensure the accuracy of the data contained herein, CAHF acknowledges that
due to local variations and interpretations and the lack of directly comparable sources of data, accuracy of some
costing information may vary. In addition, the nature of some data implies that assumptions and estimates are
used to produce some of the analysis. All data and analysis should be taken as indicators of trends, and all will
benefit from improved housing market data in the future.

 UGANDA’S HOUSING CONSTRUCTION AND HOUSING RENTAL ACTIVITIES | AUGUST 2020                                  viii

Glossary
Formal/planned areas: planned and surveyed lands by municipality or privately– with title deeds/certificate of
right of occupancy. This can be for low, middle- and higher-income houses and earners.
Informal/unplanned areas: Un-surveyed and unplanned land without residential license or with residential
licenses. A residential license is encouraged in unplanned areas for purposes of tenure security and proof of
ownership. A residential license (which is regularly renewable) is issued by the local municipality and entails
information on property details, owner, term/duration of license, map of property and neighbourhood. These
areas are characterised by units made up of brick, block and cement structures and vary in terms of low, middle-
and higher-income housing.
Domestic production: The local (in this case, Ugandan) production of goods and services within a particular
geographic area – whether for consumption in that area, or for export.
Domestic supply: The supply of goods and services for consumption within a country’s (in this case, Uganda’s)
borders - regardless of whether those products were produced locally or imported.
Economic value chain: An interlinked set of value-adding activities that convert inputs (for example, raw
materials, or labour) into outputs (for example, window frames, or geysers) in the process of producing both
intermediate inputs for use within other economic value chains, and final products.
Factor income: Income received from the different factors of production, including land (rent), labour (wages)
and capital (profit).
Final demand: The total value of goods and services that are purchased in their final form in an economy in a
given period. In national accounts terms, this includes products that are consumed by households and by
government, capital goods that form part of gross capital formation, and products that are exported.
Full-time equivalent employment: The hours worked by a “typical” full-time employee in a particular sector
or industry in a given period (day/week/month/year). The concept is used to convert the hours worked by part-
time employees into the hours worked by full-time employees. For example, if a particular industry sector
currently operates on a basis where full-time employees work 40 hours per week, and three people are
employed on a part-time or casual basis to work 20 hours per week, their labour collectively represents 1.5 full-
time equivalent employment opportunities.
Government consumption: Government expenditure used for the purchase of final goods and services. This
excludes government expenditure on capital assets, which are accounted for under gross fixed capital
formation.
Gross domestic product (GDP): The value of all goods and services produced within a particular geographic
area (usually a country, in this case Uganda) within a particular period. It can be measured in three ways: i) as
the sum of all factor incomes (labour remuneration, interest, rent and profits) earned within the defined
geographic area (the income method); ii) as the value added in each sector of the economy (the production
method); and iii) as expenditure on goods and services in their final form (the expenditure method). The first
two methods measure the value of aggregate supply in the economy, while the third measures aggregate
demand. Differences in the valuation of each method arise because of the levying of indirect taxes and subsidies
at different stages of the production process, and at the final point of sale. The expenditure method is usually
valued at market prices and takes account of all indirect taxes and subsidies. The production method is usually
valued at basic prices and includes only indirect taxes and subsidies on production processes.
Gross fixed capital formation (GFCF): The expenditure on capital assets (buildings, civil works, machinery and
equipment, transport equipment, computer and telecommunications equipment, research and development,
computer software, mineral exploration, cultivated biological resources that yield repeat products - such as
vineyards and orchards) - and transfer costs. It does not account for the consumption (depreciation) of fixed
capital, and also does not include land purchases. The value of housing construction in a particular period
(adjusted for work on hand at the start of the period) is included in GFCF.
Gross operating surplus (GOS): Represents the aggregate of returns to land (rent), capital (interest) and
entrepreneurial endeavours (profits). This is often referred to generically as ‘returns to capital’. It reflects that
part of the value added by a company that is not attributable to labour.

 UGANDA’S HOUSING CONSTRUCTION AND HOUSING RENTAL ACTIVITIES | AUGUST 2020                                       ix
Gross value added (GVA): Represents the payments (returns) made to the owners of the different factors of
production (labour, land, capital and entrepreneurship) by a producer of goods and services in a particular
period. It reflects the difference between the sales/income of the producer and the payments made to third-
party suppliers of intermediate goods and services. The sum of the value added by each sector or industry in an
economy is equivalent to the GDP of that economy, but differences in valuation can arise due to the inclusion
or exclusion of indirect taxes and subsidies on production processes and products. GVA is typically valued at
basic prices or factor cost, while GDP is usually valued at market prices (inclusive of all indirect taxes and
subsidies).
Highly skilled employment: Employment requiring a high level of skill, often at a senior management or
professionally certified level.
Household consumption expenditure: Expenditure on final goods and services by households, or on behalf of
households (for example, when the state subsidises the cost of housing which is transferred to a household).
The purchase of these goods and services may be facilitated by the factor incomes of the households
themselves (earned income), or from transfers and subsidies from government or individuals outside the
household unit (unearned income).
Imports and Exports: An import is a good or service brought into a country from another country. An export is
a good or service taken from a country to another. These imports and exports may be in either a final, or
intermediate form. For simplicity, we consider houses themselves to be supplied and demanded only within the
domestic market, albeit that small numbers of prefabricated houses may be exported or imported.
Imputed rent (also referred to as owners’ equivalent rent): Represents the opportunity cost of owning and
living in a property. Choosing to occupy a property that you own means that any rent that could have been
earned on that property is foregone.
According to the OECD, “Imputed rents are defined as rental equivalents – that is, the estimated rent that a
tenant would pay for identical housing let unfurnished, taking into consideration factors such as the type of
dwelling (single-family or multi-family), its size (useable surface, number of rooms), its facilities (running water,
indoor toilet and bathroom, electricity, central heating, etc.), its location (city centre, suburban or rural) and
neighbourhood amenities.” 2
Failure to take account of imputed rents in the national accounts makes it difficult to compare the GDP of
countries with significantly different levels of private home ownership, and – in the case of a single country with
rapidly changing home ownership patterns – to compare GDP from one period to the next. For this reason the
rental equivalent value of owner-occupied dwellings are imputed so as to place home owners and renters on a
similar footing and the GDP of the country (and its components) is adjusted accordingly. Methods of
determining the imputed rent vary depending on the nature and extent of the rental market in that country and
the data available. The accuracy of these estimates depends on the efficient functioning of rental markets
across the entire spectrum of housing options and locations. For example South Africa’s Consumer Price Index
2016 Weights3 determined that on average across all households, imputed rents were equivalent to 11.93
percent of household expenditure in 2016. Currently, Uganda’s CPI weights4 indicate that the average Ugandan
household spent 5.234 percent of total household expenditure on actual housing rentals. The CPI does not
include explicit reference to imputed rents.
Informal employment: The informal sector or informal economy represents that part of the total economic
activity that is not registered with, and directly monitored by, relevant government departments and agencies
and not directly taxed (it will typically be subject to at least some forms of indirect taxation such as value added
tax). Informal employment relates to all people deriving income from this informal activity. Because of its
prevalence, most countries include some estimates of the economic contribution of the informal sector in the
construction of their national accounts.
Intermediate demand: Demand for a product that undergoes further transformation through value adding
activities during a production process. The output of a particular sector or industry can be used to satisfy either
intermediate demand from other sectors and industries, or final demand.

2 Eurostat-OECD (2012). “Housing”, in Eurostat-OECD Methodological Manual on Purchasing Power Parities, OECD
Publishing. Pg. 138.
3 Statistics South Africa (2017). P0141.5 - Consumer Price Index (CPI): Weights, 2016. 27 January 2017.
4 Uganda Bureau of Statistics (2020). Uganda Consumer Price Index 2009/10 = 100. April 2020.

    UGANDA’S HOUSING CONSTRUCTION AND HOUSING RENTAL ACTIVITIES | AUGUST 2020                                     x
Intermediate inputs: Goods and services that are inputs into a production process and that undergo further transformation as a result of value-added activities during the production process. For example, bricks, sand and cement are just some of the intermediate inputs that are used in the process of producing a house by the construction sector. Labour: Economic measure of work done by human beings. Labour is a factor of production that is remunerated by wages and salaries and constitutes one possible source of income for households. Other income streams can be derived from capital (interest), land (rents) or entrepreneurial endeavours (profits). Multiplier effect: A multiplier effect is an economic impact that arises from an initial economic stimulus – such as the sale of a house – that causes changes in other related economic variables (value added, output, employment, tax collections, imports etc.). The cumulative impact of these changes is typically greater than (a multiple of) the initial stimulus that caused them. System of National Accounts (SNA): The implementation of complete and consistent accounting techniques for measuring the economic activity of a nation. Most countries have adopted an SNA that complies with guidelines collectively developed by the European Communities, International Monetary Fund, Organisation for Economic Co-operation and Development, United Nations and World Bank5 Net Indirect Taxes: The value of indirect taxes paid, less any subsidies received, by an economic actor. An indirect tax may be levied on part of a production process (such as a skills levy on labour remuneration) or on a product (such as an excise duty or value added tax). Indirect taxes are distinguished from direct taxes (such as corporate tax or personal income tax). Primary sector: Those sectors of the economy related to primary industries including agriculture, forestry, fishing and mining and quarrying. They are often referred to as extractive industries because they extract resources and products from the environment. These extracted products may be “renewable” or “repeatable” - as in the case of sustainable agriculture and fishing - or “non-renewable” - such as metals and minerals extracted by mining and quarrying. Secondary sector: Those sectors of the economy related to secondary industries including manufacturing, electricity, gas and water and construction works of finished goods and services. Semi-skilled and unskilled employment: Employment requiring less skills than skilled employment. Skilled employment: Employment requiring a special skill, training, knowledge, and (usually acquired) ability to be productive. Organisationally, skilled employment typically includes artisans, supervisors and lower levels of management. Tertiary sector: Those sectors of the economy that produce and sell a wide range of services including wholesale and retail trade, transport, storage and communication, financial, insurance, professional business advisory, and community and personal services. Because of this the tertiary sector is often referred to as the services sector. 5 European Communities, International Monetary Fund, Organisation for Economic Co-operation and Development, United Nations and World Bank (2009). UGANDA’S HOUSING CONSTRUCTION AND HOUSING RENTAL ACTIVITIES | AUGUST 2020 xi
Note on exchange rates
Because of the distortions that the use of prevailing market exchange rates can give rise to, it was decided to
convert the affordability calculations in this report into international purchasing power parity dollars (PPP$). A
PPP$ is a notional currency that reflects the rate at which the currency of one country would have to be
converted into that of another country to buy the same amount of goods and services in each country. Use of
PPP$ avoids most of the distortions that can be generated by use of prevailing market exchange rates against
other currencies – such as the US$. It therefore provides a more accurate reflection of the relative affordability
of housing in one country compared to other countries, and will also give rise to less volatile affordability
measures over time—particularly in commodity exporting countries that experience wide swings in exchange
rates as a result of commodity price changes.
Unless otherwise noted in the text or footnotes, the exchange rates used for in this publication are as follows:
Ugandan Shillings (UGX) per United States Dollar (US$)

 2017                                                         UGX 3 611.36

 2018                                                         UGX 3 727.79

 2019                                                         UGX 3 703.98

 2020 (1 January to 30 April)                                 UGX 3 729.10

Source: Bank of Uganda (2020). Exchange rates. https://www.bou.or.ug/bou/bouwebsite/Statistics/Statistics.html

Ugandan Shillings (UGX) per International Purchasing Power Parity Dollar (PPP$)

 2017                                                         UGX 1 077.93

 2018                                                         UGX 1 085.74

 2019                                                         UGX 1 106.88

Source: International Monetary Fund (2019). World Economic Outlook. October (2019).
https://www.imf.org/external/pubs/ft/weo/2019/02/weodata/index.aspx
However it is noted that Section 5: Housing cost benchmarking uses different exchange rates than those given
above. The dollar prices used in Section 5 are calculated from the local currency (UGX) input costs collated,
based on the prevailing exchange rate at the time of the cost benchmarking exercise (US$1 = UGX 3 693).

 UGANDA’S HOUSING CONSTRUCTION AND HOUSING RENTAL ACTIVITIES | AUGUST 2020                                       xii
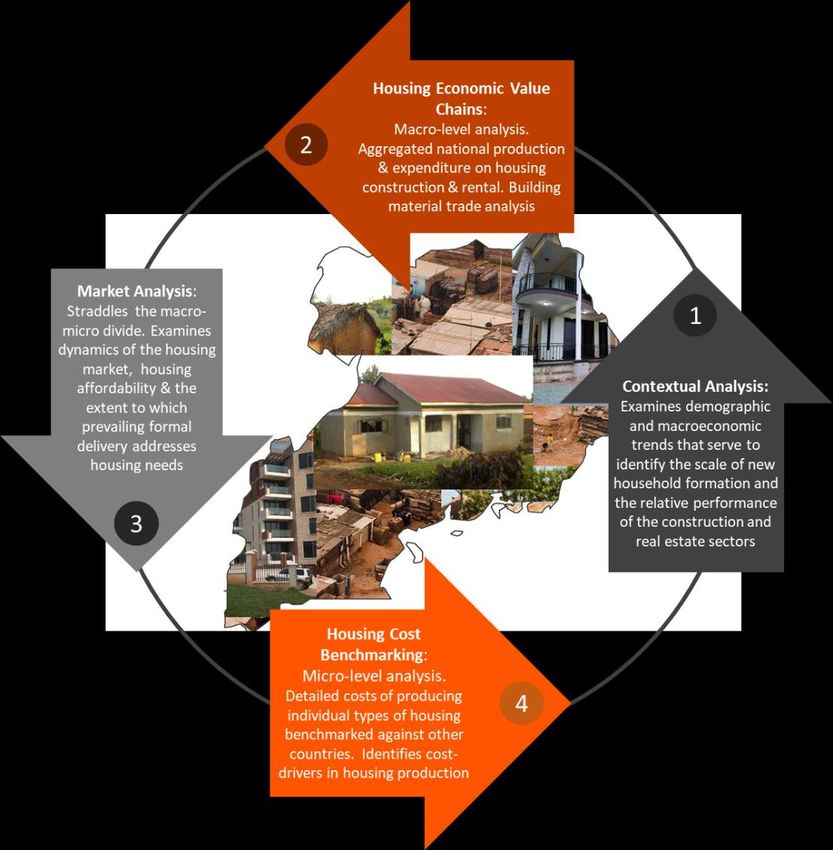
1 Introduction
This report focuses on Uganda’s housing market and economy and consists of four important analytical
components, from which conclusions and recommendations are then derived. The first analytical component
is a Contextual Analysis of demographic and economic trends that speak to the scale of new household
formation and where these households are located, relative trends in per capita incomes, and the comparative
performance and contribution of the construction and real estate sectors of the Ugandan economy.
The second analytical component is a Housing Economic Value Chain analysis, that follows a methodology
developed for CAHF, that provides a macro-level overview of the housing construction and housing rental value
chains. The value chain analysis provides a link between micro-economic housing construction and housing
rental production activities and the macroeconomy by indicating the ties between these activities and other
sectors of the economy. The analysis incorporates both the production/supply side of housing construction and
rental-related activities, and the expenditure/demand side and – in the process – the contribution to the gross
domestic product of Uganda from the production, income and expenditure perspectives. This section of the
report is supplemented by a revealed competitive advantage analysis of Uganda’s international trade in
building materials.
Figure 1: Components of the analysis

The third analytical component is a Housing Market Analysis that serves as a bridge between the preceding
macro-level analysis of aggregate housing production and expenditure and the subsequent micro-level
analysis. It examines the dynamics of Uganda’s housing construction and rental markets. It focuses on rural and
urban household incomes and what this implies for housing affordability, and examines the extent to which
prevailing housing policies and formal production processes meet the needs of the entire spectrum of Ugandan
households.

 UGANDA’S HOUSING CONSTRUCTION AND HOUSING RENTAL ACTIVITIES | AUGUST 2020                                 13
The fourth analytical component of this report is a Housing Cost Benchmarking analysis developed for CAHF
that examines, in detail, the cost of producing different standardised types of housing units in Uganda, and
contrasts these with their equivalent costs of production in a number of other African economies. In the
process, this analysis identifies those components of housing production costs in Uganda that are either
relatively cheaper, or more expensive, than other countries – so that they can be subjected to additional
scrutiny. This can assist in designing policy interventions that address cost-raising factors and assist in
improving housing affordability.
As shown in Figure 1, the combination of these four analytical components provides the basis for a number of
conclusions relating to Uganda’s housing economy, and informs certain high-level policy recommendations on
the types of interventions required to optimise the contribution of housing to Uganda’s economy, and to meet
the housing needs of citizens more effectively.

2 The context to Uganda’s housing market
The housing construction and rental activities of a country are the result of a range of influences, including
demographic and urbanisation dynamics, income trends, economic growth and structural changes in the
composition of the economy, prevailing technologies, subsidy regimes, social norms and household
preferences amongst many others. This section analyses available data in relation to demographic and
macroeconomic trends that will influence Uganda’s housing market and housing economy in the future.
2.1    Demographic trends
The Department of Economic and Social Affairs of the United Nations’ Population Division (DESA)6 estimates
Uganda’s population at close to 46 million people in 2020, with average growth of 3.66 percent a year between
2015 and 2020. This makes Uganda’s population growth rate the third highest in Africa (after Niger’s 3.89
percent and Equatorial Guinea’s 3.72 percent) and the fifth highest in the world. 7
Uganda has a relatively low level of urbanisation, even by African standards. DESA estimates that Uganda’s
urban population is 11.8 million in 2020 (25 percent of the total population). 8 The urban population is however
projected to grow at a rapid average annual rate of 5.6 percent over the next five years (2020 to 2025). The
proportion of the population that is expected to be urbanised will increase to 31 percent by 2030 and to just
over 44 percent by 2050. The capital city Kampala has a population of 3.3 million in 2020 and it is expected to
grow to 5.5 million by 2030. DESA projects that Uganda’s urban population will increase by an average of 731
000 people per year over the next five years, of which close to 193 000 with be located in Kampala, and the
remaining 548 000 will be spread across Uganda’s other urban areas.
In its 2016/17 Household Survey,9 the Uganda Bureau of Statistics (UBOS) indicated that in that financial year,
the average household size in Uganda was 4.7 people, and that the national average had not changed
noticeably since 2009/10. It estimated that in urban areas, the average household size was 4.1 people, while in
rural areas it was 4.9. Assuming that these average household sizes remain the same in coming years, the total
number of households from 2020 to 2025, and the additional households that will need to be accommodated
from 2021 to 2025, will be as reflected in Figure 2. The graph on the left indicates that the number of urban
households will increase from close to 2.9 million in 2020 to almost 3.8 million in 2025, and the number of rural
households will rise from 6.9 million to 7.4 million over the same period. While the majority of households will
continue to be in rural areas, the number of new households formed in urban areas will be substantially greater
than those formed in rural areas (right hand graph).

6 United Nations, Department of Economic and Social Affairs, Population Division (2019). World Population Prospects 2019,

Online Edition.
7 Bahrain’s population grew at an average of 4.4 percent a year over the same period but it only had a population of 1.7

million people in 2020. Oman’s population increased by 3.66 percent p.a.
8 United Nations, Department of Economic and Social Affairs, Population Division (2018). World Urbanization Prospects:

The 2018 Revision, Online Edition.
9 Uganda Bureau of Statistics (2018). Uganda National Household Survey 2016/2017 Report.

 UGANDA’S HOUSING CONSTRUCTION AND HOUSING RENTAL ACTIVITIES | AUGUST 2020                                          14
Figure 2: Estimated total and additional households in Uganda (2020-2025)

                                                                 Urban       Rural                                                                            350

                                                                                                  Estimated Number of Additional Households to be Formed in
                                                                                                                                                              300
     ESTIMATED NUMBER OF HOUSEHOLDS IN UGANDA

                                                                                                                                                              250

                                                                                                                                                                                             96
                                                                                                                                                                                       99
                                                                                                                                                                                 101
                                                                                          7 363

                                                                                                                                                                           103
                                                                                  7 267

                                                                                                                                                                     105
                                                                                                                    Uganda (Thousands)
                                                                          7 168
                   (THOUSANDS)

                                                                  7 068

                                                                                                                                                              200
                                                         6 965
                                                 6 860

                                                                                                                                                                                                   Rural
                                                                                                                                                                                                   Urban
                                                                                                                                                              150

                                                                                                                                                                                             198
                                                                                                                                                              100

                                                                                                                                                                                       188
                                                                                                                                                                                 178
                                                                                                                                                                           168
                                                                                                                                                                     160
                                                                                          3 764
                                                                                  3 566
                                                                          3 378
                                                                  3 200
                                                         3 032
                                                 2 872

                                                                                                                                                               50

                                                                                                                                                               -
                                                2020 2021 2022 2023 2024 2025                                                                                       2021 2022 2023 2024 2025

 Source: UN DESA, World Population Prospects, 2019 Revision and World Urbanisation Prospects, 2018 Revision. Own
 calculations.

The number of households will increase by 265 000 between 2020 and 2021, of which 160 000 will be in urban
areas. Between 2024 and 2025, an additional 294 000 households will be formed, of which an estimated 198
000 will be in urban areas. These households will require housing and to the extent that this need is not met by
formal housing construction, it will be met by owner-building (either formally or informally), or an increase in
average household size through household consolidation. This means that Uganda will face the consequences
of rapid urbanisation in the future. The 2016/17 Uganda National Household Survey shows that 40 percent of
migrants move to urban areas for income reasons, 26 percent moved to join family already in urban areas, and
19 percent moved due to marriage.10
Uganda’s rapid urbanisation will increasingly result in a range of important shifts in housing demand in urban
areas. Firstly, the need to deliver housing in urban areas will become an urgent priority. Secondly, the average
size of households in Uganda has decreased over the last decade. Between the 2005/06 and 2016/17 census
counts, urban household size has reduced from 4.6 people per household to 4.1, and rural households from 5.3
to 4.9. For instance, there has been a rapid growth in one and two-person households: from 24 percent in
2012/13 to 32 percent of all urban households in 2016/17. 11 If Uganda is to accommodate such a trend it will
require a shift in housing supply to cater increasingly for smaller households. Third, there will be increasing
demand for housing due both to the scarcity of available opportunities and the more flexible housing needs of
younger, more economically mobile, recently urbanised households. The likely implications of this on tenure
conditions are discussed in Section 4.

10   Uganda Bureau of Statistics (UBOS) (2018). Uganda National Household Survey 2016/2017.
11 Ibid.

     UGANDA’S HOUSING CONSTRUCTION AND HOUSING RENTAL ACTIVITIES | AUGUST 2020                                                                                                                     15
2.2 Economic and income trends
Housing markets are affected by the contexts in which they develop. The housing construction and rental
activities of a country are the result of a range of influences, including demographic and urbanisation dynamics,
income trends, sectoral growth and composition, prevailing technologies, subsidy regimes, social norms and
household preferences amongst many others. This section analyses trends and available data in relation to
some of these indicators.
2 . 2 . 1 I n c o m e tr en d s
Between 2005 and 2019, Uganda’s per capita GDP at purchasing power parity – an indication of average
incomes before taxation and transfers – increased by 89 percent.12 While this was significantly lower than the
growth experienced by other sub-Saharan African countries such as Rwanda (156 percent) and Ghana (132
percent), it was substantially higher than South Africa (40 percent), and above both Nigeria (71 percent) and
Kenya (82 percent). These relative trends are reflected in Figure 3.13
Figure 3: Comparative trends in per capita GDP at purchasing power parity
260
256
GDP per Capita at Purchasing Power Parity, Index: 2005 = 100
240
232
220
200 202 Rwanda
189 Ghana
180 182
Tanzania
171
Uganda
160
Kenya
Nigeria
140 140
South Africa
120
100
80
2005 2006 2007 2008 2009 2010 2011 2012 2013 2014 2015 2016 2017 2018 2019
Source: IMF WEO (October 2019).
While the trends in per capita GDP over time are useful, it is also important to take account of the relative levels
across countries. Figure 4 reflects the per capita GDP at purchasing power parity for different African countries
in 2018. Although South Africa was by far the worst performer in respect of the growth in average incomes over
time (as shown in Figure 2), the value of its average per capita income was still substantially higher in 2018 than
the other African countries with whom it is compared. Its per capita GDP was more than double the next-
highest country (Ghana), and more than 5 times greater than that of Uganda and Rwanda.14 The average
12 This translates into average annual growth of 4.7 percent a year.
13 International Monetary Fund (2019). World Economic Outlook. October 2019.
14 As with any average, these figures do not say anything about the distribution of income, or levels of inequality, within
these societies.
UGANDA’S HOUSING CONSTRUCTION AND HOUSING RENTAL ACTIVITIES | AUGUST 2020 16Ugandan could purchase around 18 percent of what the average South African was able to in 2018. Uganda’s
per capita GDP was 9 percent higher than Rwanda’s, but lower than all the other countries included in this
analysis. So, even though the income of the average Ugandan household rose relatively rapidly over the past
14 years (from 2005 to 2019), it remains comparatively low in terms of what it is able to purchase. This has
implications for the affordability of housing in general, and the range of housing options required to facilitate
greater affordability for increasing numbers of Ugandan households.
Figure 4: Comparative levels of per capita GDP at purchasing power parity across a number of African countries (2018)
16 000
14 000 13 630
GDP per Capita at Purchasing Power Parity in 2018
12 000
10 000
(PPP$ per Person)
8 000
6 492
5 967
6 000
3 705
4 000 3 273
2 287 2 497
2 000
-
Ghana Kenya Nigeria Rwanda South Africa Tanzania Uganda
Source: IMF WEO (October 2019).
2 . 2 . 2 R e l a t i v e s e c t o r pe r f or m a n c e an d e c o n o m ic c o m p o s i t i o n
Figure 5 reflects the relative trends in the real GDP of the major sectors of the Ugandan economy between
2008 and 2018.15 It indicates that real value added in the Transport and communication sector increased by 248
percent over this period. While a number of other sectors – most notably Agriculture, forestry and fishing,
Manufacturing, and Trade catering and housing – achieved substantially slower rates of growth over this period,
all sectors of the Ugandan economy expanded. From the perspective of this study, the growth in the
Construction and Real estate sectors are most relevant. The construction sector experienced aggregate growth
of 110 percent between 2008 and 2018, while Real estate’s gross value added rose by a more modest 65 percent.
15 Uganda Bureau of Statistics (2019). Annual GDP Publication Tables.
UGANDA’S HOUSING CONSTRUCTION AND HOUSING RENTAL ACTIVITIES | AUGUST 2020 17You can also read


