CODA MINERALS LIMITED - Independent Expert's Report
←
→
Page content transcription
If your browser does not render page correctly, please read the page content below
CODA MINERALS LIMITED
Independent Expert’s Report

24 February 2020
Financial Services Guide
24 February 2020
BDO Corporate Finance (WA) Pty Ltd ABN 27 124 031 045 (‘we’ or ‘us’ or ‘ours’ as appropriate) has
been engaged by Coda Minerals Limited (‘Coda‘) to provide an independent expert’s report on the
proposal to offer shareholders the opportunity to sell their shares off-market at a sale price of $0.15
per share via a voluntary off-market share sale facility (‘the Offer’). You are being provided with a
copy of our report because you are a shareholder of Coda and this Financial Services Guide (‘FSG’) is
included in the event you are also classified under the Corporations Act 2001 (‘the Act’) as a retail
client.
Our report and this FSG accompanies the Letter to Shareholders required to be provided to you by
Coda to assist you in deciding on whether or not to participate.
Financial Services Guide
This FSG is designed to help retail clients make a decision as to their use of our general financial
product advice and to ensure that we comply with our obligations as a financial services licensee.
This FSG includes information about:
Who we are and how we can be contacted;
The services we are authorised to provide under our Australian Financial Services Licence No.
316158;
Remuneration that we and/or our staff and any associates receive in connection with the general
financial product advice;
Any relevant associations or relationships we have; and
Our internal and external complaints handling procedures and how you may access them.
Information about us
We are a member firm of the BDO network in Australia, a national association of separate entities
(each of which has appointed BDO (Australia) Limited ACN 050 110 275 to represent it in BDO
International). The financial product advice in our report is provided by BDO Corporate Finance (WA)
Pty Ltd and not by BDO or its related entities. BDO and its related entities provide professional
services primarily in the areas of audit, tax, consulting, mergers and acquisition, and financial advisory
services.
We and BDO (and its related entities) might from time to time provide professional services to
financial product issuers in the ordinary course of business and the directors of BDO Corporate Finance
(WA) Pty Ltd may receive a share in the profits of related entities that provide these services.
Financial services we are licensed to provide
We hold an Australian Financial Services Licence that authorises us to provide general financial
product advice for securities to retail and wholesale clients, and deal in securities for wholesale
clients. The authorisation relevant to this report is general financial product advice.
When we provide this financial service we are engaged to provide an expert report in connection with
the financial product of another person. Our reports explain who has engaged us and the nature of the
report we have been engaged to provide. When we provide the authorised services we are not acting
for you.
General Financial Product Advice
We only provide general financial product advice, not personal financial product advice. Our report
does not take into account your personal objectives, financial situation or needs. You should consider
the appropriateness of this general advice having regard to your own objectives, financial situation
and needs before you act on the advice. If you have any questions, or don’t fully understand our
report you should seek professional financial advice.
BDO CORPORATE FINANCE (WA) PTY LTD
Financial Services Guide
                                                 Page 2

Fees, commissions and other benefits that we may receive
We charge fees for providing reports, including this report. These fees are negotiated and agreed with
the person who engages us to provide the report. Fees are agreed on an hourly basis or as a fixed
amount depending on the terms of the agreement. The fee payable to BDO Corporate Finance (WA)
Pty Ltd for this engagement is approximately $11,000.

Except for the fees referred to above, neither BDO, nor any of its directors, employees or related
entities, receive any pecuniary benefit or other benefit, directly or indirectly, for or in connection
with the provision of the report and our directors do not hold any shares in Coda.

Other Assignments
In March 2019, BDO was engaged by Coda’s parent company at the time, Gindalbie Metals Limited
(‘Gindalbie’), to prepare an independent expert report opining on the fairness and reasonableness of:
(i) the proposed demerger of Coda from Gindalbie; and (ii) the proposed acquisition of the entire
issued capital of Gindalbie by Angang Group Hong Kong (Holdings) Limited. BDO received a combined
fee of approximately $50,000 for the two independent expert’s reports we were commissioned to
produce.

In December 2019, BDO was subsequently engaged by Coda to prepare a separate valuation report of
Coda, for income tax purposes. The fee for this engagement will be approximately $8,000.

Remuneration or other benefits received by our employees
All our employees receive a salary. Our employees are eligible for bonuses based on overall
productivity but not directly in connection with any engagement for the provision of a report. We have
received a fee from Coda for our professional services in providing this report. That fee is not linked in
any way with our opinion as expressed in this report.

Referrals
We do not pay commissions or provide any other benefits to any person for referring customers to us in
connection with the reports that we are licensed to provide.

Complaints resolution
Internal complaints resolution process
As the holder of an Australian Financial Services Licence, we are required to have a system for
handling complaints from persons to whom we provide financial product advice. All complaints must
be in writing addressed to The Complaints Officer, BDO Corporate Finance (WA) Pty Ltd, PO Box 700
West Perth WA 6872.

When we receive a written complaint we will record the complaint, acknowledge receipt of the
complaint within 15 days and investigate the issues raised. As soon as practical, and not more than 45
days after receiving the written complaint, we will advise the complainant in writing of our
determination.

Referral to External Dispute Resolution Scheme
A complainant not satisfied with the outcome of the above process, or our determination, has the
right to refer the matter to the Australian Financial Complaints Authority (‘AFCA’).

AFCA is an external dispute resolution scheme that deals with complaints from consumers in the
financial system. It is a not-for-profit company limited by guarantee and authorised by the responsible
federal minister. AFCA was established on 1 November 2018 to allow for the amalgamation of all
Financial Ombudsman Service (‘FOS’) schemes into one. AFCA will deal with complaints from
consumers in the financial system by providing free, fair and independent financial services complaint
resolution. If an issue has not been resolved to your satisfaction you can lodge a complaint with AFCA
at any time.

Our AFCA Membership Number is 12561. Further details about AFCA are available on its website
www.afca.org.au or by contacting it directly via the details set out below.
        Australian Financial Complaints Authority
        GPO Box 3
        Melbourne VIC 3001
        AFCA Free call: 1800 931 678
        Website:           www.afca.org.au
        Email:             info@afca.org.au

You may contact us using the details set out on page 1 of the accompanying report.

This is a draft document and must not be relied on or disclosed or referred to in any document.
We accept no duty of care or liability to you or any third party for any loss suffered in
connection with the use of this document.
TABLE OF CONTENTS

1.          Introduction                                                                     1

2.          Summary and Opinion                                                              1

3.          Scope of the Report                                                              4

4.          Outline of the Offer                                                             6

5.          Profile of Coda                                                                  6

6.          Economic analysis                                                                12

7.          Industry analysis                                                                13

8.          Valuation approach adopted                                                       19

9.          Valuation of a Coda share                                                        21

10.         Valuation of sale price in the Offer                                             29

11.         Is the Offer fair?                                                               29

12.         Is the Offer reasonable?                                                         30

13.         Conclusion                                                                       31

14.         Sources of information                                                           32

15.         Independence                                                                     32

16.         Qualifications                                                                   32

17.         Disclaimers and consents                                                         33

Appendix 1 – Glossary and copyright notice

Appendix 2 – Valuation Methodologies

Appendix 3 - Independent Valuation Report prepared by SRK Consulting (Australasia) Pty Ltd

© 2020 BDO Corporate Finance (WA) Pty Ltd
24 February 2020

The Directors
Coda Minerals Limited
6 Altona Street
West Perth WA 6005

Dear Directors

INDEPENDENT EXPERT’S REPORT
1.      Introduction
The directors of Coda Minerals Limited (‘Coda’ or ‘the Company’) have requested that BDO Corporate
Finance (WA) Pty Ltd (‘BDO’) prepare an independent expert’s report (‘our Report’) to express an opinion
as to whether or not the Company’s offer to facilitate the sale of Coda shares for its shareholders via a
voluntary off-market share sale facility (‘the Facility’) at a sale price of $0.15 per share (‘the Offer’) is
fair and reasonable to the eligible shareholders who are able to participate in the Facility
(‘Shareholders’). We note that Coda’s largest shareholder, Angang Group Hong Kong (Holdings)
(‘Ansteel’), with its 35.56% interest in Coda, is not considered an eligible shareholder for participation in
the Facility by virtue of its address not being in Australia. The Company has engaged CPS Capital Group
Pty Ltd (AFSL 294848) (‘CPS’) to manage the Facility.

A maximum of 13,333,333 shares will be sold through the Offer, representing approximately 39% of the
Company’s issued capital, however this maximum limit may be increased at the Company’s discretion.
Coda and CPS will ensure that none of the buyers obtain a ‘relevant interest’, as defined in Corporations
Act 2001 (Cth) (‘the Act’), which exceeds 20%, or increases an existing ‘relevant interest’ which is already
above 20%, by acquiring shares under the Offer, except to the extent permitted under Chapter 6 of the
Act. However, the Company reserves the right to seek shareholder approval for a buyer to exceed this 20%
relevant interest threshold at its discretion.

2.      Summary and Opinion
     2.1         Requirement for the report
There is no requirement under ASX Listing Rules, or Corporations Act or Regulations, for Coda to engage
an independent expert in relation to the Offer.

Notwithstanding the above, Coda engaged BDO to prepare this report for provision to Shareholders to
assist them in deciding whether to accept or reject the Offer. Our Report is to be included in the Letter
to Shareholders pursuant to the Offer.

BDO Corporate Finance (WA) Pty Ltd ABN 27 124 031 045 AFS Licence No 316158 is a member of a national association of independent entities which are
all members of BDO (Australia) Ltd ABN 77 050 110 275, an Australian company limited by guarantee. BDO Corporate Finance (WA) Pty Ltd and BDO
(Australia) Ltd are members of BDO International Ltd, a UK company limited by guarantee, and form part of the international BDO network of independent
member firms. Liability limited by a scheme approved under Professional Standards Legislation.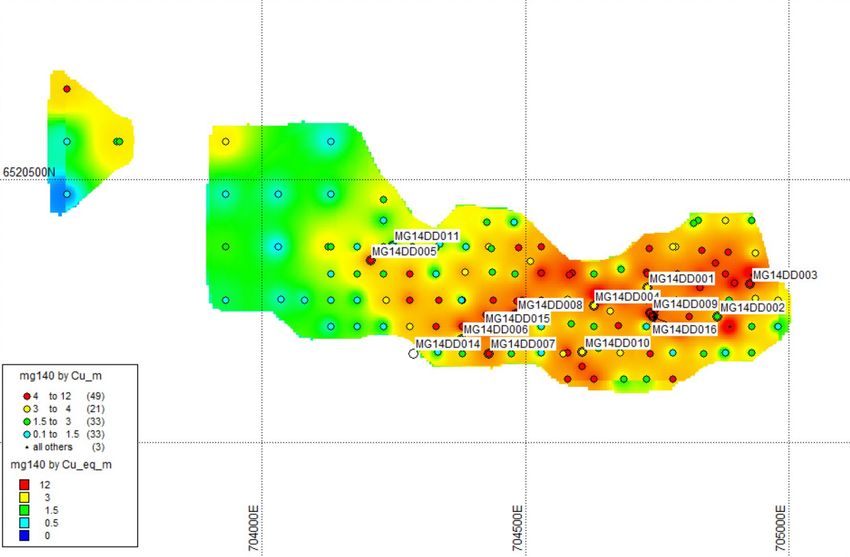
2.2 Approach
Our Report has been prepared having regard to Australian Securities and Investments Commission (‘ASIC’)
Regulatory Guide 111 ‘Content of Expert’s Reports’ (‘RG 111’) and Regulatory Guide 112 ‘Independence
of Experts’ (‘RG 112’).
In arriving at our opinion, we have assessed the terms of the Offer as outlined in the body of this report.
We have considered:
How the value of a Coda share on a minority basis with a discount for lack of marketability applied
compares to the value of the sale price in the Offer;
The likelihood of an alternative offer being made to Shareholders;
Other factors which we consider to be relevant to the Shareholders in their assessment of the Offer;
and
The position of Shareholders should they not accept the Offer.
2.3 Opinion
We have considered the terms of the Offer as outlined in the body of this report and have concluded that,
in the absence of an alternative offer, the Offer is fair and reasonable to Shareholders.
2.4 Fairness
In Section 11 we determined that the value of the sale price in the Offer compares to the minority value
of a share in Coda with a discount for lack of marketability applied, as detailed below.
Low Preferred High
Ref
$ $ $
Value of a Coda share on a minority interest basis with a
Section 9 0.124 0.168 0.219
discount for lack of marketability applied
Value of the sale price in the Offer Section 10 0.15 0.15 0.15
Source: BDO analysis
The above valuation ranges are graphically presented below:
Valuation Summary
Value of a Coda share on a minority basis
with a discount for lack of marketability
Value of the sale price in the Offer
0.000 0.050 0.100 0.150 0.200 0.250
Value ($)
We note from the table above that, the $0.15 sale price in the Offer falls within our estimate of the value
of a Coda share on a minority interest basis and with a discount for lack of marketability applied.
2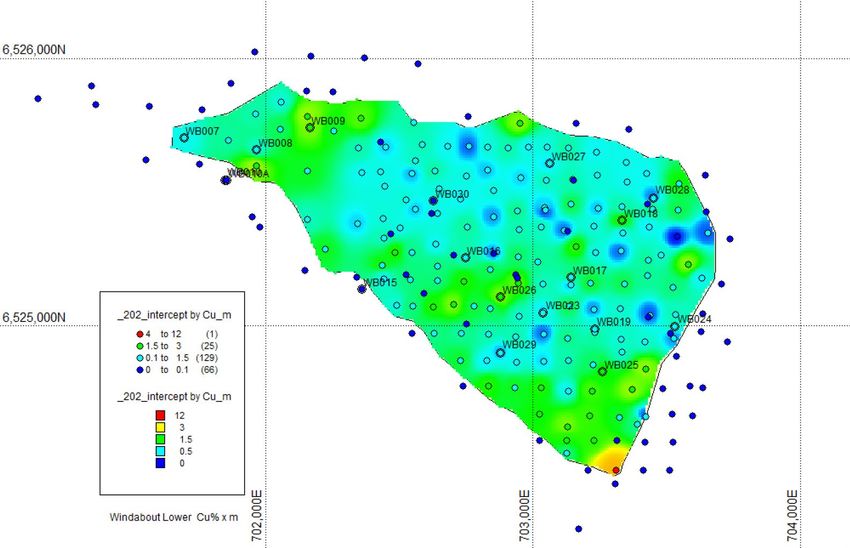
Therefore, in the absence of any other relevant information, and an alternate offer, we consider that the
Offer is fair.
2.5 Reasonableness
We have considered the analysis in Section 12 of this report, in terms of both
advantages and disadvantages of the Offer; and
other considerations, including the position of a Shareholder who does not participate in the
Offer.
In our opinion, after considering the advantages and disadvantages of the Offer and the other
considerations, and in the absence of an alternative proposal, we believe that the Offer is reasonable for
Shareholders.
The respective advantages and disadvantages considered are summarised below:
ADVANTAGES AND DISADVANTAGES
Section Advantages Section Disadvantages
12.3 The Offer is fair 12.4 The Offer does not guarantee a sale
12.3 The Offer provides an opportunity for 12.4 The sale price received may not maximize the
Shareholders to liquidate their investment value a Shareholder could receive for their
in Coda shares at a fixed price shares
12.3 No brokerage applies to the shares sold 12.4 Certain shareholders are not able to
through the Offer participate in the Offer
12.3 The Offer is optional 12.4 Shareholders could potentially forego a
control premium should one emerge in the
future
12.3 The sale price in the Offer matches that
of the recent off-market sale by a
sophisticated investor
Other key matters we have considered include:
Section Description
12.1 Alternative proposal
12.2 Consequences of not accepting the Offer
12.5 Other considerations
3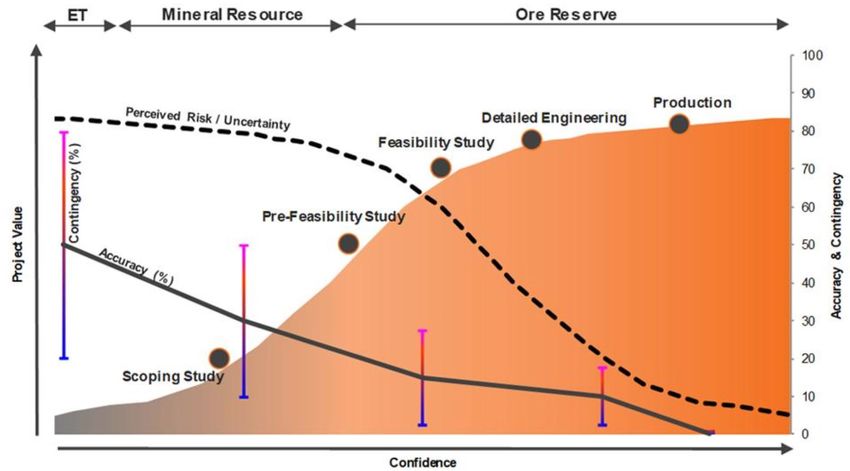
3.    Scope of the Report
     3.1    Purpose of the Report
There is no requirement under Australian Securities Exchange (‘ASX’) Listing Rules, or the Corporations
Act or Regulations, for Coda to engage an independent expert in relation to the Offer.
Notwithstanding the above, Coda engaged BDO to prepare this report for provisions to Shareholders to
assist them in deciding whether or not to accept the Offer.

     3.2    Regulatory guidance
Neither the Listing Rules nor the Corporations Act defines the meaning of ‘fair and reasonable’. In
determining whether the Offer is fair and reasonable, we have had regard to the views expressed by ASIC
in RG 111 which provides guidance as to what matters an independent expert should consider to assist
security holders to make informed decisions about transactions.

RG 111 suggests that, where an expert assesses whether a transaction is ‘fair and reasonable’, this should
not be applied as a composite test—that is, there should be a separate assessment of whether the
transaction is ‘fair’ and ‘reasonable’, as in a control transaction. An expert should not assess whether the
transaction is ‘fair and reasonable’ based simply on a consideration of the advantages and disadvantages
of the proposal.

We do not consider the Offer to be a control transaction. It is expected that the Offer will be for up to
13,333,333 shares or approximately 39% of Coda’s current issued capital, although this limit may be
increased at the Company’s discretion. However, Coda and CPS will ensure that none of the buyers obtain
a ‘relevant interest’, as defined in the Act, which exceeds 20%, or increases an existing ‘relevant interest’
which is already above 20%, except to the extent permitted under Chapter 6 of the Act. However, the
Company reserves the right to seek shareholder approval for a buyer to exceed this 20% relevant interest
threshold at its discretion.

As such, we have used RG 111 as a guide for our analysis but have considered the Offer as if it were not a
control transaction.

     3.3    Adopted basis of evaluation
RG 111 states that a transaction is fair if the value of the offer price or consideration is equal to or
greater than the value of the securities which are the subject of the offer. This comparison should be
made assuming a knowledgeable and willing, but not anxious, buyer and a knowledgeable and willing, but
not anxious, seller acting at arm’s length. RG 111 states that when considering the value of the securities
which are the subject of the offer in a control transaction, the expert should consider this value inclusive
of a control premium. However, as stated in Section 3.2 we do not consider that the Offer is a control
transaction. As such, we have not included a premium for control when considering the value of Coda
shares.
Further to this, RG 111 states that a transaction is reasonable if it is fair. It might also be reasonable if
despite being ‘not fair’ the expert believes that there are sufficient reasons for security holders to accept
the offer in the absence of any alternatives.
Having regard to the above, BDO has completed this comparison in two parts:

                                                                                                           4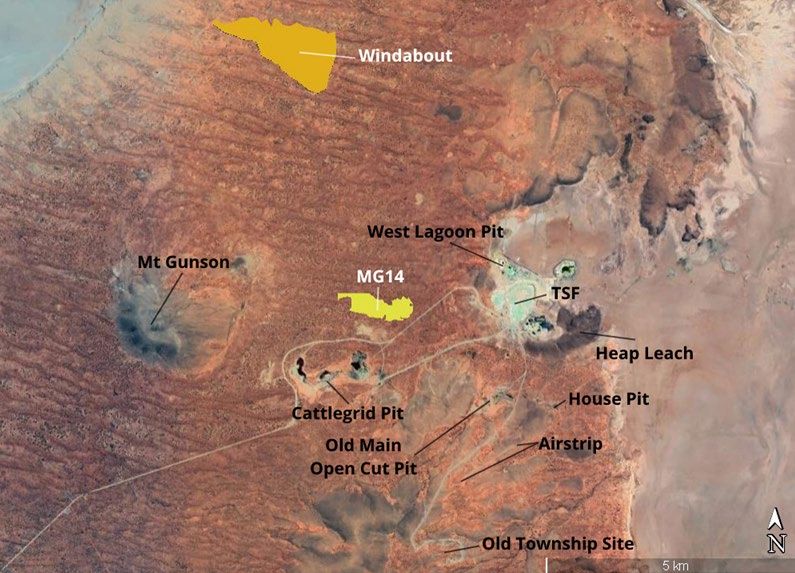
A comparison between the Offer consideration for a Coda share and the value of a Coda share
(fairness – see Section 11 ‘Is the Offer Fair?’); and
An investigation into other significant factors to which Shareholders might give consideration, prior to
accepting the Offer, after reference to the value derived above (reasonableness – see Section 12 ‘Is
the Offer Reasonable?’).
This assignment is a Valuation Engagement as defined by Accounting Professional & Ethical Standards
Board professional standard APES 225 ‘Valuation Services’ (‘APES 225’).
A Valuation Engagement is defined by APES 225 as follows:
‘an Engagement or Assignment to perform a Valuation and provide a Valuation Report where the Valuer
is free to employ the Valuation Approaches, Valuation Methods, and Valuation Procedures that a
reasonable and informed third party would perform taking into consideration all the specific facts and
circumstances of the Engagement or Assignment available to the Valuer at that time.’
This Valuation Engagement has been undertaken in accordance with the requirements set out in APES 225.
5
4.       Outline of the Offer
Shareholders are being offered the opportunity to tender all or part of their shareholding into the Facility
at a sale price of $0.15 per Coda share. CPS will seek to, on a best endeavours basis, identify and match
potential buyers for the shares tendered, up to an aggregate of 13,333,333 shares from all Shareholders.
There is no guarantee that there will be sufficient demand from potential buyers for all the shares
tendered. Buyers will be persons to whom securities may be offered without a prospectus or other
disclosure document, as specified in section 708 or 708A of the Act.
The Facility is being provided to assist certain Shareholders who wish to exit their investment in the
Company to sell their shares, as well as to provide holders of small parcels of shares with the opportunity
to sell into an aggregated pool. The Offer is entirely voluntary and Coda will bear all brokerage costs
involved.

Shareholders can elect to tender all of their shares or may elect to tender only some of their shares
provided that the Shareholder holds more than 5,000 shares and will continue to hold more than 5,000
shares after selling shares through the Facility. Priority will be given to Shareholders who hold 5,000 or
fewer shares (‘Small Holders’). Thereafter, tenders will be processed on a first-come basis in the order in
which the tender forms are received by the Coda share registry. If insufficient buyers are identified or
more shares are tendered for sale than the Facility limit, tenders will be scaled back on the same basis.

The Offer is a once-off opportunity for Shareholders to sell all or part of their holding with a defined
closing date for participation.

The Directors of Coda who are Shareholders do not intend to sell their shares through the Offer. Further
details on the Offer can be found in the Letter to Shareholders which our Report accompanies.

5.       Profile of Coda
     5.1     History
On 11 March 2019, Gindalbie Metals Limited, then parent of Coda, announced that it had entered into two
separate but inter-conditional Schemes of Arrangement (collectively ‘the Schemes’):

     •      Acquisition by Ansteel of all of the Gindalbie shares that it did not already own (‘Acquisition
            Scheme’); and
     •      Demerger of Gindalbie’s wholly owned subsidiary, Coda, to eligible Gindalbie shareholders
            (‘Demerger Scheme’) via a capital reduction.

The Schemes received shareholder approval and were subsequently implemented on 23 July 2019. As a
result of the Demerger Scheme, each eligible Gindalbie shareholder received one Coda share for every 45
Gindalbie shares held on the Demerger Scheme record date, being 16 July 2019.

Certain ineligible foreign shareholders did not receive Coda shares. Instead, the Coda shares which they
would have received were transferred to a nominee and are currently still held by the nominee awaiting
the opportunity for sale. Once sold, the nominee will transfer the average sales proceeds (net of
expenses) to the ineligible foreign shareholders. Coda has advised that, pending final legal advice and
discussions with the nominee, it is contemplated that the sale of these shares may be conducted through
the Offer.

                                                                                                              6
Prior to the Demerger Scheme, Coda was a wholly-owned subsidiary of Gindalbie incorporated on 26 April
2018 as a public company limited by shares. At the time of incorporation, it was established to farm-in to
an interest of up to 75% of the Mt Gunson Copper-Cobalt Project (‘Mt Gunson Project’ or ‘the Project’).
As part of the demerger, Coda received approximately $8 million from Gindalbie and retained its interest
in the Mt Gunson Project. Coda is now an exploration company focused on progressing the Mt Gunson
Project, with plans to list on the ASX and raise capital in due course.
The current directors of Coda are:
• Mr Keith Jones – Non-Executive Chairman;
• Mr Andrew Marshall - Non-Executive Director;
• Mr Colin Moorhead – Non-Executive Director;
• Mr Paul Hallam – Non-Executive Director; and
• Mr Chris Stevens – Chief Executive Officer.
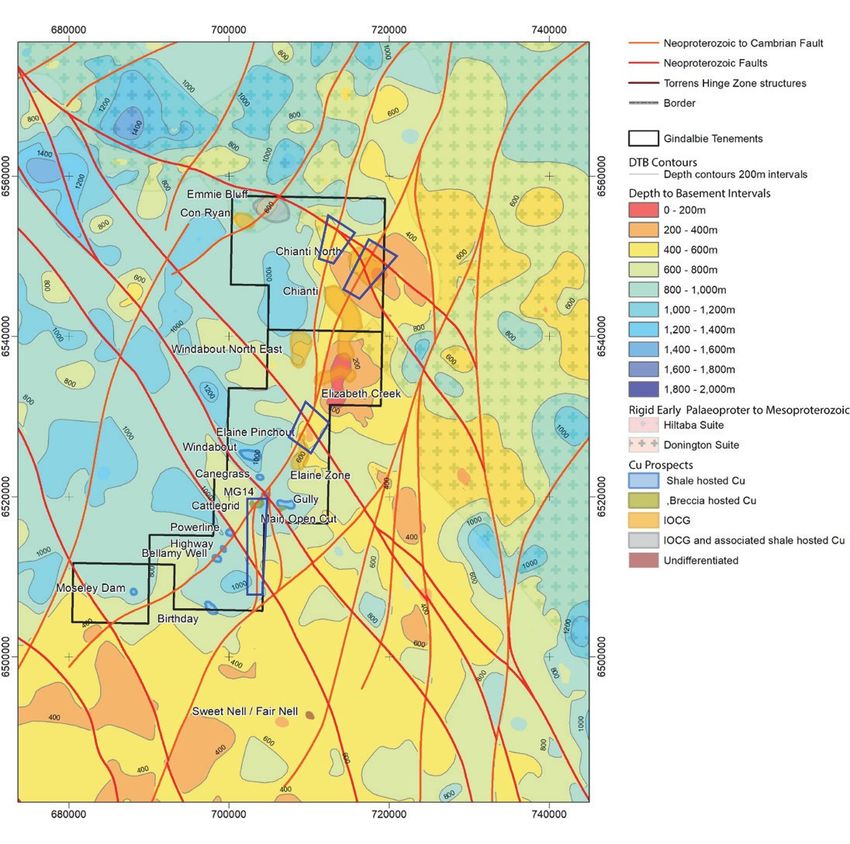
5.2 Mt Gunson Project
Coda holds the rights and interests under the Mt Gunson Copper-Cobalt Project Farm-In Agreement
(‘Farm-In Agreement’) with Terrace Mining Pty Ltd (‘Terrace Mining’), a wholly owned subsidiary of
Torrens Mining Limited, which allows Coda to earn up to a 75% interest in the Project. Under the Farm-In
Agreement, Terrace Mining’s interest could be diluted should it fail to meet certain cash calls and this
could result in Coda’s interest increasing to above the 75% level. At present, Coda holds contractual rights
to a 51% interest in the Project, having satisfied Stage 2 of its Farm-In Agreement in September 2019, and
is currently in the process of applying to formally register its interest in the tenements with the South
Australian Department of Energy and Mines. The Mt Gunson Project is in the exploration stage and
includes the Windabout and MG14 deposits, Emmie Bluff prospect and over 739 km 2 of prospective
tenements. It is located in the Olympic Dam Copper Province in South Australia and is accessed by
established unsealed roads off the sealed Stuart Highway. Established access to electrical grid power and
scheme water is available in the area.
Per Gindalbie’s previous announcements in January 2018 and June 2019, the Mt Gunson Project consists of
two JORC 2012 compliant resources (both based on a 0.5% copper equivalent cut-off):
Million tonnes Copper
Deposit Category Copper (%) Cobalt (%) Silver (g/t)
(‘Mt’) equivalent (%)
Windabout Indicated 17.67 0.77 0.05 8 1.41
MG14 Indicated 1.83 1.24 0.03 14 1.67
Total 19.5 0.8 0.05 8.6 1.14
Contained 159,000 9,400 5.4 million 280,000
metal tonnes tonnes ounces tonnes
*Above figures have been rounded
Source: Coda management
The currently contemplated mining strategy for the Windabout and MG14 deposits is open pit mining with
MG14 mined first due to its higher grades and shallow depth.
The Mt Gunson Project also holds the Emmie Bluff underground exploration target.
75.3 Glycine License
Coda also holds a license agreement between it, Mining & Process Solutions and Terrace Mining Pty Ltd
relating to the processing of selected mineral concentrates and metals, for use on certain tenements
within the Mt Gunson Project (‘Glycine License’).
5.4 Historical Balance Sheet
Unaudited as at Audited as at
Statement of Financial Position 31-Oct-19 30-Jun-19
$ $
CURRENT ASSETS
Cash and cash equivalents 7,253,304 17,542
Trade and other receivables 15,212 13,855
Prepayments 73,984 1,080
TOTAL CURRENT ASSETS 7,342,500 32,477
NON-CURRENT ASSETS
Property, plant and equipment 55,891 -
Exploration and evaluation expenditure 1,416,359 1,416,359
Intangible assets 166,774 171,219
TOTAL NON-CURRENT ASSETS 1,639,025 1,587,578
TOTAL ASSETS 8,981,525 1,620,055
CURRENT LIABILITIES
Trade and other payables 338,442 161,910
Employee entitlements 6,222 -
TOTAL CURRENT LIABILITIES 344,663 161,910
TOTAL LIABILITIES 344,663 161,910
NET ASSETS 8,636,862 1,458,145
EQUITY
Issued capital 1,000 1,000
Capital contribution reserve 12,040,106 3,789,110
Accumulated losses (3,404,245) (2,331,965)
TOTAL EQUITY 8,636,862 1,458,145
Source: 2019 Coda Annual Report and Coda management.
We have not undertaken a review of Coda’s unaudited management accounts in accordance with
Australian Auditing and Assurance Standard 2405 ‘Review of Historical Financial Information’ and do not
express an opinion on this financial information. However nothing has come to our attention as a result of
our procedures that would suggest the financial information within the management accounts has not
been prepared on a reasonable basis.
• Cash and cash equivalents substantially increased after the financial year ended 30 June 2019
as a cash contribution of approximately $8 million was received from Gindalbie as part of the
Demerger Scheme.
• Trade and other receivables comprise of Goods and Services Tax receivable from the
Australian Tax Office.
8• Prepayments of $73,984 as at 31 October 2019 comprised insurance prepayments,
subscriptions and rent.
• The property, plant and equipment balance of $55,891 as at 31 October 2019 includes
furniture, fittings, office equipment and leasehold improvements, the majority of which was
purchased from Gindalbie as part of the Demerger Scheme.
• Coda continues to conduct exploration programs at the Company’s Mt Gunson Project.
However these have not reached a stage which permits a reasonable assessment of
economically recoverable reserves. Therefore, the capitalised exploration and evaluation
expenditure is measured at cost, with any subsequent expenditure expensed as incurred, up
until the point at which a scoping study is completed, a pre-feasibility study entered into and
the pre-feasibility study enters the stage where a case to proceed with preliminary
engineering design work has been made.
• Intangible assets relate to the Glycine License which is recognised at cost less accumulated
amortisation and impairment losses, if any.
• Trade and other payables primarily relates to trade creditors, which are unsecured and usually
paid within 60 days of recognition and also includes legal fees payable.
• Prior to the Demerger Scheme, Gindalbie, as parent company to Coda, bore all employee
related costs and therefore no provisions for employee entitlements were recorded on Coda’s
balance sheet as at 30 June 2019. Following the Demerger Scheme, Coda now is responsible
for paying its employees and a provision for employee entitlements payable is recorded as at
31 October 2019.
• The capital contribution reserve of $12.04 million as at 31 October 2019 reflects the cash and
asset contributions from Gindalbie, since Coda’s incorporation on 26 April 2018.
95.5 Historical Statement of Comprehensive Income
Unaudited for the Audited for the
Statement of Comprehensive Income 4 months ended 31-Oct-19 period 26-Apr-18 to 30-Jun-19
$ $
Other income - -
Expenses
Administration expenses (504,592) (18,860)
Directors fees, employee salary and on costs expenses (275,388) -
Exploration and evaluation expenses (285,333) (2,301,409)
Other expenses (10,978) (11,638)
Results from operating activities (1,076,291) (2,331,908)
Finance income 4,312 -
Finance expenses (300) (58)
Loss before income tax (1,072,279) (2,331,965)
Income tax expense - -
Loss after income tax (1,072,279) (2,331,965)
Other comprehensive income - -
Total comprehensive loss for the year (1,072,279) (2,331,965)
Source: 2019 Coda Annual Report and Coda management.
We have not undertaken a review of Coda’s unaudited management accounts in accordance with
Australian Auditing and Assurance Standard 2405 ‘Review of Historical Financial Information’ and do not
express an opinion on this financial information. However nothing has come to our attention as a result of
our procedures that would suggest the financial information within the management accounts has not
been prepared on a reasonable basis.
• The audited statement of profit or loss and other comprehensive income for the period to 30
June 2019 reflects the timing of Coda’s incorporation, which only occurred on 26 April 2018.
• Prior to the Demerger Scheme, all of Coda’s employees were paid by Gindalbie, while
administration expenses and exploration & evaluation expenses either incurred initially by
Gindalbie and subsequently transferred to Coda, or incurred directly by Coda.
• Administration expenses of $18,860 for the period to 30 June 2019 includes audit fees of
$9,500, with the remainder being corporate, consultant and other administration costs.
Administration expenses for the 4 months ended 31 October 2019 were higher than that
recorded over the 2019 financial year reflecting the administration expenses transferred to
Coda as part of the Demerger Scheme.
• The Company’s primary expense over the financial year ended 30 June 2019 relates to
exploration and evaluation expenditure on its Mt Gunson Project.
• The other expenses line item relates to amortisation expense in relation to the Company’s
Glycine License. The acquired licenses are amortised using the straight line method over 15
years, which is the estimated useful life and period of contractual rights.
105.6 Capital Structure
The share structure of Coda as at 27 November 2019 is outlined below:
Number
Total ordinary shares on issue 33,463,651
Top 20 shareholders 21,123,675
Top 20 shareholders - % of shares on issue 63.12%
Source: Share registry information provided by Coda.
The range of shares held in Coda as at 27 November 2019 is as follows:
Number of
Number of Percentage of
Ordinary
Range of Shares Held Ordinary Shares Issued Shares (%)
Shareholders
1 - 1,000 9,096 1,917,590 5.73%
1,001 - 5,000 1,392 3,039,083 9.08%
5,001 - 10,000 240 1,730,300 5.17%
10,001 - 100,000 200 5,113,908 15.28%
100,001 - and over 25 21,662,770 64.74%
TOTAL 10,953 33,463,651 100.00%
Source: Share registry information provided by Coda.
The ordinary shares held by the most significant shareholders as at 27 November 2019 are detailed below:
Number of
Percentage of
Ordinary Shares
Name Issued Shares (%)
Held
Angang Group Hong Kong (Holdings) Limited 11,899,834 35.56%
Mr Keith Jones and Mrs Jennifer Jones 2,363,600 7.06%
Ms Linlin Li 1,966,936 5.88%
Citicorp Nominees Pty Limited 1,023,684 3.06%
Subtotal 17,254,054 51.56%
Others 16,209,597 48.44%
Total ordinary shares on Issue 33,463,651 100.00%
Source: Share registry information provided by Coda.
As shares in Coda were distributed to Gindalbie shareholders on a pro-rata basis, Gindalbie’s major
shareholder, Ansteel, is also Coda’s largest shareholder with a 35.56% interest. However, Ansteel has
agreed that it will not participate in an equity capital raising if it occurs within 12 months after the
implementation of the Demerger Scheme.
Coda currently does not have any options on issue. On 19 July 2019, the Company approved the issuance
of 6,000,000 options to key management personnel. The options have an exercise price of $0.30 per share,
and a maximum vesting period of 3 years from grant date with vesting prices of $0.35, $0.40 and $0.45 for
every one-third of options granted. However, the issuance of these options is still subject to finalisation
and implementation of the options schemes.
116. Economic analysis
The Mt Gunson Project and Coda’s headquarters are both based in Australia. A discussion of Australia’s
recent economic trends and monetary policy adopted is provided below.
Domestic growth
The Reserve Bank of Australia (‘RBA’) is expecting Gross Domestic Product (‘GDP’) to gradually pick up to
around 3.0% in 2021. Growth is anticipated to be supported by increased investment in infrastructure and
a pick-up in activity in the resources sector, as mining firms invest to sustain production levels and expand
productive capacity. However, there remains some uncertainty around the outlook for household
consumption. Continued low growth in household income remains a key risk to the outlook for household
consumption, with only modest increases in household disposable income continuing to weigh on consumer
spending. However, signs of stabilisation in the Melbourne and Sydney housing market are expected to
support spending. The RBA lowered the cash rate to a historic low of 0.75% in October 2019. It remained
unchanged at 0.75% for November 2019 and December 2019.
The easing of monetary policy this year is supporting employment and income growth and a return of
inflation to the medium-term target of 2.0%. The lower cash rate has put downward pressure on the
exchange rate, supporting various industries. Lower mortgage rates are expected to boost household
spending.
Inflation
Domestic inflation remains low and suggests subdued inflationary pressures across the economy. The RBA
is expecting underlying inflation to be close to 2.0% over 2020 and 2021.
Employment
Strong employment growth has persisted despite a dampening in expectations for GDP growth, with labour
force participation at a record level. The unemployment rate has been steady at approximately 5.25% over
recent months and is anticipated to remain around this level for some time before declining to just below
5.0% in 2021. The RBA notes that a gradual lift in wage growth would be needed to sustainably lift
inflation to within its medium target range of 2.0% to 3.0%.
Currency movements
The Australian dollar is currently at the low end of the narrow range that it has been trading recently.
Movements in the Australian dollar tend to be related to developments in commodity prices and interest
rate differentials. Since the start of the year, these two forces have been working in offsetting directions,
with commodity prices including gold increasing significantly in June 2019 and Australian bond yields
declining relative to those in other major markets.
Source: www.rba.gov.au Statement by Philip Lowe, Governor: Monetary Policy Decision 3 December and Statement on Monetary
Policy November 2019.
127. Industry analysis
Coda’s primary focus is expected to be the continued development of the Mt Gunson Project. The Project
primarily targets copper and cobalt deposits. Therefore, the price of these two minerals will be a key
determinant in the economic viability of Coda. We discuss the major drivers of these two industries
below.
7.1 Copper
Copper is a soft, malleable, ductile metal used primarily for its electrical and thermal conductive
properties and its resistance to corrosion. It is highly versatile and has a variety of applications in
construction, electrical and electronic components, communications and transportation.
Copper occurs naturally in the Earth’s crust in a variety of forms such as sulphide deposits, carbonate
deposits and silicate deposits. Open pit mining is widely utilised in most copper producing countries
although in Australia, approximately 93% of output is extracted through underground mining. Copper is
often found in conjunction with gold, lead, cobalt or zinc, and a number of industry operators mine these
metals and ores as well.
Copper concentrate is derived from an oxide through beneficiation processes and is then converted to
copper products through smelting and refining. Copper is also 100% recyclable and approximately 80% of
the copper ever produced is still in use today.
According to the World Copper Factbook 2019 published by the International Copper Study Group (‘ICSG’),
the top three countries by copper mine production in 2018 were (in descending order): Chile, Peru and
China. However, in terms of refined copper production for 2018, the same publication ranked China, Chile
and Japan as the top three countries (in descending order).
Global Demand for Copper
Based on the latest full year statistics available on Bloomberg, global demand for refined copper grew
from approximately 18 million tonnes in 2009 to approximately 24.1 million tonnes in 2018, representing a
compound annual growth rate (‘CAGR’) of 3.3%. On a year-on-year basis, global demand for refined
copper has experienced growth in each of the nine years to 2018, although the growth rate varied from as
low as 0.6% for 2016-17 to as high as 7.3% for 2013-14. The ICSG forecasts refined copper usage to
continue to grow in 2019 and 2020, to approximately 24.97 million tonnes and 25.33 million tonnes,
respectively. Prior studies by the ICSG have also found an increasing trend in world refined copper usage
on a per capita basis over the period from 1950 to 2017, although the trend has plateaued in recent years.
Growth in demand is expected to be supported by existing uses such as for the transmission of electricity,
in construction and in electronics, as well as emerging uses such as in electric vehicles, renewable energy
and, as a result of its antimicrobial properties, healthcare.
The following table shows the top five countries by demand for refined copper in 2018, as well as their
trends in demand from 2014. Of these countries, China accounts for approximately half of total global
demand for refined copper and having the highest CAGR amongst the top five countries.
13‘000 tonnes 2018 2017 2016 2015 2014 CAGR%
China 12,515 11,802 11,670 11,357 11,151 2.9%
United States 1,814 1,783 1,811 1,797 1,760 0.8%
Germany 1,204 1,180 1,238 1,220 1,163 0.9%
Japan 1,025 998 973 997 1,073 -1.1%
South Korea 661 674 720 715 751 -3.1%
Others 6,916 7,059 6,945 6,901 6,941 -0.1%
Global refined copper demand 24,135 23,497 23,356 22,987 22,838 1.4%
Source: Bloomberg Intelligence
Global Supply for Copper
The total amount of copper mined also increased from 15.9 million tonnes in 2009 to 20.7 million tonnes
in 2018 (CAGR of 3.0%). Global mined copper production growth was muted coming out of the 2008/2009
Global Financial Crisis with a 0.9% year-on-year growth recorded for 2009-2010 followed by a 0.2% growth
for 2010-2011. Over the subsequent years however, growth improved with 2012-2013 being a particularly
strong year (8.3%). A small contraction in global mined copper production was observed for 2016-2017 (-
1.1%).
The table below shows the breakdown of global mined copper production by the top five countries in
2018, and recent trends in their mine production from 2014. Chile was the largest producer accounting for
28% of global mined copper production, followed by Peru which accounted for 12% of global mined
production in 2018.
‘000 tonnes 2018 2017 2016 2015 2014 CAGR%
Chile 5,832 5,504 5,553 5,772 5,761 0.3%
Peru 2,437 2,445 2,354 1,701 1,379 15.3%
China 1,549 1,681 1,875 1,690 1,759 -3.1%
United States 1,232 1,272 1,447 1,415 1,384 -2.9%
DRC 1,231 1,060 981 972 949 6.7%
Others 8,429 8,205 8,191 7,759 7,294 3.7%
Global mined copper production 20,709 20,167 20,401 19,308 18,525 2.8%
Source: Bloomberg Intelligence
Australia’s copper reserves are second only to Chile’s according to the United States Geological Survey
(‘U.S. Geological Survey’). As depicted in the chart below, Chile, Australia and Peru are estimated to
collectively account for just over 40% of global reserves of copper.
14Copper Reserves by Country
2018
7%
2% Other
2%
25%
Chile
6%
Australia
3%
Peru
6% Mexico
United States
6% China
Indonesia
21%
10% Congo (Kinshasa)
Zambia
11%
Russia
Source: U.S. Geological Survey
Copper Prices
Following a deterioration in global economic conditions in 2008, base metal prices, including copper, fell
sharply. The copper price recovered over 2010 and 2011, to reach a high of approximately US$10,180 per
tonne in February 2011. The recovery in the copper price reflected a steady increase in demand for base
metals, following a pick-up in global industrial production after the Global Financial Crisis.
Between 2011 and 2017, the copper price steadily declined, before increasing in price in mid-February
2017 as a result of strike action at the world’s largest copper mine Escondida, located in Chile.
The average copper price from January 2019 through November 2019 was US$6,004/t, ranging from a low
of US$5,585/t on 3 September 2019 to a high of US$6,556/t on 28 February 2019.
A summary of the historical spot price of copper, based on the quoted price on the London Metals
Exchange in US$ per tonne, and forecasts to 2029 (in nominal terms, free on board) are illustrated in the
chart below
15Copper Spot and Forecast Prices
12,000
10,000
8,000
US$/tonne
6,000
4,000
2,000
0
Forecast Historical
Source: Bloomberg and Consensus Economics
Copper Outlook
The ICSG anticipates global mine production to remain unchanged in 2019 (after adjusting for historical
disruption factors) and to grow by 1.9% in 2020. In 2019, additional output from the start-up of the major
Cobre de Panama mine, the expansion of Toquepala mine and the commissioning of a few small and
medium mines is expected to be balanced by a significant decline in Indonesian output and regulatory and
taxation issues which will negatively impact output from Zambia. Indonesian output is expected to recover
in 2020 which will support global output growth of about 1.9% (after adjusting for possible supply
disruptions).
The ICSG also expects sustained growth in copper demand as it remains an essential commodity to
economic activity, particularly in today’s modern technological society. Infrastructure development in
China and India as well as the trend towards cleaner energy is expected to support demand for the metal.
World apparent refined usage is expected to increase by around 2% in 2019 and 1.5% in 2020. Overall,
global refined copper balance projections indicate a deficit of about 190,000t for 2019 before increasing
to 250,000t for 2020, with growth in refined production expected to lag behind that of usage. The actual
market balances will however, be influenced by the ongoing US-China trade issues and strength of the
global economy, especially that of China.
7.2 Cobalt
Almost all global cobalt production occurs as a by-product of mining other commodities, approximately 38%
of which comes from nickel mining. Therefore, as nickel production increases, cobalt production can also
rise. Cobalt is principally used as a super alloying agent due to its anti-corrosive properties.
Most cobalt is sourced from the Democratic Republic of Congo (‘DRC’), however the country is politically
unstable and mining operations there often use child labour. Consequently, demand for cobalt produced
from Australian mines has also risen as battery manufacturers seek a more reliable and ethical source for
the metal.
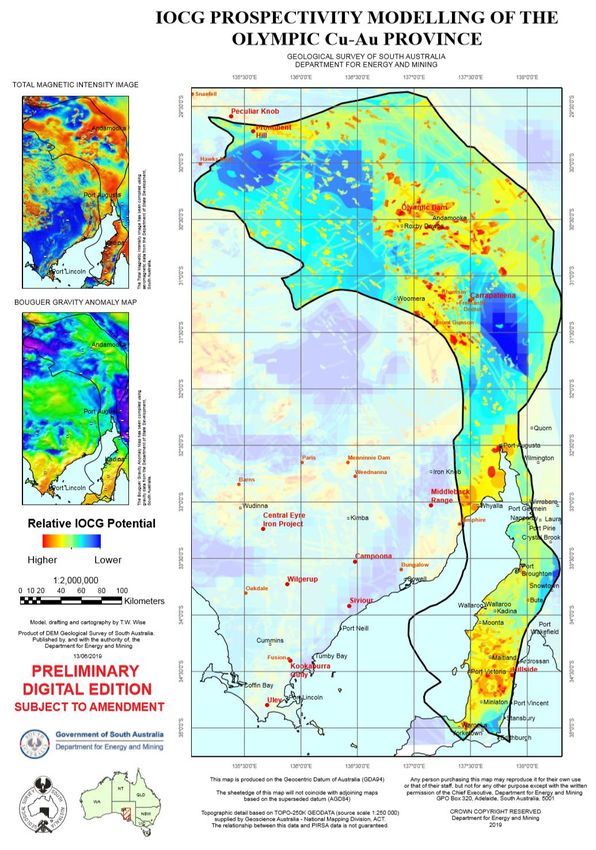
16In 2018, an estimated 140,000 metric tonnes of cobalt were produced. The chart below shows the countries
in which the majority of cobalt was produced in 2018, with the DRC the clear leader in global cobalt
production:
Global Cobalt Production - 2018
19%
Congo
3% Russia
4% Cuba
Australia
4%
Philippines
4%
66% Other
Source: US Geological Survey
The chart below shows the location of the world’s cobalt reserves, with DRC once again accounting for the
largest proportion of global reserves.
Global Cobalt Reserves - 2018
18%
Congo
4% Australia
4% Cuba
50%
Philippines
7% Russia
Other
17%
Source: US Geological Survey
Price Trends
A summary of the historical spot price of cobalt, based on the quoted price on the Asian Metals Exchange in
US$ per pound, and forecasts to 2029 (in nominal terms, free on board) are illustrated in the chart below.
17Cobalt Spot and Forecast
50
45
40
35
30
US$/lb
25
20
15
10
5
0
Historical Forecast
Source: Bloomberg, Consensus Economics
Historical prices
Over the past five years, demand for cobalt has been supported by an increasing demand from battery
manufacturers who use the metal to prevent overheating and to extend the usable life of batteries. As
cobalt is almost entirely produced as a by-product of nickel and copper mining, growth in the price of cobalt
does not necessarily translate to an increase in supply. The falling cobalt price over the past year has
primarily been driven by increasing supply from the DRC. In August 2019, global cobalt producer, Glencore,
announced it would suspend its operations at its copper and cobalt mine in DRC by the end of the year. The
announcement temporarily boosted cobalt prices, with prices exceeding US$17/lb in October 2019, although
prices have moderated since.
Forecast prices
Global cobalt prices are expected to rise due to the lack of viable cobalt resources globally coinciding with
higher global demand. One of the key customers of cobalt is the battery manufacturing industry. While most
of the cobalt required by that industry is used in portable electronic devices, the advent of electric vehicles
is expected to lead to a step change in demand. An average electric vehicle is expected to require nearly
1,000 times more cobalt than a cell phone. However, in the near term, supply is expected to exceed demand
which would limit the price of the metal.
Source: Bloomberg, 2019 World Copper Factbook, 2019 US Geological Survey, Battery Metals Sliding as Other Commodities Stabilize
20 November 2019 Wall Street Journal, BDO analysis.
188. Valuation approach adopted
8.1 Valuation approach
There are a number of methodologies which can be used to value a business or the shares in a company.
The principal methodologies which can be used are as follows:
Capitalisation of future maintainable earnings (‘FME’)
Discounted cash flow (‘DCF’)
Quoted market price basis (‘QMP’)
Net asset value (‘NAV’)
Market based assessment such as a Resource Multiple.
A summary of each of these methodologies is outlined in Appendix 2.
Different methodologies are appropriate in valuing particular companies, based on the individual
circumstances of that company and available information.
For our assessment on fairness of the Offer, we compare the value of the sale price in the Offer to the
value of a Coda share as held by Shareholders.
In our assessment of the value of Coda shares we have chosen to assess the value of the Company using
the NAV methodology. The NAV methodology is predicated on the assumption that a prudent buyer would
pay no more for a business than it would cost to purchase the assets of the business at current market
prices.
We have chosen this methodology for the following reasons:
The FME methodology was not used as it is most commonly applicable to profitable businesses with
steady growth histories and forecasts. The FME methodology is also not considered appropriate for
valuing finite life assets such as mining assets;
A DCF valuation was not used as we have not been provided with forecast cash flows for the
Company;
For the QMP methodology to be considered relevant, a company’s shares must be listed on a
regulated and observable market where the company’s shares can be traded. Furthermore, a
company’s shares should be liquid and the market should be fully informed on the company’s
activities. Coda’s shares are not currently listed on any regulated and observable market. Hence we
do not consider this a suitable method in our valuation;
Given the above and given that Coda has yet to demonstrate a record of historical profitability, the
NAV methodology has been considered as the only appropriate valuation methodology to undertake in
order to value the shares of the Company. Under this methodology, all assets and liabilities of the
entity are valued at market value and this combined market value forms the basis for the entity’s
valuation. Under this basis we assume a knowledgeable and willing, but not anxious, seller acting at
arm’s length. No realisation costs are taken into account under this approach; and
In our NAV assessment, the valuation of the Mt Gunson Project was conducted by SRK Consulting
(Australasia) Pty Ltd (‘SRK’). We are satisfied with the valuation methodologies adopted by SRK,
which we believe are in accordance with industry practices and compliant with the requirements of
the Australasian Code for Public Reporting of Technical Assessments and Valuations of Mineral Assets
(2015 Edition) (‘VALMIN Code’). The specific valuation methodologies used by SRK are referred to in
19the respective sections of our Report and in further detail in the Independent Valuation Report
attached as Appendix 3.
However, the NAV methodology assesses a valuation which reflects control over Coda’s assets. As
Shareholders individually do not have control over Coda’s assets, the valuation derived from NAV needs to
be adjusted to a minority interest basis. We address this adjustment by applying a minority interest
discount based on the inverse of the control premiums observed in the market. We note that majority
shareholder, Ansteel, with its 35.56% interest in Coda, is not considered an eligible shareholder for
participation in the Facility by virtue of its address not being in Australia.
Furthermore, we consider that an additional adjustment to the value of Coda is required due to there not
currently being a liquid and active market in which Shareholders can readily trade their Coda shares in.
We refer to this additional adjustment as a discount for lack of marketability.
In addition to the NAV method with adjustments as discussed above, we have also given consideration to
the value at which Coda shares were transacted recently in an off-market transfer, although we note the
transaction related to only a single transaction from a joint account held by a sophisticated investor, with
the transfer representing approximately 5.4% of the issued capital of Coda.
209. Valuation of a Coda share
9.1 Net Asset Valuation of Coda
The value of Coda’s assets on a going concern basis is reflected in our valuation below:
Unaudited as at
Statement of Financial Position Ref 31-Oct-19 Low value Preferred value High value
$ $ $ $
CURRENT ASSETS
Cash and cash equivalents a 7,253,304 7,253,304 7,253,304 7,253,304
Trade and other receivables 15,212 15,212 15,212 15,212
Prepayments 73,984 73,984 73,984 73,984
TOTAL CURRENT ASSETS 7,342,500 7,342,500 7,342,500 7,342,500
NON-CURRENT ASSETS
Property, plant and equipment 55,891 55,891 55,891 55,891
Exploration and evaluation expenditure b 1,416,359 4,386,000 6,528,000 8,670,000
Intangible assets c 166,774 166,774 166,774 166,774
TOTAL NON-CURRENT ASSETS 1,639,025 4,608,665 6,750,665 8,892,665
TOTAL ASSETS 8,981,525 11,951,165 14,093,165 16,235,165
CURRENT LIABILITIES
Trade and other payables 338,442 338,442 338,442 338,442
Employee entitlements 6,222 6,222 6,222 6,222
TOTAL CURRENT LIABILITIES 344,663 344,663 344,663 344,663
TOTAL LIABILITIES 344,663 344,663 344,663 344,663
NET ASSETS 8,636,862 11,606,502 13,748,502 15,890,502
Number of shares on issue 33,463,651
Value per share ($) 0.347 0.411 0.475
Source: BDO analysis
We have been advised that there has been a significant change in the net assets of Coda since
30 June 2019 as a result of the Demerger Scheme from Gindalbie which occurred on 23 July 2019. In
particular, Coda received a cash contribution from Gindalbie as part of the Demerger Scheme. Therefore,
we have adopted the unaudited balance sheet figures as at 31 October 2019. Where the above balances
differ materially from the audited position as at 30 June 2019, we have obtained supporting
documentation and queried management to provide reasonable grounds for reliance on the unaudited
financial information.
We have not undertaken a review of Coda’s unaudited accounts in accordance with Australian Auditing
and Assurance Standard 2405 ‘Review of Historical Information’ and do not express an opinion on this
financial information. However, nothing has come to our attention as a result of our procedures that
would suggest the financial information within the management accounts has not been prepared on a
reasonable basis.
21The table above indicates the net asset value of a Coda share, when rounded to three decimal places, is
between $0.347 and $0.475.
Note a) Cash and cash equivalents
Subsequent to the period ended 30 June 2019, on 23 July 2019, Coda was demerged from Gindalbie and
received an $8.06 million capital injection from Gindalbie. The movements in the cash balance from 30
June 2019 to the latest practicable date, being 31 October 2019, is set out below. We have also sighted
bank documents that support this balance.
Cash and cash equivalents $
Audited balance as at 30 June 2019 17,542
Add: Cash received from Gindalbie over the period to 31 October 2019 8,190,707
Add: Interest received over the period to 31 October 2019 4,312
Less: Payments to suppliers, employees and for exploration and
(957,121)
evaluation expenditure
Less: Payments for plant and equipment (2,136)
Balance as at 31 October 2019 7,253,304
Source: Coda management
Note b) Exploration and evaluation expenditure
We instructed SRK to provide an independent market valuation of the exploration assets held by Coda.
SRK considered a number of different valuation methods when valuing the exploration assets of Coda. SRK
has valued the Mt Gunson Project on a 100%-interest basis and we have adjusted the value on a pro-rata
basis to reflect Coda’s current 51% interest. We have not applied a discount for minority interest to the
value of Coda’s share of the Mt Gunson Project as we do not consider 51% to be a minority interest.
SRK applied the comparable transaction valuation methodology for Coda’s pre-development mineral
resources and its advanced exploration tenure, with the geoscientific approach and yardstick method
relied on as a secondary valuation methodology, respectively.
The range of values for each of Coda’s exploration assets as calculated by SRK is set out below:
Coda Low value Preferred value High value
Mineral Asset Valuation $ $ $
Pre-development - mineral resources 6,800,000 10,100,000 13,500,000
Advanced exploration tenure 1,800,000 2,700,000 3,500,000
Total mineral asset valuation on a 100% basis 8,600,000 12,800,000 17,000,000
Value of Coda's 51% interest 4,386,000 6,528,000 8,670,000
Source: Independent Valuation Report by SRK
The table above indicates Coda’s 51% interest in the Mt Gunson Project falls within a range of values
between $4,386,000 and $8,670,000, with a preferred value of $6,528,000.
We note that SRK’s valuation range is wide, and this also impacts our range of Coda’s net asset valuation.
The mineral assets are at a comparatively early stage, with the values derived by SRK sourced from a
range of comparable transactions with similar degrees of uncertainty and as such, values that are
transacted over a wide range. This range has been applied to Coda’s mineral assets.
22The mineral resources considered in the SRK valuation are reported in the Indicated category, which
typically have an uncertainty range of +/-30 to 50%. The additional mineral asset in SRK’s valuation is an
exploration target which SRK typically considers an uncertainty range of +/- 100% to be reasonable.
Note c) Intangible assets
We have not made any adjustments to the intangible assets line item which relates to the Company’s
Glycine License. As detailed in SRK’s Independent Valuation Report, this license allows Coda to use certain
technology for the processing of ore on certain tenements and Coda may also sub-licence some or all of its
rights by written agreement and with prior notice to the grantor of the Glycine License, Mining & Process
Solutions. Although Coda has yet to reach a stage where it can begin to process ore, we consider the
Glycine License to still have value to the Company given that it will be able to use this technology in the
future, and also given that it has the option to sub-licence its rights out in the meantime. Therefore, we
have adopted the book value of the Glycine License per the management accounts as at 31 October 2019.
9.1.1. Number of shares on issue
As at 27 November 2019, Coda had 33,463,651 ordinary shares on issue. As at the date of our Report,
there are no Coda options on issue.
9.2 Discount for minority interest
The NAV methodology calculates a valuation which reflects control over Coda’s assets. This value needs to
be adjusted to a minority interest basis reflecting the interests of individual shareholders. This discount
for a minority interest is applied to the NAV valuation to arrive at a value of a Coda share, on a minority
interest basis. A minority interest discount is calculated based on a control premium, which we have
identified from our analysis set out below.
Coda and CPS will ensure that none of the buyers obtain a ‘relevant interest’, as defined in the Act, which
exceeds 20%, or increases an existing ‘relevant interest’ which is already above 20%, by acquiring shares
under the Offer, except to the extent permitted under Chapter 6 of the Act. The Company reserves the
right to seek shareholder approval for a buyer to exceed this 20% relevant interest threshold at its
discretion. At this stage, the Company is not seeking shareholder approval for such a transaction through
the Offer.
Therefore, we consider it appropriate to apply a discount for minority interest as under the Offer, buyers
should not be able to acquire a controlling stake through this Offer, without seeking shareholder approval
first. If Coda were seeking shareholder approval for such a transaction through this Offer, we would then
consider it appropriate to include a premium for control in our valuation of a Coda share.
Control Premium
We have reviewed the control premiums on completed transactions, paid by acquirers of both general
mining and all ASX-listed companies. This analysis was conducted over a ten year period to 20 November
2019. In assessing the appropriate sample of transactions from which we determine a control premium, we
have excluded transactions where an acquirer obtained a controlling interest (20% and above) at a
discount (i.e. less than a 0% premium).
We have summarised our findings below:
23You can also read