UK Electricity Market Reform and the Energy Transition: Emerging Lessons - MIT CEEPR
←
→
Page content transcription
If your browser does not render page correctly, please read the page content below
Working Paper Series

UK Electricity Market Reform
and the Energy Transition:
Emerging Lessons
Michael Grubb and David Newbery

February 2018                                    CEEPR WP 2018-004

                  M ASSACHUSETTS INSTITUTE OF TECHNOLOGY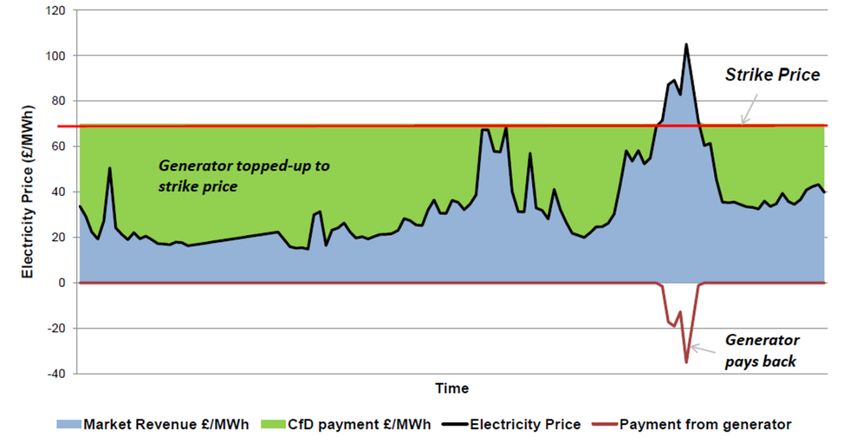
UK Electricity Market Reform and the
         Energy Transition:
                   Emerging Lessons

                         Michael Grubb
  Professor of International Energy and Climate Change Policy, UCL
  & Chair, UK Panel of Technical Experts, Electricity Market Reform
                                and
                         David Newbery
                        Emeritus Professor &
              Director, EPRG, University of Cambridge
About the Authors
Michael Grubb is Professor of Energy and Climate Change at University College London
(Institute of Sustainable Resources & Energy Institute). From 2011-2016, alongside academic
roles, he worked half-time at the UK Office of Gas and Electricity Markets (the energy regulator,
Ofgem), initially as Senior Advisor, Sustainable Energy Policy, and subsequently Senior Advisor,
Improving Regulation. From Autumn 2016 he moved to Chair the UK government’s Panel of
Technical Experts on Electricity Market Reform.
        He has combined research and applied roles for many years, bringing research insights
into policymaking, and bringing practical experience to bear upon academic studies: before taking
up his post at UCL he was part-time Senior Research Associate in Economics at Cambridge
University, combined with (prior to joining Ofgem) Chief Economist at the Carbon Trust.
        Professor Grubb is author of eight books and, sixty journal research articles, and
numerous other publications. His most recent book, Planetary Economics: energy, climate
change and the Three Domains of Sustainable Development (Routledge 2014), brought together
insights from 25 years of research and implementation of energy and climate policies. He was
also founding Editor-in-Chief of the journal Climate Policy, and from 2008-11 served on the UK
Climate Change Committee, established under the UK Climate Change Act to advise the
government on future carbon budgets and to report to Parliament on their implementation.

Professor David Newbery, CBE, FBA, is the Director of the Cambridge Energy Policy
Research Group and Emeritus Professor of Applied Economics at the University of Cambridge. In
2013 he was President of the International Association of Energy Economists. He has managed
research projects on utility privatisation and regulation, electricity restructuring and market
design, transmission access pricing and has active research on market integration, transmission
planning and finance, climate change policies, the design of energy policy and energy taxation
        Occasional economic advisor to Ofgem, former chairman of the Dutch Electricity Market
Surveillance Committee, member of the Panel of Technical Experts offering quality assurance on
the delivery of the UK’s Electricity Market Reform (2014-16). He is currently an independent
member of the Single Electricity Market Committee of the island of Ireland and a panel member
of Ofgem’s Network Innovation Competition.
        Professor Newbery is author of eight books, over one hundred and thirty research articles
and numerous other publications. His book, Privatization, Restructuring and Regulation of
Network Utilities, published by MIT press provides a definitive empirical cross-country study of
de-regulation, liberalization and privatization in electricity, telecoms and gas to assess how
structural reforms can enhance productivity.

Both the authors are writing in their independent academic capacities, and drawing only on
published materials.

                                                                                               2
Contents
About the Authors ............................................................................................................................ 2
Summary........................................................................................................................................... 4
Acronyms .......................................................................................................................................... 5
1.
Introduction: ‘Model or Warning?’ ...................................................................................... 6
2.
UK Electricity in Context ...................................................................................................... 7
2.1 The Evolution of the UK Electricity Supply Industry: The Origins ................................ 7
2.2 The Electricity Industry Structure 1990-2001: The Pool and the Dash-for-Gas............ 9
2.3
The Electricity Industry Structure after 2001 ................................................................ 11
2.4 Electricity Demand and the Retail Market .................................................................... 12
3.
The Intellectual and Political Evolution of UK Electricity Market Reform ...................... 14
4.
A Four-legged Beast? The EMR Package .......................................................................... 18
5.
Results to Date.................................................................................................................... 22
5.1
CfD Allocation and Auctions ......................................................................................... 23
5.2
Capacity Market ............................................................................................................. 27
5.3 Carbon Price Floor and Emissions Performance Standard .......................................... 34
6.
Popular Caricature: ‘Return of the “Central Electricity Generating Board”’? ................... 36
7. Conclusions: The Collapse of Coal, Lessons of Contracting, and Future Challenges ....... 39
References....................................................................................................................................... 42
Data appendix: Notes on Construction of Electricity Bills ............................................................ 44
Figure 1: UK Electricity Generation by Fuel, 1970-2016 ................................................................ 8
Figure 2: UK Electricity Consumption by End Use ....................................................................... 12
Figure 3: Real Industrial and Domestic Bills for Standardized Consumption Level .................... 13
Figure 4: The Four Pillars of UK Electricity Market Reform ......................................................... 19
Figure 5: Carbon Price Support, as Seen by the UK Treasury in Initial Development of EMR .... 19
Figure 6: Structure of the Contracts-for-Difference ...................................................................... 21
Figure 7: Growth of Renewable Electricity Generation in EU Countries since 2005 ................... 26
Figure 8: UK Offshore Wind Cost Reduction across Allocation and Auction Rounds ................ 27
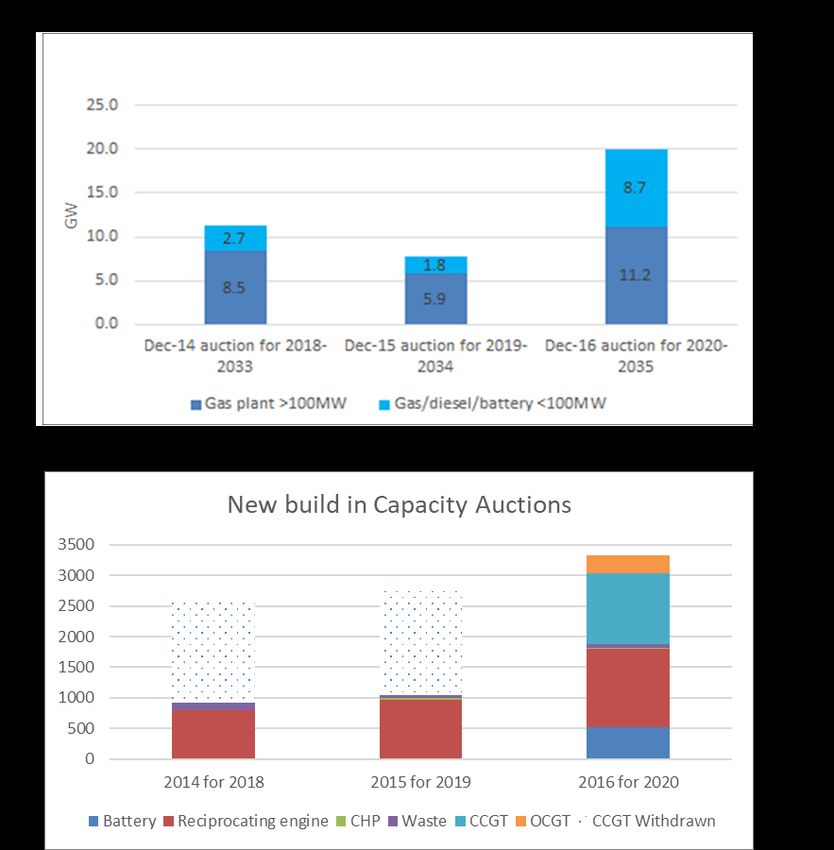
Figure 9: Results of Main Capacity (Four-year Ahead) Auctions .................................................. 28
Figure 10: New Capacity in the Capacity Market, Bids and Approved, 2014-2016 ......................30
Figure 11: Wholesale Electricity Price and the Cost of Generation, 2007-17 (at 2011/12 Prices) . 35
Figure 12: Carbon Price Support and Impact on Coal Generation, 2012-2017 (Q2) .................... 36
Figure 13: UK Quarterly Electricity Generation by Fuel Type, 1997-2017 .................................... 39
Box 1: Pricing and Capacity Payment in the Electricity Pool ...................................................... 10
Box 2: The History of UK Renewables Policy before EMR ......................................................... 17
Box 3: The (Almost) ‘Most Expensive Object on the Planet?’ – the Hinkley Point C Nuclear
Contract .......................................................................................................................................... 24
Box 4: Transmission Charging and ‘Embedded Benefits’ in the Capacity Mechanism .............. 32
3Summary
Until 1990, the UK - like many other countries - had an electricity system that was centralised,
state-owned, and dominated almost entirely by coal and nuclear power generation. The
privatisation of the system that year and its creation of a competitive electricity market attracted
global interest, helping to set a path which many have followed.
Two decades later, however, the UK government embarked on a radical reform which some critics
described as a return to central planning. The UK's Electricity Market Reform (EMR), enacted in
2013, has correspondingly been a topic of intense debate and global interest in the motivations,
components, and consequences.
This report summarises the evolution of UK electricity policy since 1990 and explains the EMR in
context: its origins, rationales, characteristics, and results to date. We explain why the EMR is a
consequence of fundamental and growing problems with the form of liberalisation adopted,
particularly after 2000, combined with the growing imperative to maintain system security and
cut CO2 emissions, whilst delivering affordable electricity prices.
The fifteen years after privatisation, coinciding with the era of low fossil fuel prices, had seen
mostly falling electricity bills; from about 2004 they started to rise sharply, for multiple reasons
including increasing fossil fuel prices, the need for new investment in both generation and
transmission, and inefficient renewables policies.
The four instruments of the EMR have indeed combined to revolutionise the sector; they have
also both drawn on, and helped to spur, a period of unprecedented technological and structural
change. Competitive auctions for both firm capacity and renewable energy have seen prices far
lower than predicted, with the fixed-price auctions for renewable sources estimated to save over
£2bn/yr in the cost of financing the projected renewables investments, compared to the previous
support system. A minimum carbon price level has brought cleaner gas to the fore, displacing
coal. Electricity prices may have peaked from 2015, with energy efficiency helping to lower overall
consumer bills.
New forms of generation have expanded rapidly at all scales of the system. Renewable electricity
in particular has grown from under 5% of generation in 2010, to almost 25% by 2016, and is
projected to reach over 30% by 2020 despite a political de-facto ban on the cheapest bulk
renewable, of onshore wind energy. The environmental consequences overall have been
dramatic: coal generation has shrunk from about 2/3rd of generation in 1990, to 35% in 2000, to
10% in 2016, halving CO2 emissions from power generation over the quarter century.
Neither the technological nor regulatory transitions are complete, and the results to date highlight
other challenges. The Capacity Mechanism has proved ill-suited to encouraging demand-side
response, and in combination with the growing share of renewables, has underlined problems in
transmission pricing. As the share of variable renewables grows further, the associated contracts
will require reform to improve siting efficiency and avoid adverse impacts on the wholesale
market. The results to date show that EMR is a step forwards, not backwards; but it is not the end
of the story.
4Acronyms
BEIS Department for Business, Energy and Industrial Strategy (successor to
DECC, established in 2016)
BETTA British Electricity Trading and Transmission Arrangements (extension of
NETA to include Scotland from 2005)
CCC Climate Change CommitteeCCGT Combined Cycle Gas Turbine
CCL Climate Change Levy
CCS Carbon Capture and Storage
CEGB Central Electricity Generating Board
CfD Contracts for Difference (a fixed-price electricity contract)
CMA Competition and Markets Authority
CoNE Cost of New Entry
CPI Consumer Price Index
CPS Carbon Price Support
DECC Department of Energy and Climate Change
DSR Demand-side Response
EdF Electricité de France
EMR Electricity Market Reform
EPS Emissions Performance Standard
ETS Emissions Trading System
EUA European Union Allowance
GB Great Britain
IED Industrial Emissions Directive
IMF International Monetary Fund
IPP Independent Power Producers
LCPD Large Combustion Plant Directive
LNG Liquefied Natural Gas
LoLP Loss of Load Probability
MIDP Market Index Data Provider
5NETA New Electricity Trading Arrangements (adopted in 2001)
NFFO Non-Fossil Fuel Obligation
Ofgem Office of Gas and Electricity Markets
PPA Power Purchase Agreement
PPP Pool Purchase Price
PTE Panel of Technical Experts (independent advisory committee established
under the Electricity Market Reform legislation
PV Photovoltaic
RECs Regional Electricity Companies (RECs), established after privatisation
ROC Renewables Obligation Certificate
RPI Retail Price Index
SCC Social Cost of Carbon
SMP System Marginal Price
VoLL Value of Lost Load
WACC Weighted Average Cost of Capital
1. Introduction: ‘Model or Warning?’
The UK was widely seen as one of the world’s leaders on electricity deregulation in the
early 1990s. Though the model of liberalisation went through significant changes, many
international observers were surprised when in 2010 the new UK government embarked
on a fundamental reform to the architecture of UK electricity regulation. To many, it
seemed like abandoning the principles of market competition that had been seen as
defining the UK approach.
The Electricity Market Reform (EMR) legislation did indeed represent a radical
change. Prompted by underlying concerns about a lack of investment that threatened to
undermine both security and decarbonisation goals, and politically galvanised also by
rising energy prices, it nevertheless proved highly controversial. The legislation took most
of the 5-year Parliamentary term to complete, and the first auctions under the new system
only took place in December 2014.
The UK’s original liberalisation of electricity was widely seen as a radical
experiment, attracting worldwide interest. The UK’s EMR has, similarly, sparked
widespread interest, with widely divergent views as to whether it represents a potential
model which others could follow, or a warning of the perils of – apparently – returning to
greater state involvement in electricity.
6It is thus still relatively early days, but many lessons can already be drawn. This
paper seeks to:
• summarise briefly the evolution of the UK electricity system, including the underlying
institutional and political context;
• explain the basic reasons why the UK embarked on its EMR – the key intellectual
debates and institutional proponents;
• explain the basic structure of the EMR package as finally defined in the 2013
legislation;
• present the results to date, focusing primarily on the results of contracts issued and
auctions held through to mid-2017;
• draw initial lessons, addressing concerns that the EMR represents a ‘return to central
planning’.
Finally, we reflect on the future challenges and prospects for evolution of the UK
electricity market structure.
2. UK Electricity in Context
2.1 The Evolution of the UK Electricity Supply Industry: The Origins
In England and Wales, from 1947 when the electricity supply industry was nationalised,
generation and transmission were owned by the public Central Electricity Generating
Board (CEGB). The CEGB sold to the 12 Area Boards (the distribution and retailing)
companies under a Bulk Supply Tariff (for energy and peak demand). In Scotland, the
industry comprised two regional vertically integrated companies, and in Northern Ireland
just one vertically integrated company.
Figure 1 shows generation output by fuel from 1970. Until 1955, almost the entire
output was generated from coal, supplied by the National Coal Board, but, under pressure
from the Treasury, oil-fired power stations were built and the first generation of gas-
cooled Magnox nuclear power stations started producing, and the nuclear share rose to
20% by 1990. The share of oil peaked at 34% just before the oil shock in 1972, and
thereafter coal and nuclear power gradually replaced oil until, by the end of the century,
it was down to 1%.
7Figure
1:
UK
Electricity
Generation
by
Fuel,
1970-‐2016
Source: BEIS (2017)
Note: “other” is all thermal generation from other generators (i.e. not the public supply companies), non-
CCGT gas and thermal renewables. Pumped storage (net negative) is not shown. See notes to BEIS (2017)
The Conservative Government under Margaret Thatcher came to power in 1979
after a ‘winter of discontent’, strikes, stagnation and a drastic reduction in public
investment following the oil shocks and a visit of the International Monetary Fund (IMF)
urging austerity in 1976. Her manifesto pledge was to reverse economic decline, roll back
the frontiers of the state, and reduce the power of organised labour. Privatizing state-
owned enterprises started cautiously, but between 1979-92 some 39 companies were
privatized, so that by 1992 the top 100 companies included 17 formerly state-owned
companies (Newbery, 1999). The first public utility to be sold was British Telecom (in
1984) followed by British Gas, the water companies (1989) and finally the electricity
utilities through the Electricity Act 1989 (from 1990 on, ending with the sale of the more
modern nuclear plant in 1995).
By 1989, just before restructuring for privatisation, around 90% of the
conventional thermal generation was from coal, and the share of oil fell rapidly from 7%
to 1% in 2002 (the remainder of thermal generation is largely from by-product gases from
iron, coke and chemicals). The story is quickly told: the miners’ strike in 1984 was
accommodated by a short-lived switch back to oil using a plant built in the 1960s, but
displaced by cheaper coal after the oil shocks of the 1970s. At privatization in 1990, the
UK was supplied by coal and nuclear power with some imports. Shortly after
8privatization, the coal share rapidly declined as nuclear power improved its performance,
and continued declining with the ‘dash for gas’, which was all new entry despite the
considerable spare capacity. At the end of the century, consumption fell with
deindustrialization and increased demand efficiency, while renewables displaced gas
and/or coal, whose shares depended on the very volatile clean (gas) and dark green (coal)
spark spreads (the margin between the wholesale price and the fuel plus CO2 cost).
2.2 The Electricity Industry Structure 1990-2001: The Pool and the
Dash-for-Gas
The state-owned companies were replaced by, in England and Wales (E&W), two fossil
and one nuclear (initially state-owned) generation companies, with an unbundled
National Grid (initially collectively owned by the regional privatized Regional Electricity
Companies, RECs). In Scotland the two vertically integrated companies were sold
bundled, while in Northern Island three generation companies were sold with long-term
power purchase agreements (PPAs).
National Grid and the RECs were regulated, and large customers were free to buy
directly from the wholesale market, which took the form of the mandatory gross
Electricity Pool. This was centrally dispatched with a System Marginal Price (SMP) set
by the marginal price offered by the most expensive unconstrained generator required, to
which was added a capacity payment (see Box 1). One of the most dramatic developments
after privatisation was the ‘dash for gas’; investment poured in to new gas generating
plants, and as shown in Figure 1, gas generation grew from next to nothing in 1992, to
almost a third of generation by 2000.
Multiple factors underpinned this. Outside the electricity market itself, North Sea
gas had largely saturated domestic markets whilst production was still growing, with low
and falling gas prices. A legal ban on using gas for power generation had been lifted and
the new generation of Combined Cycle Gas Turbines (CCGTs) promised far greater
efficiency than existing plant. Given its political history, the conservative government was
happy to encourage the decline of coal, whilst the breaking up of the CEGB, which had
seen the world largely in terms of ever bigger coal and nuclear generation, introduced
players interested in new approaches.
9Box
1:
Pricing
and
Capacity
Payment
in
the
Electricity
Pool
The operation of the electricity pool established after privatisation was defined in terms of a
single price for electricity purchased ‘by the pool’ from generators (Pool Purchase Price). The
System Operator (owned by National Grid) received offers from all individual generating sets
the day before. To meet projected demand, National Grid established a System Marginal
Price (SMP) from the schedule of generation offers, dispatching the generators accordingly
up to the marginal offer which defined the SMP.
To this was added a Capacity Payment, which was designed to compensate for the
‘missing money’ in a system based purely on short-run marginal generating costs:
Capacity Payment = LoLP*(VoLL – SMP), (1)
where LoLP is the Loss of Load Probability in that half-hour and VoLL is the Value of Lost
Load (£5,000/MWh in 2016£). This would give the efficient scarcity price of electricity if the
SMP were the system marginal cost, but generators were free to offer any price, only
constrained by the threat of investigation for anti-competitive behaviour.
SMP + Capacity Payment is the Pool Purchase Price, which, with additional ancillary
service and constraint costs made up the Pool Selling Price. The day-ahead bids received by
National Grid were complex multi-part offers with a raft of additional constraints and
characteristics. National Grid used the old scheduling algorithm to determine a feasible
dispatch. Adjustments during the day were called off the previous day’s offers and charged
out to consumers in the selling price (Green and Newbery, 1993).
In the market itself, the low and falling gas prices were aided by high Pool prices,
and rapidly improving and low capital cost CCGTs. With energy policy left to the market
to guide choices, political risk was considered low and substantial entry by ‘Independent’
Power Producers (IPPs) occurred. These entered on the back of long-term fixed price
contracts (and often share ownership) with the RECs, who could pass on their costs to the
captive franchise domestic market.
Thus, the combination of long-term gas contracts, long term IPP contracts,
regulated pass-through and performance guarantees on the CCGTs, all reduced risk,
whilst an added incentive for the RECs to sign such contracts was to exploit their new
independence from centralised generation. The two fossil generators dominated the
England & Wales Pool and clearly had considerable market power (Newbery, 1995), which
the regulator negotiated down by encouraging them to divest 6 GW of coal plants to a
third generator in 1996. The resulting triopoly was less constrained in exercising market
power, with an incentive to do so as they wished to divest coal plant before the dash for
gas eroded their market share too drastically (Sweeting, 2007). Indeed, by 2000, coal-
based generation had shrunk by more than a third (and increasing amounts of coal were
imported rather than domestically produced).
102.3 The Electricity Industry Structure after 2001
Once they had divested enough plants, the generation companies were free to buy the
supply businesses originally integrated with the RECs. The market evolved towards the
current Big Six generators1 plus retailers. The market power of the triopoly led to an
increasing gap between cost and price in the Pool between 1996-2000, and encouraged
the Government to replace the Pool with New Electricity Trading Arrangements (NETA)
– just at the date (2001) when the price-cost margin collapsed under the weight of
competition and excess capacity (Newbery, 1998; 2005).
NETA replaced central dispatch and the Pool with a self-dispatched energy-only
market (abolishing capacity payments). The argument put forward was that getting rid of
the pool in favour of direct bilateral trading would represent a further step towards
competition. To meet the physical need to balance supply and demand, NETA created a
two-priced Balancing Mechanism. The claimed logic for the reform was that self-dispatch
required generators to submit a balanced offer (i.e. output matched by contracts to
purchase by buyers) and that required them to contract all output ahead of time, thus
removing the incentive to manipulate the spot market (under-contracting encourages
sellers to increase the spot price above the marginal cost, over-contracting to reduce the
price below marginal cost, Newbery, 1995).
In practice, the balancing mechanism was so flawed that it has required many
hundreds of painfully negotiated modifications to approximate an efficient balancing
market. In addition, the risk of incentives to manipulate the spot market was replaced by
a clear incentive to vertical integration: the merger of retailing and generation companies
ensured that they were protected both ways against electricity price uncertainties, since
they would then be selling wholesale to themselves. However, this in turn created major
barriers to entry, and a perception – at least – of the electricity system as an oligopoly of
major power companies controlling the entire system from generation to consumption.
Without heed to these concerns, in 2005, the retrogressive principles of NETA
were expanded to incorporate Scotland in BETTA – British Electricity Trading and
Transmission Arrangements, creating a single Great Britain electricity market.2 This
created a single price zone despite serious congestion on the Scottish border, with its
resulting high redispatch costs (which grew further as wind energy was increasingly
deployed in Scotland).
The EU Target Electricity Model that came into effect in 2014 mandates that
separate price zones are created when there are significant boundary constraints. Had
this been followed, Scottish consumers would frequently enjoy lower prices than the rest
of GB, and the costs of redispatch would have been avoided. These costs rose to hundreds
1Centrica, SSE plc, RWE npower, E.ON, Scottish Power and EDF Energy.
2Leading also to the strange situation that National Grid, as Transmission System Owner and Operator in
England and Wales, became the System Operator of the Scottish grids that remained under the ownership
of the two vertically integrated companies.
11of millions of pounds annually, amounting to £60 million in October, 2014, for a single
(admittedly high cost) month.3
2.4 Electricity Demand and the Retail Market
The pattern of electricity consumption has been far more stable than the pattern of fuel
use in production (Figure 2): initially dominated by industry and domestic use, the former
since the 1970s has declined relatively in favour of ‘other’ (particularly services), whilst
over the past decade, overall demand on the national grid has declined.
Industrial electricity demand in particular stabilised from about 2000, and
domestic (household) electricity demand peaked in 2005: by 2016, industrial and
domestic electricity demand were respectively 21% and 14% below the levels a decade
earlier, despite the GB population growing 10% over the period.4 This reflected a
combination of improved energy efficiency (driven by stronger efficiency standards on
buildings and appliances, and various government programmes), slowed economic
growth after the financial crisis, and the direct impact of rising prices, which also
accelerated structural change in industry.
Electricity consumption 1970-2016
400
350
300
250
other
TWh
200
150 Domestic
100
Industry
50
0 fuel industries
1970
1971
1972
1973
1974
1975
1976
1977
1978
1979
1980
1981
1982
1983
1984
1985
1987
1988
1989
1990
1991
1992
1993
1994
1995
1996
1997
1998
1999
2000
2001
2002
2003
2004
2005
2006
2007
2008
2009
2010
2011
2012
2013
2014
2015
2016
1986(4)
1986(4)
Figure
2:
UK
Electricity
Consumption
by
End
Use
Source: BEIS (2017)
Note: “other” includes Public administration, transport, agricultural and commercial sectors.
3 National Grid October 2014 Monthly Balancing Services Summary, Table 5.1.1, at
https://www.nationalgrid.com/sites/default/files/documents/37743-MBSS_OCTOBER_2014.pdf.
4 Digest of UK Energy Statistics, 2017: Table 5.1.2; Population data:
https://www.ons.gov.uk/peoplepopulationandcommunity/populationandmigration/populationestimates
/datasets/populationestimatestimeseriesdataset
12In contrast, electricity prices (measured in terms of average bill paid for 3,800
kWh, to capture fixed charges) have been considerably more volatile (Figure 3). Once the
big wave of gas investments in the early 1990s had been completed, there was no need for
more capacity. With surplus capacity, increasing competition, and falling fossil fuel
prices, the price declined steadily from the mid-1990s. When fossil fuel prices started to
soar from 2004, electricity prices naturally followed in the now competitive wholesale
market.
Figure
3:
Real
Industrial
and
Domestic
Bills
for
Standardized
Consumption
Level
Source: BEIS (2017)
Notes: CCL is climate change levy, PPP is the Pool Purchase Price (i.e. the wholesale spot price), MIDP is
the Market Index Data Provider prompt wholesale price after 2001, EUA is European (CO2) emission
allowance price. The figure shows in real terms -£(2015, deflated by the Consumer Price Index) the bills
for ‘standard’ domestic customers consuming 3,800kWh, that for industrial customers but using
industrial prices for 3,800 kWh, the wholesale cost of purchasing the domestic demand profile and the
variable cost of generating that power (the gas cost for a 50% efficient gas turbine plus its carbon cost).
See appendix for details.
The decline in electricity demand (in 2013 Ofgem had to revise down its definition
of ‘standard’ domestic consumption to 3,300 kWh/yr per household) helped to contain
electricity bills (the same was true for gas consumption), but of course this was confined
to homes that benefited from such measures. Electricity prices, and in particular the
impact on poor households and industry, became a big political issue at just about the
same time that the government was embarking on EMR.
Ofgem, the energy regulator, does not control wholesale or supplier prices, but
does regulate the transmission and distribution tariffs through incentive regulation,
13initially proposing 5-year price caps for a basket of goods that are indexed to the retail
price index (RPI) and include an efficiency (‘X’) factor, hence RPI-X. This has evolved into
RIIO – (Revenue=Incentives+Innovation+Outputs), lasting for 8 years and starting in
2013 for the transmission network. Ofgem has oversight of the wholesale and retail
markets, but prefers to leave them to competition to deliver efficiency improvements and
to pass these through to final customers.
Periodically, as domestic retail prices rise, politicians, reflecting tabloid headlines,
call for intervention, price caps, or even renationalization, and in response Ofgem initiates
an investigation – in 2008 the Energy Supply Probe, reporting initially later that year.5
This was followed in 2014 by a Competition and Markets Authority (CMA) investigation
into the trading practices and competitiveness of the country's ‘Big Six’ energy companies.
While the CMA found that the wholesale market was workably competitive, they
expressed concern over the retail markets, and proposed various remedies.6 By then,
however the UK was already moving on to yet another round of fundamental reform.
3. The Intellectual and Political Evolution of UK
Electricity Market Reform
The Electricity Market Reform (EMR) that took effect in 2013 was, with hindsight, a long
time in intellectual gestation, and fed from multiple strands of intertwined concerns about
investment, environment, and energy prices.7
The first was a growing concern about investment and security. Theoretically, an
energy-only market would encourage generators to mark-up their offer prices during
periods of scarcity, reflecting the previous capacity element in the pool price. Also
theoretically, investors would predict future scarcity and anticipate higher (scarcity)
prices, which would encourage them to start investments now for delivery at the time of
predicted higher prices.
Several factors undermine this theoretical hope. The first is that futures markets
for electricity are either very illiquid or absent for much more than a year ahead, while it
takes 4-8+ years from final investment decision to plant commissioning. Investors
therefore need to be confident that the market conditions over the next 20-30 years are
moderately predictable on the basis of existing laws and policies, and that demand and
supply conditions are set by commercial conditions (Newbery, 2015). Even without other
considerations, it would be a brave investor to commit billions of pounds to a project
against the prospect of electricity prices rising to reflect growing scarcity, on highly
uncertain timescales, to unknowable levels, but set against the predictable political
pressures that would arise to curtail price rises. The early 2000s already saw a growing
5 See https://www.ofgem.gov.uk/publications-and-updates/energy-supply-probe-initial-findings-report.
6 See https://www.gov.uk/cma-cases/energy-market-investigation.
7 For an overview of many debates and perspectives at the time, see various chapters in Grubb, Jamasb
and Pollitt (2007).
14debate between economists, largely cast between abstract theory and the practical
realities of likely ‘missing money’ in the calculations of cautious and risk-averse investors.
This problem was, however, amplified in multiple ways by additional
considerations. Investment required some confidence in the political landscape and the
determinants of market-driven fossil fuel prices, against which one could at least plausibly
estimate or hedge.
First, UK energy policy had been in turmoil for most of the post-1997 period when
the Labour Party came to power, with arguments over coal, gas, renewables, and
especially nuclear power. There were four Energy White Papers from 2003-2011 (the last
being the precursor to EMR). Given such policy uncertainty, it would take a brave investor
to predict the constraints on and interventions in future electricity markets, and hence
the likely future prices.
Second, in theory, the growing imperative towards environment and particularly
decarbonisation was to be reflected through carbon pricing. The UK model of wholesale
electricity market competition had begun to dominate the discourse in Europe, and the
natural complement of a market approach to electricity was the need to price the CO2
externality. The European Commission moved deftly to exploit the mood of the times and
introduce the European Emissions Trading System (ETS), designed to deliver the EU’s
Kyoto emission targets with an EU-wide carbon price covering about half of total
emissions.
However, the EU ETS has signally failed to deliver an adequate, durable and
credible carbon price signal: it was indeed driven by policymakers creating a system in
the image of the US sulphur trading system,8 and for whom the imperative seemed to be
delivering a relatively short-term emissions target based on ideas of static efficiency
rather than providing anything that investors could rely on for major investments. By the
end of the first trading period in December 2007 the emissions allowance price had fallen
to zero, and although it reached a more realistic €30/tonne CO2 in the second period in
early 2008, it crashed to €15/tonne with the financial crisis, oscillated around that for two
years, and then sank further to well below €10/tonne, from which it has yet to recover.
The emission targets were achieved, but the economic choice between coal, gas and zero-
carbon generation (renewables and nuclear) investment depends critically on the level of
the carbon price over coming decades, and investors had watched as the EU carbon price
collapsed three times within the span of five years.
Third, broader environmental policy, particularly at the domestic (UK) level, was
similarly unstable and hard to predict. The EU’s Renewables Directive (2009/28/EC)9
raised the required share of renewable energy (not just electricity) from 12% in 2010 to
20% of final energy demand by 2020, with each country agreeing its target share. The
UK signed up to a particularly challenging share; starting from one of the lowest
8 The US system had a long-term stable plan and allowed banking of permits to encourage investments,
with considerable success (Schmalensee et al. 1998)
9 http://eur-lex.europa.eu/LexUriServ/LexUriServ.do?uri=CELEX:32009L0028:EN:NOT.
15contributions (barely 1%), its target of 15% implied a dramatic growth of renewables.
With electricity the easiest sector to tackle, this implied foreclosing much of the electricity
market to conventional generation (at least, measured by output). The Directive also
failed to remove allowances now displaced by renewables from the EU ETS, putting
downward pressure on the carbon price. To these conflicting signals was added a slowly
growing realisation that massive renewables entry would, if delivered, crash the wholesale
market electricity price (an outcome predicted in falling utility share prices and realised
most obviously in the German wholesale market). The case for conventional investment
was thus further undermined and mired in uncertainty.
The growing imperative for low carbon investment became the other driving
concern. Domestically, the UK Climate Change Act 200810 was passed and provides a
legal framework for ensuring that Government meets its commitments to tackle climate
change. The Act requires that emissions be reduced by at least 80% by 2050 compared to
1990 levels, and that the Government commit to a series of 5-year carbon budgets.11 Yet,
UK renewables support policy was a shambles (see Box 2), and after a decade of political
efforts to rehabilitate the reputation of nuclear power, the government also wanted to find
a way to get nuclear stations built.
For Britain faced two additional problems. First the Large Combustion Plant
Directive (LCPD) and then the EU Industrial Emissions Directive (IED) set tighter
emissions limits that would force the retirement of older coal plant unless refurbished –
a prospect that for many seemed risky and uneconomic. Second, Britain’s first two
generations of nuclear power stations (the Magnox and Advanced Gas-cooled reactors)
were coming to the end of their lives. By the end of the 2000s, it was expected that some
12 GW of the older coal-fired plant (about 20% of peak demand) would close by the end
of 2015, while an additional 6.3 GW of aging nuclear plant would also close by 2016.
As fossil fuel prices soared towards their peak of 2008, therefore, the UK electricity
model seemed increasingly untenable, as underlined by two official assessments. First,
the UK Climate Change Committee – the body set up to guide implementation of the
Climate Change Act – concluded (CCC 2008) that a market structure built purely around
competition for buying and selling electrons could not deliver low carbon investment.
Added to the generic concerns about investability of the market at all, and the inadequacy
of carbon pricing, electricity prices driven by short-run generating costs could not
conceivably support the capital intensive but cheap-to-run investments that characterised
low carbon sources, whether renewables or nuclear. Gas investments would at least be
hedged by being able to pass through fuel prices into the market; zero carbon investments
in contrast would take all the price risk, of both fossil fuel and carbon price uncertainties.
The NETA/BETTA model, in other words, was in direct conflict with the fundamental aim
of the Climate Change Act, whose core rationale was to give strategic certainty for low
carbon investments.
10 https://www.legislation.gov.uk/ukpga/2008/27/contents.
11 https://www.theccc.org.uk/tackling-climate-change/the-legal-landscape/the-climate-change-act/.
16Box
2:
The
History
of
UK
Renewables
Policy
before
EMR
The UK government first embraced ‘non-fossil’ energy in 1990 when the nuclear power stations
were separated from the CEGB at privatisation, but before it became clear that the markets
could not be persuaded to buy nuclear power. An enterprising civil servant slipped renewable
energy under the banner of support for ‘non-fossil energy’. Nuclear power was subsequently
withdrawn from the Non-Fossil Fuel Obligation (NFFO), leaving the NFFO as a mechanism to
ensure premium payments for electricity generated from renewable energy.
The NFFO invited companies to tender bids in different technology categories. Such
auctions run the risk of ‘winner’s curse’: projects that used the most optimistic assumptions
won bids, but then had to face the reality of risking hard money on construction. A significant
number of winners never proceeded to completion. This could have been resolved by rerunning
auctions, but UK renewables increasingly lagged the Continent, fuelling the desire for change.
In 2002, the government switched policy to undifferentiated Renewables Obligation
Certificates (ROCs). Similar to US ‘Portfolio Standards’, this mandated a fixed and increasing
share of renewable generation. Retailers were obliged to source an increasing share of their
sales from renewables, an obligation discharged either by buying ROCs or paying a buy-out
price of £30/MWh (to assuage fears of excessive costs), with revenue recycled back to the
renewable generators. The renewable generators were responsible for selling their output in a
market and were responsible for imbalances, so developers needed to predict wholesale prices,
imbalance payments, and ROC prices over the future life of their investment. Given that the
RO scheme was widely criticised (Newbery, 2012b and references therein), investors would
furthermore expect that it would be reformed and hence was not a very durable commitment.
Finally, since all renewables competed equally, most of the support ended up going to
the least risky, best-established technologies – mainly onshore wind projects and co-firing
biomass in existing power stations. The fact that the UK domestic renewables manufacturing
had lost out in the 1990s meant that foreign manufacturers were the main beneficiaries. The
focus on onshore wind combined with lack of any visible industrial or innovation benefits
weakened public support, and opposition to planning consents grew. By 2008, UK renewable
capacity ranked almost bottom amongst European countries, despite the UK having some of
the best resources.
Faced with overwhelming evidence of these problems, the government announced in
2006 its intent to reform the system, and in 2009 introduced ‘banding’ – in which the less
developed renewables received multiple credits to foster innovation – and complemented the
price cap with a ‘ski-slope’ that ensured ROC values would be maintained should targets be
overachieved, to give investors the price confidence they had been saying all along was needed.
The UK had in effect been dragged into the messiest, most complicated, and most expensive
way of delivering feed-in tariffs yet conceived.
Source: adapted from Grubb et al (2014), Chapter 9: Pushing further, Pulling deeper: Bridging the
technology valley of death
Then Ofgem, the energy regulator, concerned over the impending threat to energy
security, launched Project Discovery in June 2009.12 The institution seen by many as the
champion and guardian of the liberalized energy model concluded (Ofgem 2010) that that
12 http://www.ofgem.gov.uk/markets/whlmkts/discovery/Pages/ProjectDiscovery.aspx.
17‘[t]he unprecedented combination of the global financial crisis, tough environmental
targets, increasing gas import dependency and the closure of ageing power stations has
combined to cast reasonable doubt over whether the current energy arrangements will
deliver secure and sustainable energy supplies.’ Leaving metaphorical blood on the
boardroom floor as some directors resigned in protest, Ofgem recommended ‘far reaching
energy market reforms to consumers, industry and government.’
Shortly thereafter, the Labour Government lost to a Conservative and Liberal
Democrat coalition, and the newly formed Department of Energy and Climate Change
consulted on Electricity Market Reform in December 2010 (DECC, 2010). It concurred
with Project Discovery that the carbon price was now too low to support unsubsidized
nuclear power and the wholesale electricity price was set by fossil fuel prices (and the
ETS), that ensured that fossil generators had a natural hedge in that electricity prices
mirrored gas and coal prices while non-fossil generation faced volatile wholesale and ROC
prices. It was similarly concerned that security of supply was rapidly becoming an issue
while the market was not delivering the required volume of renewables.
In conclusion, the electricity market was not well suited to delivering either secure
or sustainable electricity – and even ‘affordable’ rang hollow politically as retail electricity
prices continued to rise (figure 3), and industry warned about the high financing costs
arising from the multiple risks surrounding the sector. The UK’s much-vaunted model of
liberalisation was seen to be failing on all three key Government objectives.
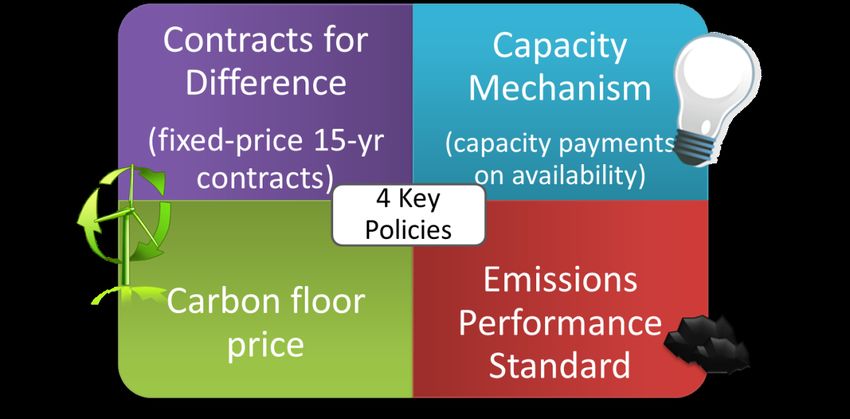
4. A Four-legged Beast? The EMR Package
The resulting White Paper (DECC, 2011) set out an intellectually coherent basis for
electricity market reform (EMR), through a combination of four mechanisms as
illustrated in Figure 4. The lack of a credible carbon price would be addressed by a Carbon
Price Floor, almost immediately enacted by HM Treasury in the Budget in March 2011.
Fossil fuel used to generate electricity would be taxed to bring the minimum price of CO2
up to £16/tonne in 2013, rising linearly to £30/tonne in 2020, and projected to rise to
£70/tonne by 2030 (all at 2009 prices).13
13 HM Treasury, Budget 2011, HC 836, March 2011. The background is that the government had adopted a
Social Cost of Carbon (SCC) for public policy evaluation, following the Stern Report of 2006. At the time,
it was widely expected that the EU ETS would provide a carbon price in this range. As the EU ETS price
sank, however, the resulting inconsistencies led the government in 2009 to shift the focus to a shadow
price of carbon which was differentiated: emission savings from sectors outside the ETS (like households
and transport) would be evaluated at the SCC, but those covered by the EU ETS would be evaluated at a
shadow price which started much closer to the actual EU ETS price at the time (around £12/tCO2), but
rose on the (steeper) schedule indicated in Figure 5, to converge with the SCC at £70/tCO2 (c. £ 250t/C)
in 2030. The carbon floor price was thus targeted to make this ‘shadow price’ real in the electricity sector.
For the subsequent evolution, which has turned the carbon price support into a more explicit objective-
18Figure
4:
The
Four
Pillars
of
UK
Electricity
Market
Reform
Source: Ofgem
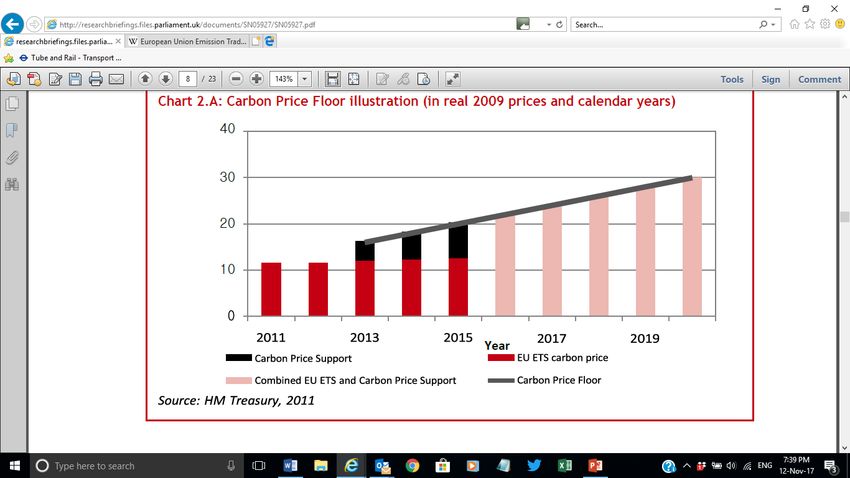
When the EMR legislation was first being developed in 2010-11, the EU ETS price
had hovered around €12/tCO2 (£10/tCO2) for about two years, and the rate was set in
relation to levels two years before. This implied a top-up of just a few £/tCO2 in 2013,
with initial expectation that this would rise slowly (Figure 5). However, with the collapse
of the ETS price during 2011, the top-up required when written in to the legislation by
2013 actually escalated very rapidly.
Figure
5:
Carbon
Price
Support,
as
Seen
by
the
UK
Treasury
in
Initial
Development
of
the
EMR
driven instrument (now rationalised in terms of the level required to phase coal out of the power system,
after which the ‘escalator’ could be restored with lower impact on electricity prices), see section 3.5.
19As any tax could be changed with every budget (and the Carbon Price Floor was
indeed subsequently capped, as explained later), this policy was buttressed by an
Emissions Performance Standard (EPS) that would limit CO2 emissions from any new
power station to 450 gm/kWh “at base load”, intended to rule out any unabated coal-fired
station (with exemptions for the demonstration Carbon Capture and Storage, CCS,
stations which would only require a third or less of output to be subject to carbon
capture).14 The EPS had followed on from experience of a long battle over plans for a new
coal plant at Kingsnorth in Kent, which E.On had proposed in 2006, and served to remove
any ambiguity about UK policy towards coal.15
In terms of policy design, these two steps were relatively straightforward. The
thorny issues concerned how best to support low carbon investment, and how to ensure
system security. The UK’s carbon and renewables targets were estimated to require over
£12 billion investment per year (compared with less than £5 billion in 2008, which was
nearly 80% above the previous decade average).16 This was considerably above financial
analysts’ estimates of the capacity of the Big Six (see footnote 1) to finance, and so new
sources of finance were needed. All zero-carbon generation has very high capital costs and
very low variable costs, which makes their cost highly sensitive to the Weighted Average
Cost of Capital (WACC). By 2020 the cumulative investment in generation alone would
amount to £75 billion (DECC, 2011) and if the WACC could be reduced by 3% (as the
auction discussed below demonstrated), the consumer cost would be reduced by £2.25
billion per year (if all attributed to households, this is about 15% of a typical electricity
bill). Lower risk enabling higher debt made this eminently feasible. As the RO scheme
placed all the market price and policy risk on developers, replacing this by a fixed-price
contract would considerably reduce risk and hence encourage new finance and entry.
The UK was reluctant to adopt the relative simplicity of the technology-specific
German feed-in-tariff model except for very small scale renewables,17 but achieved the
14 The force of ‘base load’ is somewhat unclear. If it is taken as 8760 hrs per year, then a conventional coal-
fired station with emissions of 900 gm/kWh could operate at a capacity factor of 50%, and if the CCS
element emitted 90 gm/kWh on 400 MW (gross, 300 MW net) of a 1,600 MW (gross) supercritical
station (44% efficient), the remaining 1,200 MW might be able to operate at a capacity factor of 78%,
below its normal design rating. The White Paper (at 1.22) therefore allows for exemptions for such
demonstration plants. Other government documents state that the Performance Standard is intended to
rule out any new coal without CCS, and the National Policy Statement for Fossil Fuel Electricity
Generating Infrastructure (EN-2) states that any new coal-fired power plant demonstrate CCS on at least
300 MW (net) of the proposed generating capacity as a condition of its consent
(https://www.gov.uk/government/uploads/system/uploads/attachment_data/file/266882/EPS_Policy_
Brief_RA.pdf).
15 E.On argued that a new coal plant would reduce emissions by displacing older, less efficient plants; and
later, that it would be built ‘capture ready’ (i.e. to include CCS technology as and when it became
commercially viable). After three years of intense controversy, the UK government ‘deferred’ a planning
decision, and shortly afterwards the project was abandoned, with recognition of its incompatibility with
the essential thrust of UK policy and the Climate Change Act.
16 £4.3 billion at 2005 prices (Office of National Statistics)
17 The government had separately moved to adopt feed-in-tariffs for solar and wind technologies below a
certain scale, on the (reasonable) grounds that the transaction costs of the CfD allocation processes would
be unjustifiable, and indeed that small investors would be unable to handle the complexity.
20same basic risk reduction through a ‘Contract-for-Difference’ structure (indeed described
in the White Paper as a ‘CfD with FiT’). Government would pay the difference between
the reference wholesale electricity price and an agreed ‘strike price’ (Figure 6).
Figure
6:
Structure
of
the
Contracts-‐for-‐Difference
Source: Ofgem
This was initially done by publishing a set of strike prices for the CfDs based on
inflated estimates of the required hurdle rate of return (i.e. the WACC) derived by asking
the financial sector what they needed (DECC, 2013), combined with estimates of costs for
different technology bands. Unsurprisingly, there was an enthusiastic uptake. As part of
EMR, DECC had appointed an independent Panel of Technical Experts (PTE) to comment
on the delivery of policies. The PTE’s first report (DECC, 2014) criticized the over-
generous hurdle rate that resulted in high strike prices. This applied to the 15-year
contracts offered to renewable generators. The stakes were even higher for nuclear power,
in which the first (and possibly only) contract was awarded for the Hinkley Point nuclear
station on eye-watering terms of a 35-year contract at £92.5/MWh, roughly twice the then
wholesale price (see Box 3).
For multiple reasons (including pressure from the EU – Directorate-General for
Competition concerning restrictions on allowed State Aid), after this initial round of
‘administered’ contracts, DECC moved to auctions for allocating specified volumes of
renewables, divided into one ‘pot’ for developed technologies, and one for less developed
technologies. As described in the next section, Newbery (2016a) estimates that the
resulting clearing prices for on-shore wind lowered the WACC by 3% real. Unfortunately,
the Conservative Government, in its bid for re-election in 2015 and to appeal to its rural
constituencies, ruled out supporting on-shore wind – and along with it, all the other
21developed ‘pot 1’ renewable technologies - so the dramatic reduction in support prices for
on-shore wind only survived one auction round.
The fourth and final strand of EMR was directed to ensuring security of supply,
through introduction of a Capacity Mechanism. After extensive internal debate and
exploration of international experience, the government rejected the idea of payments
targeted to new entrants (a ‘Strategic Reserve’), in favour of system-wide payments to all
generators who could contract to generate whenever called upon by the System Operator,
National Grid. Wielding the fear of ‘lights going out’, DECC overcame Treasury scepticism
about the need for any capacity mechanism, whilst Ofgem amongst others argued that
targeted supports for new entrants would create perverse incentives, for example, for a
company to close down one plant in order to get subsidies to open another. The prevailing
view became that capacity payments would in effect be a market for reliable capacity, with
a fixed payment (the clearing price of the ‘descending clock reverse auction’) to all who
could provide it. The assumption behind the design, however, was that the UK’s main
need was for new CCGTs, and the system was designed accordingly with auctions held for
delivery 4-years ahead – allowing both for major refurbishment and new plant, with the
latter being offered 15-year capacity contracts.
The auction volumes would be decided by the Minister on the basis of advice from
National Grid on the capacity needed to meet the UK’s security standard – of a Loss of
Load Expectation of 3 hrs per year (on average over a large number of years) – together
with estimates of the ‘de-rating factor’ to reflect technology-specific plant availability.
The institutional set-up behind this structure was itself a challenge. The
government created a separate, government-backed body (the Low Carbon Contracts
Company) to be the counterparty for CfD contracts, whilst National Grid is charged with
both running the Capacity and the CfD auctions. To provide added scrutiny and address
fears of conflicts of interest, the PTE was established, initially to advise on the detailed
design, and then to scrutinise and challenge in particular National Grid’s advice on
capacity procurement. The process was underpinned with an effort to ensure
transparency, with for example the analysis for capacity procurement of both National
Grid and the PTE published each year (for various years, National Grid (2016) and DECC
(2014)). The Minister would then choose the amount of de-rated capacity to procure in a
December auction that year for delivery in four years’ time (hence the ‘T-4 auction’),
supplemented by year-ahead auctions for additional resources (including demand-side
response).
5. Results to Date
This report is written (late 2017) some four years after the UK’s EMR was enacted and the
first administered contracts awarded, and almost three years after the first auctions. This
section summarises the main results to date.
22You can also read