PHILIPPINES ENERGY SECTOR ASSESSMENT, STRATEGY, AND ROAD MAP OCTOBER 2018 - Asian Development Bank
←
→
Page content transcription
If your browser does not render page correctly, please read the page content below
Philippines
Energy Sector Assessment, Strategy, and Road Map

This energy sector assessment, strategy, and road map documents the status and strategic priorities of
the Government of the Philippines in the energy sector. It highlights sector performance, development
constraints, government plans and strategies, past support of the Asian Development Bank (ADB) and
other development partners, and the strategy for future ADB support in the energy sector. It also provides
sector background information for investment and technical assistance operations. The assessment is
based on a systematic review of the Philippines’ energy sector and consultations with the government and
other development partners.

About the Asian Development Bank

ADB is committed to achieving a prosperous, inclusive, resilient, and sustainable Asia and the Pacific,
while sustaining its efforts to eradicate extreme poverty. Established in 1966, it is owned by 67 members—
48 from the region. Its main instruments for helping its developing member countries are policy dialogue,
loans, equity investments, guarantees, grants, and technical assistance.

                                                                                                                PHILIPPINES
                                                                                                                PHILIPPINES
                                                                                                                ENERGY SECTOR ASSESSMENT,
                                                                                                                STRATEGY, AND ROAD MAP
                                                                                                                OCTOBER 2018

Asian Development Bank
6 ADB Avenue, Mandaluyong City
1550 Metro Manila, Philippines                                                                               ASIAN DEVELOPMENT BANK
www.adb.org
PHILIPPINES
ENERGY SECTOR ASSESSMENT,
STRATEGY, AND ROAD MAP
OCTOBER 2018
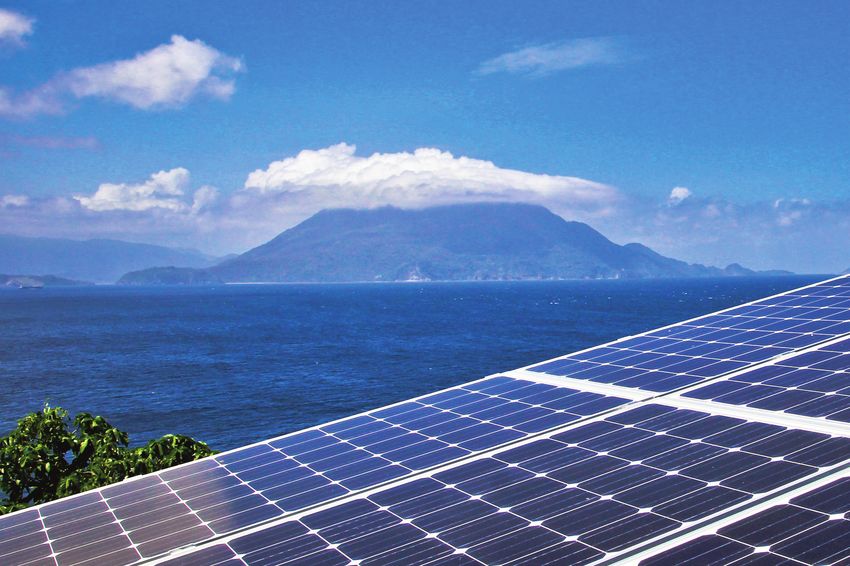
ASIAN DEVELOPMENT BANKCreative Commons Attribution 3.0 IGO license (CC BY 3.0 IGO) © 2018 Asian Development Bank 6 ADB Avenue, Mandaluyong City, 1550 Metro Manila, Philippines Tel +63 2 632 4444; Fax +63 2 636 2444 www.adb.org Some rights reserved. Published in 2018. ISBN 978-92-9261-362-4 (print), 978-92-9261-363-1 (electronic) Publication Stock No. TCS189616 DOI: http://dx.doi.org/10.22617/TCS189616 The views expressed in this publication are those of the authors and do not necessarily reflect the views and policies of the Asian Development Bank (ADB) or its Board of Governors or the governments they represent. ADB does not guarantee the accuracy of the data included in this publication and accepts no responsibility for any consequence of their use. The mention of specific companies or products of manufacturers does not imply that they are endorsed or recommended by ADB in preference to others of a similar nature that are not mentioned. By making any designation of or reference to a particular territory or geographic area, or by using the term “country” in this document, ADB does not intend to make any judgments as to the legal or other status of any territory or area. This work is available under the Creative Commons Attribution 3.0 IGO license (CC BY 3.0 IGO) https://creativecommons.org/licenses/by/3.0/igo/. By using the content of this publication, you agree to be bound by the terms of this license. For attribution, translations, adaptations, and permissions, please read the provisions and terms of use at https://www.adb.org/terms-use#openaccess. This CC license does not apply to non-ADB copyright materials in this publication. If the material is attributed to another source, please contact the copyright owner or publisher of that source for permission to reproduce it. ADB cannot be held liable for any claims that arise as a result of your use of the material. Please contact pubsmarketing@adb.org if you have questions or comments with respect to content, or if you wish to obtain copyright permission for your intended use that does not fall within these terms, or for permission to use the ADB logo. Notes: In this publication, “$” refers to United States dollars. ADB recognizes “China” as the People’s Republic of China and “Korea” as the Republic of Korea. Corrigenda to ADB publications may be found at http://www.adb.org/publications/corrigenda. On the cover: Solar panels from a hybrid energy system on Cobrador Island, Philippines (photo by ADB).
Contents

Tables and Figures                                                        iv
Acknowledgmentsv
Abbreviationsvi
Currency Equivalents                                                      vii
Weights and Measures                                                      vii
I.    Introduction                                                         1

II.   Overall Sector Context                                               2
      A. Energy Resources                                                  3
      B. Energy Balance                                                    4
      C. Forecasts for Energy Supply and Demand                            5
      D. Climate Change                                                    7
III. Institutional Context                                                 8
     A. Government Institutions in the Power Sector                        8
     B. State-Owned Enterprises                                           10
     C. Private Sector                                                     11
IV. Core Sector Issues                                                    13
    A. Electric Power Subsector                                           13
    B. Energy Efficiency                                                  20
    C. Energy Resource Subsectors                                         21
    D. Subsector Constraints                                              30
V.    Sector Strategy                                                     37
      A. Power Sector Priorities                                          37
      B. ADB’s Sector Support Program and Experience                      39
      C. Other Development Partner Support                                40
      D. ADB Experience and Self-Evaluation                               42
      E. ADB’s Sector Forward Strategy and Policy Issues Moving Forward   42
VI. Energy Sector Road Map and Results Framework                          47
Appendix: Energy Sector Problem Tree                                      48

                                                                                 iii
Tables and Figures
Tables
1 Energy Supply Projections for 2040 6
2 Current Transmission Interconnection Capacity in the Philippines 19
3 Approved Feed-In Tariff Rates as of 31 December 2016 28
4 National Energy Targets Set Out by the Philippine Development Plan 2017–2022 38
5 Energy-Focused Legislative Agenda from the Philippine Development Plan 2017–2022 39
6 Major Donor Activities in the Philippine Power Sector, 2010 Onward 41
Figures
1 Regional Real Gross Domestic Product Growth, 2003–2016 2
2 Electricity Demand Growth vs. Real Gross Domestic Product Growth 5
3 Structure of the Power Industry in the Philippines 8
4 Power Generation by Source in the Philippines, 1991–2016 13
5 Supply and Reserve Margins in Luzon, 1987–2016 14
6 Generation in the Main Philippine Grids, 2016 15
7 System Losses in the Philippines 18
8 Installed Renewable Energy Capacity under the Feed-In Tariff Program 29
9 Retail Tariffs for Residential Customers as of September 2017 30
10 Comparison of Generation Charge by Meralco vs. Wholesale Electricity 31
Spot Market Prices
11 Strategic Linkages 43
ivAcknowledgments
This report was prepared by a team led by Shannon Cowlin, senior energy specialist, Energy
Division (SEEN) of the Southeast Asia Department (SERD), with team members: Rehan Kausar,
director, Portfolio Management Division of the Procurement, Portfolio, and Financial Management
Department; Manfred Kiefer, senior economist, Private Sector Transaction Support Division of the
Private Sector Operations Department; Michael Thomas, consultant, and Christopher Starling,
consultant. Guidance and support was provided by Ramesh Subramaniam, director general, SERD;
Andrew Jeffries, director, SEEN; and Kelly Bird, director, Philippines Country Office (PHCO).
The team wishes to thank Yongping Zhai, chief, Energy Sector Group, Sustainable Development and
Climate Change Department; Aekapol Chongvilaivan, country economist, PHCO; and Anthony Jude,
consultant, for their helpful reviews and comments during the preparation of the report. The team
wishes to thank the Department of Communications and SERD staff: April-Marie Gallega, associate
communications coordinator; Mary Grace Huelgas, associate operations officer; and Jeffrey Almera,
senior operations assistant, for their support in preparing and editing the report.
The team wishes to thank agencies and colleagues in the Government of the Philippines for discussions
held during the preparation of the report.
vAbbreviations
ADB Asian Development Bank
ARMM Autonomous Region in Muslim Mindanao
ASR assessment, strategy, and road map
BAU business-as-usual
CES Clean Energy Scenario
DENR Department of Environment and Natural Resources
DOE Department of Energy
EPIRA Electric Power Industry Reform Act
ERC Energy Regulatory Commission
FiT feed-in tariff
FiT-All FiT-Allowance
GDP gross domestic product
GHG greenhouse gas
IMEM Interim Mindanao Electricity Market
LNG liquefied natural gas
NEA National Electrification Administration
NGCP National Grid Corporation of the Philippines
NPC National Power Corporation
NREB National Renewable Energy Board
NREP National Renewable Energy Program
PDP Philippine Development Plan
PEMC Philippine Electricity Market Corporation
PEP Philippine Energy Plan
PNOC Philippine National Oil Company
PPA power purchase agreement
RoR run-of-river
RPS Renewable Portfolio Standard
TPES total primary energy supply
TransCo National Transmission Company
UCME Universal Charge for Missionary Electrification
WESM Wholesale Electricity Spot Market
viCurrency Equivalents
(as of 6 September 2018)
Currency unit – peso (PHP)
₱1.00 = $0.019
$1.00 = ₱53.59
Weights and Measures
GW gigawatt
kV kilovolt
kW kilowatt
kWh kilowatt-hour
Mt million metric tons
MTOE million tons of oil equivalent
MW megawatt
viiI Introduction
1. This sector assessment, strategy, and road map (ASR) reviews the state of the energy sector
of the Philippines. Consistent with the plans and strategy of the Government of the Philippines, the
ASR proposes support actions for the energy sector to be taken by the Asian Development Bank
(ADB) during the period 2018–2023. It also provides sector background information, which will be
updated as needed for investment and technical assistance operations. The ASR is a working paper
based on a systematic review of the country’s energy sector and consultations with the government
and other development partners.
2. The ASR is linked to and informs ADB’s country partnership strategy for the Philippines. The
country partnership strategy sets out principles for assistance and partnership between ADB and the
Philippines. It is aligned with the government’s policies and priorities, and draws upon ADB’s Strategy
2030, which outlines a framework for ADB’s overall operations.1
1
ADB. 2018. Strategy 2030: Achieving a Prosperous, Inclusive, Resilient, and Sustainable Asia and the Pacific. Manila.
1II Overall Sector Context
3. The Philippines is a vast archipelago comprising 7,641 islands in Southeast Asia situated to
the north of Indonesia and the east of Borneo. As of 2015, the population was 100.98 million having
grown by 8.64 million since 2010.2 On the main northern island of Luzon, the administrative regions
of Calabarzon (Region IV-A), the National Capital Region, and Central Luzon (Region III) accounted
for 38.51 million inhabitants or 38.1% of the Philippine population.
4. With a gross domestic product (GDP) of $305 billion in 2016, the Philippine economy is the
third largest in Southeast Asia ranking only behind Indonesia and Thailand. Compared with other
countries in the region, the economy of the Philippines is weighted more toward the services sector
which accounted for 57.3% of overall GDP in 2016. The Philippine economy has continued to grow
robustly over the past few years; during 2016, GDP growth was 6.92% (6.15% in 2015 and 6.07% in
2014) driven by growth in the services (7.4%) and industry (8.4%) sectors.3 The National Capital
Region accounted for the largest share of GDP at 36.6%, though rates of growth are faster in other
regions notably in the Visayas (Figure 1).
5. The economic performance of the Philippines has improved since 2010. The World
Economic Forum’s Global Competitiveness Report 2016–2017 ranked the Philippines as 57th of
Figure 1: Regional Real Gross Domestic Product Growth, 2003–2016
%
14
12
10
8
6
4
2
0
2003
2004
2005
2006
2007
2008
2009
2010
2011
2012
2013
2014
2015
2016
–2
Luzon Visayas Mindanao National
Source: Government of the Philippines, Philippine Statistics Authority.
2
Government of the Philippines, Philippine Statistics Authority. 2017. Philippine Population Surpassed the 100 Million Mark
(Results from the 2015 Census of Population). https://www.psa.gov.ph/content/philippine-population-surpassed-100-
million-mark-results-2015-census-population.
3
Bangko Sentral ng Pilipinas. Statistics. http://www.bsp.gov.ph/statistics/efs_fiscalnia.asp (accessed 9 July 2017).
2Overall Sector Context 3
138 economies worldwide.4 The ranking reflects many of the country’s strengths including the size of
the domestic market and underlying GDP growth. At the same time, the report points to some barriers
to the country’s ability to compete globally including a high cost of doing business. The country’s
score for “policy instability” also worsened relative to the previous year’s study. In the subcategory
“quality of electricity supply” the Philippines ranked 94th, a fall of five places in the rankings. In the
2017 World Bank’s Doing Business report which evaluates the business regulation for domestic firms
across 190 economies, the Philippines ranked 99th—behind Thailand (46th), Viet Nam (82nd), and
Indonesia (91st).5
6. Economic growth has become more inclusive with unemployment reaching historically low
levels (5.5% in 2016) and poverty incidence decreasing to 21.6% in 2015 from 25.2% in 2012 based
on a poverty threshold of ₱21,753 minimum annual income per capita.6 The poverty incidence for
families also declined to 16.5% in 2015 from 19.7% in 2012.7
7. In 2018, the Philippines had investment-grade credit ratings of BBB (Fitch) and Baa2
(Moody’s) with a stable to positive outlook, having been bolstered over the previous years by economic
reforms designed to improve accountability and transparency, fiscal management, debt reduction,
and efforts to boost growth.8 The Philippines received its first-ever investment-grade credit rating
from Fitch in 2012.
8. Consensus forecasts project the economy to grow strongly (from 6.4% to 6.9% in 2016–
2018) supported by expansionary fiscal policy, particularly with respect to public infrastructure
projects.9 Inflation was at 1.8% in 2016, having been driven higher during the second half of the
year due to a weaker peso (vis-à-vis the US dollar), but still lower than the average of 2.7% per year
between 2012 and 2016.10
A. Energy Resources
9. Natural gas and coal remain the predominant indigenous fossil fuel resources in the Philippines;
proven gas reserves are 98.54 billion cubic meters11 and economically recoverable coal is estimated
4
World Economic Forum. 2016. The Global Competitiveness Report 2016-2017. Geneva. http://www3.weforum.org/docs/
GCR2016-2017/05FullReport/TheGlobalCompetitivenessReport2016-2017_FINAL.pdf.
5
World Bank. 2017. Doing Business 2017. http://www.doingbusiness.org/~/media/WBG/DoingBusiness/Documents/Annual-
Reports/English/DB17-Report.pdf.
6
Government of the Philippines, Philippine Statistics Authority. 2016. 2016 Annual Labor and Employment Status;
Government of the Philippines, Philippine Statistics Authority. 2016. 2015 Full Year Official Poverty Statistics of the
Philippines. https://www.psa.gov.ph/content/2016-annual-labor-and-employment-status.
7
Government of the Philippines, Philippine Statistics Authority. 2016. 2015 Full Year Official Poverty Statistics of the
Philippines. https://psa.gov.ph/sites/default/files/2015%20Full%20Year%20Official%20Poverty%20Statistics%20of%20
the%20Philippines%20Publication_0.pdf.
8
Fitch Ratings. 2018. Fitch Affirms Philippines at ‘BBB’; Outlook Stable. https://www.fitchratings.com/site/pr/10038330;
Moody’s. Research and Ratings. https://www.moodys.com/researchandratings/market-segment/sovereign-supranational/-
/005005/005005%7C04208A/-/0/0/-/0/-/-/-/-1/-/-/-/en/global/pdf/-/rra.
9
Consensus forecasts for economic growth include those from ADB and the World Bank. ADB. 2017. Asian Development
Outlook 2017: Transcending the Middle-Income Challenge. Manila. https://www.adb.org/publications/asian-development-
outlook-2017-middle-income-challenge; World Bank. 2017. Philippines Economic Update
April 2017. http://www.worldbank.org/en/news/feature/2017/05/04/philippines-economic-update-april-2017
10
Government of the Philippines, Philippine Statistics Authority. Price Indices. https://psa.gov.ph/business/price-indices
(accessed 9 July 2017).
11
Central Intelligence Agency. The World Factbook. https://www.cia.gov/library/publications/the-world-factbook/geos/
rp.html (accessed 9 July 2017).4 Philippines: Energy Sector Assessment, Strategy, and Road Map
at 316 million tons.12 Proven oil reserves are around 100 million barrels (footnote 11). The resource
potential of hydropower is estimated at 13,097 megawatts (MW).13 Wind energy potential is estimated
at 76,600 MW with wind power densities ranging between 300 watts per square meter (W/m2) and
1,250 W/m2 based on 2014 National Renewable Energy Laboratory geographic information system
data.14 Estimates for potential solar capacity are also promising with the country enjoying average
global horizontal irradiance levels of 5.1 kilowatt-hours/m2/day (footnote 13). Biomass resources from
agricultural residues are likewise available for industrial and household use.
B. Energy Balance
10. Total primary energy supply (TPES) stood at 52.15 million tons of oil equivalent (Mtoe) in
2015 according to the International Energy Agency.15 The primary energy mix is dominated by fossil
fuels (61.0% in 2015), with oil accounting for 32.2%, coal for 23.1%, and natural gas for 5.7%.16 However,
renewable energy accounts for a meaningful share of TPES (36.5% in 2015), owing to a long-standing
use of geothermal and hydro resources for electricity generation and the use of biomass by the
industrial and residential sector (footnote 15).
11. In 2015, the Philippines consumed 29.8 Mtoe of final energy (footnote 16). The biggest share
of final energy is consumed by the transport sector (36%) followed by the industry sector (29%).
ADB estimates that by 2035 the final energy consumption of the Philippines will nearly double
to 49.0 Mtoe.17 ADB’s 2013 Energy Outlook for Asia and the Pacific presented an alternative path
that could ensure future energy security by (i) improving thermal efficiency in power generation,
(ii) increasing contributions from renewable energy, and (iii) shifting toward more energy-efficient
vehicles; in aggregate, these measures would reduce the projected final energy consumption in 2035
to 42.8 Mtoe (footnote 17).
12. A key item on the government’s agenda as set out in the Philippine Development Plan
2017–2022 and the Energy Sector Accomplishment Report for 2016 of the Department of Energy
(DOE) remains the issue of addressing energy security by utilizing indigenous energy resources.
Energy self-sufficiency increased from 57.9% in 2008 to 59.6% in 2011 but has since fallen to 53.5% in
2015 due to greater demand for oil by the transport sector and the increased use of imported coal in
electricity generation, largely sourced from Australia and Indonesia.18
13. Energy security is also emphasized in the DOE’s Philippine Energy Plan (PEP) 2017–2040
which outlines anticipated changes and sets goals for the energy sector by 2040. Energy self-
sufficiency is becoming ever more challenging as the country’s main domestic natural gas field, the
Malampaya field, depletes. Gas from Malampaya is primarily used in domestic power generation, and
12
J. Kessels. 2013. Coal in the Philippines. World Coal. 26 March. https://www.worldcoal.com/coal/26032013/coal_in_the_
philippines_iea_clean_coal_centre/.
13
International Renewable Energy Agency. 2012. Renewables Readiness Assessment: The Philippines. Abu Dhabi. http://
www.irena.org/publications/2017/Mar/Renewables-Readiness-Assessment-The-Philippines.
14
This estimate is based on the following specifications for wind technology: turbine size is 550 kilowatts; hub height is
40 meters; rotor diameter is 38 meters; turbine spacing is 10 rotor diameters in one direction and 5 rotor diameters in
another; capacity per square kilometer is 6.9 MW (Footnote 12).
15
International Energy Agency. 2017. World Energy Balances (2017 edition). Paris.
16
Government of the Philippines, National Economic and Development Authority. 2017. Philippine Development Plan
2017–2022. Manila.
17
ADB. 2013. ADB Energy Outlook for Asia and the Pacific. Manila.
18
Government of the Philippines, Department of Energy. 2018. Philippine Energy Plan, 2017–2040. Manila (draft); and
footnote 15.Overall Sector Context 5
the Philippines is at a pivotal moment for determining its future energy mix beyond its availability.
To attain self-sufficiency and provide for growing energy demand, the DOE has sought to expand
fossil fuel production through exploration and development, and to grow the renewable energy sector.
In addition, strategies to enhance energy efficiency and conservation by end users is aimed at reducing
the resource availability and energy consumption gap.
14. Fuelwood for cooking is being used by more than half of the population (54%) while 35%
use charcoal and 20% utilize biomass residues.19 Burning of traditional biomass results in indoor air
pollution, which has negative effects on health such as respiratory, pulmonary, and cardiovascular
diseases. The practice also contributes to ambient air pollution and climate change through the
emission of carbon dioxide (CO2) and non-CO2 pollutants formed by the incomplete combustion of
biomass. There are no policies that promote the use of clean cooking technologies in the Philippines.
C. Forecasts for Energy Supply and Demand
15. Historically, energy demand growth and economic growth in the Philippines have shared
similar underlying drivers, though the precise relationship may be slowly decoupling particularly in
Luzon (Figure 2). Nevertheless, energy demand increases are expected from growth in the industrial,
commercial, and domestic sectors of each island. In addition, electrification continues; households in
areas that are currently not fully grid-connected, such as parts of Mindanao and Mindoro, are likely to
gain better access to electricity supply in the coming years with a target to reach 100% electrification
across the Philippines by 2022.
Figure 2: Electricity Demand Growth vs. Real Gross Domestic Product Growth
2.6 2016
Luzon 2015
2.4
Visayas
Peak Demand (2001 = 1.000)
2014
2.2 2013
2012
2011
2 2010
2016
1.8
2009 2015
2014
1.6 2007 2013
2008
2006 2012
2010 2011
2004 2005
1.4 2003
2009
2001 2007
1.2 2002 2004 2005 2006
2008
2001 2003
2002
1
1 1.2 1.4 1.6 1.8 2 2.2
Regional GDP (2001 = 1.000)
GDP = gross domestic product.
Sources: Department of Energy. 2017. Annual System Peak Demand per Grid as of 2016. https://www.doe.gov.ph/sites
/default/files/pdf/energy_statistics/annual_system_peak_demand_per_grid_2016.pdf; and Bangko Sentral ng
Pilipinas. Statistics. http://www.bsp.gov.ph/statistics/efs_fiscalnia.asp (accessed 9 July 2017).
19
Government of the Philippines, Philippine Statistics Authority, and Department of Energy. 2013. 2011 Household Energy
Consumption Survey.6 Philippines: Energy Sector Assessment, Strategy, and Road Map
16. Under the assumption of “business as usual” (BAU) in the PEP, DOE anticipates a
4.4% annual growth in TPES to reach 148.1 Mtoe by 2040.20 As power generation and industrial
processing demands increase and natural gas reserves decrease, coal, oil, and geothermal energy are
expected to comprise a large portion of the energy mix. Under an alternative clean energy scenario
(CES), TPES would grow to 137.8 Mtoe—a 7% decrease relative to the forecasted BAU TPES—due to
decreases in fossil fuel use, mainly of oil and coal.
17. Whereas the BAU scenario accounts for demand growth driven by an oil-reliant transport
scenario, the CES is based on the prediction that alternative sources of energy for transport such as
electricity, compressed natural gas, and biofuels will reduce the demand for oil, slowing the annual
rate of oil supply growth—as presented in Table 1 (footnote 20). Both scenarios predict an increase in
coal’s contribution to the energy mix, but in the CES this growth is mitigated somewhat by institutional
reforms to reduce carbon emissions. The BAU scenario assumes 6.7% growth in the natural gas
supply over the 2017–2040 planning horizon which will necessarily come from liquefied natural gas
(LNG) imports if no new domestic gas fields are developed. In contrast, the CES assumes faster
growth in the gas supply due to increased government efforts to promote the use of LNG; though
production from domestic fields will be targeted, some of the gas supply may need to be imported
which would come at the expense of energy self-sufficiency (footnote 20).
Table 1: Energy Supply Projections for 2040
Business-as-Usual Scenario Clean Energy Scenario
Supply Average Growth Supply Average Growth
(million tons of oil from 2016–2040 (million tons of oil from 2016–2040
equivalent) (%) equivalent) (%)
Fossil Fuels
Oil 53.1 4.5 48.8 4.1
Coal 51.3 6.4 40.7 5.3
Natural gas 15.7 6.7 17.1 7.1
Renewables
Geothermal 10.5 0.4 11.7 0.9
Hydropower 3.1 1.9 2.9 1.5
Solar and wind 0.2 0.2 0.4 3.5
Biomass 12.5 2.2 12.3 2.1
Source: Government of the Philippines, Department of Energy.
18. Under the BAU scenario, modest growth in the supply of renewable energy is expected
to result in TPES from renewable energy of 28.2 Mtoe in 2040. Under the CES, renewable energy
supply grows at a slightly faster annual rate resulting in 29.1 Mtoe from renewable energy in 2040.
Geothermal energy is the primary source of renewable energy in both the BAU and CES scenarios.
Under both scenarios, geothermal will contribute the largest share of renewable energy TPES,
43.3% in BAU and 44.3% in the CES (footnote 20). In both scenarios, biomass will be the second
largest share of the renewable energy mix due to the residential sector’s demand for cooking followed
by hydropower. Wind and solar are expected to grow in both scenarios with the CES resulting in more
20
Government of the Philippines, Department of Energy. 2018. Philippine Energy Plan, 2017–2040. Manila (draft).Overall Sector Context 7
than 5 gigawatts (GW) of additional capacity from these sources by 2040. However, in either case,
wind and solar will supply only a small portion of the renewable energy mix.
D. Climate Change
19. The Philippines is highly vulnerable to the effects of climate change owing to its archipelagic
geography, growing population, and risk from flooding. Agriculture represents a meaningful share of
the economy and crop yields could be materially reduced because of climate change.
20. The government is seeking to address the country’s contributions to climate change through
a variety of targets that focus on reducing the energy intensity of the economy and increasing
installed renewable energy capacity. The DOE is actively promoting compressed natural gas, liquefied
petroleum gas, and e-vehicles through the Alternative Fuels for Transportation Program and will
undertake efforts to expand the public mass transport system.
21. On 1 March 2017, the Philippines ratified the climate treaty known as the Paris Agreement
and its associated Nationally Determined Contribution asserts the intention to reduce greenhouse
gas (GHG) emissions (CO2 equivalent) by 70% relative to the country’s BAU scenario for 2000–
2030.21 The energy, transport, waste, forestry, and industry sectors were all listed as sectors that will
contribute to emission reductions; the commitment itself was contingent on financial resources
including capacity building and technology development and transfer being made available to the
country.
22. Notwithstanding ratification, there remains considerable uncertainty around how these
commitments will be achieved particularly given that continued economic development is contingent
on significant increases in power generation capacity. The DOE has officially signaled its “conditional
concurrence” to the country’s commitments under the Paris Agreement. However, under current
targets for the future energy mix of 70% “baseload” capacity, 20% “mid-merit” capacity, and
10% “peaking” capacity (70–20–10), coal generation as the current least-cost form of baseload
generation may remain a priority which could impede progress toward targeted emission reductions.
23. The DOE estimates that under the PEP BAU scenario, GHG emissions from fossil fuels used
in energy production will increase by approximately 5.5% annually through 2040. This will result in
annual emissions of 396.9 million metric tons of CO2 in 2040. Coal will be responsible for 52.4% of
the anticipated emissions, oil-based fuels for 42.4%, and natural gas for 5.2%. Over half of the GHG
emissions will come from power generation. Transport will contribute 28.7% emissions and industry
will produce 13.2% of total emissions (footnote 20).
24. By comparison, the DOE’s CES projects emissions grow at a lower average rate of
4.9% through 2040 resulting in annual GHG emissions of approximately 345.5 million metric tons of
CO2 (footnote 20).
21
Government of the Philippines. 2015. Intended Nationally Determined Contributions. http://www4.unfccc.int/
submissions/INDC/Published%20Documents/Philippines/1/Philippines%20-%20Final%20INDC%20submission.pdf.III Institutional Context
A. Government Institutions in the Power Sector
25. Figure 3 illustrates the current structure of the power industry in the Philippines. The apex
body for governing and developing policy within the country’s power sector is the Department of
Energy (DOE). The DOE is responsible for energy policy and planning including the formulation of
the PEP 2017–2040 and the Power Development Plan. It reports directly to the Office of the President
and is also responsible for supervising the reform process of the sector following the Electric Power
Industry Reform Act (EPIRA).
Figure 3: Structure of the Power Industry in the Philippines
Policy and
Regulatory DOE NEA
Institutions
Generation IPPs
Market
PEMC
Transmission NGCP
Connected
Meralco and Electric
Directly
Distribution
Other PIOUs Cooperatives
Retail Electricity
Supply
Suppliers
Contestable
End Users Captive Customers Customer
Policy
Regulation Supervision Flow of electricity
making
DOE = Department of Energy; ERC = Energy Regulatory Commission; IPP = independent power producer;
NEA = National Electrification Administration; NGCP = National Grid Corporation of the Philippines;
PEMC = Philippines Electricity Market Corporation; PIOU = private investor-owned utility; PSALM = Public Sector
Assets and Liabilities Management Corporation.
Source: Asian Development Bank.
8Institutional Context 9
26. The Energy Regulatory Commission (ERC) is an independent body responsible for regulating
the power industry and, among other duties, is responsible for approving bilateral power supply
agreements, Ancillary Service Procurement Agreements, and setting the distribution wheeling rates
of distribution utilities and electric cooperatives.
27. Other government bodies include the Philippine Competition Commission established
under the Philippine Competition Act of 2015. The Philippine Competition Commission is mandated
to promote free and fair competition across all sectors including energy, can penalize monopolistic
and anticompetitive behavior, and has the authority to approve asset transactions in the power
sector. Both the Philippine Competition Commission and the ERC can exercise their jurisdiction
over anticompetitive behavior “in a concurrent capacity.” However, the ERC’s view is that the agency
where a complaint is first filed will assert their authority though it is not clear how this will work in
practice as no complaints have been lodged thus far.22
28. The EPIRA passed in 2001 is the main foundation of regulation in the energy sector. The
legislation sought to liberalize and unbundle the power sector and promote competition, which
resulted in a significant transformation of the country’s power sector. Privatization was a key part
of the EPIRA-driven reform process which established that power generation should no longer
be considered a public utility operation. The Power Sector Assets and Liabilities Management
Corporation is charged with selling both government-owned power sector assets and the rights to
control capacity contracted to the government by the private sector under long-term power purchase
agreements (PPAs). By the end of 2013, the power sector in the Philippines had become one of the
most extensively privatized power sectors in the region. The EPIRA also required distribution utilities
to procure power in the “least-cost manner” for sale to their franchised captive customers and
required the establishment of a sophisticated Wholesale Electricity Spot Market (WESM).
29. In the years since the passage of the EPIRA, the power sector restructuring in the Philippines
has achieved the following significant milestones:
(i) establishment of the WESM in Luzon and the Visayas;
(ii) establishment of the ERC as an autonomous sector regulator;
(iii) absorption of debt: following the mandate of the EPIRA, the government absorbed
₱200 billion of the debt liabilities of the National Power Corporation (NPC);
(iv) structural unbundling of electricity provision into generation, transmission, and
distribution plus retail supply;
(v) privatization to the point where the private sector now provides most of the
generation, all transmission, and most of the distribution or retail supply;
(vi) introduction of performance-based regulation for electricity transmission and
distribution businesses;
(vii) removal of most subsidies and cross-subsidies;
(viii) reduction of transmission and distribution losses; and
(ix) improvements in electrification coverage, which stands at 89.7% nationally as of
December 2016.23
22
Government of the Philippines, Energy Regulatory Commission. 2017. ERC Asserts Jurisdiction Over Competition Cases in
Energy. http://www.erc.gov.ph/ContentPage/30636.
23
Government of the Philippines, National Electrification Administration. Electric Cooperatives Statistics—Status of
Energization. http://www.nea.gov.ph/status-of-energization/category/119-2016-monthly-reports (accessed 18 March
2018).10 Philippines: Energy Sector Assessment, Strategy, and Road Map
30. Prior to the passage of the EPIRA, three cross-subsidies existed in the electricity supply
sector: industrial and commercial end users subsidizing the residential and public sector, cross-
subsidies between wholesale customers of the NPC in Luzon, and cross-subsidies between the three
major grids. The EPIRA required that these cross-subsidies be phased out following the introduction
of the Universal Charge which was introduced between September 2003 and October 2005.
Today the only subsidies paid by consumers are lifeline rate subsidies, senior citizen subsidies (both
cross-subsidized by other users of the distribution utility), the Universal Charge, and the Feed-in Tariff
Allowance (FiT-All) (the latter two are cross-subsidized by all other grid-connected end users).24
31. Despite the intentions of the EPIRA, challenges remain in ensuring the affordability of
electric power supply. For a variety of reasons, the Philippines has one of Asia’s highest electricity tariff
rates which are explored further in para. 106. Challenges in ensuring adequacy of power supply have
persisted predominantly in Mindanao and, given projected economic growth and associated demand
growth, it could be a challenge to grow generation capacity at the pace of demand growth.
B. State-Owned Enterprises
32. The National Electrification Administration (NEA) is a government-owned and controlled
corporation responsible for promoting full electrification in the Philippines with a focus on the
numerous electric cooperatives that tend to serve less developed areas. The NEA provides loans or
subsidies to the electric cooperatives to establish infrastructure, operations, and facilities necessary
to supply electricity in rural areas. The NEA’s main responsibilities include (i) preparing the electric
cooperatives to operate and compete under a deregulated electricity market; (ii) acting as guarantor
for purchases of electricity in the WESM by electric cooperatives; (iii) strengthening the technical
capability and financial viability of electric cooperatives; and (iv) acting as an administrator of
government grants for extensions of distribution lines in the non-electrified barangays. The NEA
assists in the preparation and integration of the electric cooperatives’ distribution development plans,
each of which contains all major capital investment projects including rehabilitation, upgrading, and
expansion of the distribution system, as well as acquisition of new assets such as subtransmission
lines. The consolidated electric cooperatives’ distribution development plan is submitted to the DOE
for the preparation of a nationwide distribution development plan.
33. The Philippine National Oil Company (PNOC) was formed in 1973 in response to the global
oil crisis and embargo that began in the same year. PNOC was tasked with developing the country’s
indigenous oil resources and securing energy independence; its mandate has subsequently been
expanded to include a spectrum of energy resources including oil, gas, coal, geothermal, and other
renewables. One of the most notable discoveries since PNOC was founded is the discovery of the
Malampaya offshore gas field in 1992. It was later commercialized via the Malampaya Deepwater
Gas-to-Power project in conjunction with Chevron and Royal Dutch Shell, which operates the
field. PNOC has two fully owned subsidiaries: the PNOC Exploration Company which undertakes
exploration, development, and production of the country’s oil, gas, and coal resources, and the
PNOC Renewables Corporation which promotes and develops renewable energy projects. The
Energy Development Corporation was originally a fully owned subsidiary of PNOC that was privatized
in 2007 and now operates 2.7 GW of renewable power generators in the Philippines.
24
The Universal Charge is levied on grid-connected end users and (i) covers the cost of stranded NPC contracts that were
entered into with independent power producers during the 1990s, (ii) subsidizes missionary electrification activities
outside of the main grid, and (iii) sets aside money for watershed rehabilitation and management. The FiT-All is designed
to fund the proportion of the feed-in tariff payments to eligible renewable energy generators that has not been recovered
from the WESM.Institutional Context 11
34. The NPC is a government-owned and controlled corporation that owned and operated all
generation and transmission assets within the Philippines until 1987 when the government began
permitting participation of independent power producers who would bilaterally contract with NPC
via PPAs backed by the government.25 Following the EPIRA in 2001, which mandated the privatization
of generation and transmission assets, the NPC’s responsibilities have been reduced to:
(i) assisting with missionary electrification through its Small Power Utilities Group,
the dominant generation service provider on smaller islands and isolated grids that
cannot be serviced by distribution utilities or other qualified third parties;
(ii) management of 11 watersheds and 22 dams, and certain reforestation and agro-
forestry initiatives;
(iii) preserving and maintaining the never-commissioned Bataan nuclear power plant; and
(iv) management of generation capacity that has not yet been privatized.
35. The National Transmission Corporation was formed under the EPIRA and operated and
managed the transmission network prior to the National Grid Corporation of the Philippines (NGCP)
being awarded the concession in 2008. The National Transmission Corporation remains the legal
owner of the underlying assets. In recent years, one of its principal roles has been to act as the FiT-All
fund administrator responsible for the disbursement of funds to renewable energy developers with
eligible projects.
C. Private Sector
36. Since the EPIRA, there has been substantial privatization across the power industry value
chain. The Power Sector Assets and Liabilities Management Corporation began operations in
July 2001 with the remit that included the privatization of the NPC’s generation and transmission
assets and management of the NPC’s debt obligations and future income from independent power
producers.
37. Several independent power producers currently exist in the Philippines with some major
players having material market shares, both domestic and foreign. Competition laws [EPIRA sec.
45(a)] mandate the ERC to enforce market share limits of generators to 30% of installed capacity
in any of the three regional grids and 25% of national installed capacity. In the case of the Visayan
grid, both Global Business Power Corporation and Energy Development Corporation have essentially
already reached this limit.
38. In 2008, the 25-year concession of the transmission network franchise was awarded to
the NGCP in which the State Grid Corporation of China has a 40% stake. The NGCP is regulated
by the ERC and under the EPIRA is mandated to “improve and expand its transmission facilities” to
“adequately serve generation companies, distribution utilities, and suppliers requiring transmission
service.” The NGCP’s role also includes the procurement of ancillary services necessary to maintain
the stability and security of the grid.
39. Private investor-owned utilities are licensed to sell electricity within their distribution
franchise areas and are similarly regulated by the ERC. In more rural and generally less developed
areas, member-owned and not-for-profit electric cooperatives provide electricity to customers.
25
Executive Order 215 (EO 215) is supported by the Build–Operate–Transfer Laws of 1989 and 1994, and Republic Act
no. 6957.12 Philippines: Energy Sector Assessment, Strategy, and Road Map
40. The Philippine Electricity Market Corporation (PEMC) is a nonprofit entity that reports
administratively to the DOE and has the mandate to manage the WESM. The PEMC produces
the hourly generation schedules (based on generator market offers) which the system operator
(NGCP) then uses to instruct the dispatch of the generation plants. The PEMC can set penalties
for breaches of market rules and is governed by a 15-person board made up of representatives of
the electricity industry and independent members. Intended to operate autonomously until a formal
independent market operator could be appointed, operations of the WESM are being transferred to
the Independent Electricity Market Operator of the Philippines which was established in June 2018.26
26
K. Manalo. 2018. Cusi Hands Over PEMC Control. Daily Tribune. 27 June. http://www.wesm.ph/inner.php/downloads/
rfp_for_imo_operating_agreement.IV Core Sector Issues
A. Electric Power Subsector
1. Generation
41. In 2016, the Philippines generated 90.8 terawatt-hours of electricity27 (Figure 4).
By December 2016, the total installed in the Philippines’ generating capacity had reached
21,423 megawatts (MW)—a year-on-year increase of 2,665 MW (16.2%).28
Figure 4: Power Generation by Source in the Philippines, 1991–2016
TWh
100
Geothermal Hydro Natural Gas
90
Coal Oil Wind
80
Solar Biomass
70
60
50
40
30
20
10
0
00
04
06
08
20 9
02
20 5
03
20 7
01
10
90
14
16
12
13
15
94
98
96
99
92
95
93
97
11
91
0
0
0
20
20
20
20
20
20
20
20
20
20
20
19
20
20
20
19
19
19
19
19
19
19
19
19
TWh = terawatt-hour.
Source: Government of the Philippines, Department of Energy.
42. In the 1970s and 1980s, the country’s power sector experienced deteriorating service,
perceived mismanagement, and high debt levels. An extended period of negligible capacity
development compounded by the shelving of the 620 MW Bataan nuclear power project led to power
shortages from 1989 which, at their height saw multiple 10-hour to 12-hour outages in Mindanao
during 1990–1991 and frequent rotating brownouts lasting 8–10 hours in Luzon in 1992.29
27
Government of the Philippines, Department of Energy. List of Existing Power Plants. https://www.doe.gov.ph/list-existing-
power-plants (accessed 26 June 2017).
28
Government of the Philippines, Department of Energy. 2017. Summary 2016 Power Statistics. https://www.doe.gov.ph/
sites/default/files/pdf/energy_statistics/summary_2016_power_statistics_final_march_27_2017.pdf.
29
G. Delgado. 2015. The Power Crisis in the 90s. Blog. Gaad Thinks.
1314 Philippines: Energy Sector Assessment, Strategy, and Road Map
43. The Electric Power Crisis Act was passed in an effort to alleviate the crisis and was followed
by an expansion of the private sector-oriented Build–Operate–Transfer Law that saw a surge in
the construction of power stations by the private sector in the mid-to-late 1990s. The NPC signed
around 22 government-backed PPAs with private sector independent power producers from 1991
to 1993, amounting to 2.65 GW of capacity. By 1997, the number of PPAs signed with private sector
investors had reached 37. A significant block of generation capacity was developed around 2001 to
utilize natural gas from the newly developed offshore Malampaya field.
44. These major capacity developments and corresponding PPAs coincided with a period of
optimistic electricity demand forecasts. When the forecast demand did not materialize, parts of the
Philippines—mainly in Luzon—were left with significant excess capacity and corresponding PPA-
related costs. Coupled with the 1997 Asian Financial Crisis, this led to considerable debt accumulated
in the sector. As demand grew and reserve margins decreased, excess coal-fired capacity decreased
and reserve margins are now roughly tracking demand growth (Figure 5).30
Figure 5: Supply and Reserve Margins in Luzon, 1987–2016
GW
16
14
12
10
8
6
4
2
0
1990
1988
1989
1994
1996
1992
1995
1987
1993
1997
1998
1999
2000
2001
2002
2003
2004
2005
2006
2007
2008
2009
2010
2011
2012
2013
2014
2015
2016
1991
Dependable Capacity Peak Demand Demand + Required Reserve
GW = gigawatt.
Source: Government of the Philippines, Department of Energy.
45. Today, the overall energy mix of the Philippines for electricity generation is relatively diverse
with significant indigenous fuel supply, mainly natural gas, some coal, and varied renewable energy
resources.
46. Historical resource development policies have led to each main island region (Luzon,
Visayas, and Mindanao) being characterized by a different fuel mix for power generation and
exposed to different risks (Figure 6). Natural gas sourced from the large Malampaya fields is a
30
Government of the Philippines, Department of Energy. Philippine Power Statistics. Manila. (30 years: 1987–2016).Core Sectors Issues 15
dominant feature of the Luzon region. Geothermal energy concentrated in Leyte and Negros is a
distinctive feature of the Visayas region and accounts for around half of the power generation in
that region. Highly seasonal hydro-based generation is the defining feature of the Mindanao power
system. These signature resources are supplemented by coal-fired capacity that accounts for
40%–50% in each of the three regions. Oil-fired capacity remains a significant feature of the
Mindanao generation mix but its peaking role in Luzon and the Visayas has diminished in recent years
due to much-improved capacity margins and the rise of solar and wind energy.
Figure 6: Generation in the Main Philippine Grids, 2016
90 TWh 67 TWh 13 TWh 11 TWh
6% 4%
5% 22%
48% 50% 41%
Biomass
43% Solar
Wind
Oil
Coal
Natural Gas
22% 30% Hydro
46%
27% Geothermal
9%
8%
12% 8%
6%
Total Luzon Visayas Mindanao
WESM
TWh = terawatt-hour, WESM = Wholesale Electricity Spot Market.
Source: Government of the Philippines, Department of Energy. 2017. 2016 Power Statistics—Gross Power Generation by Plant
Type. https://www.doe.gov.ph/sites/default/files/pdf/energy_statistics/bgross_power_generation_by_plant_2016.pdf.
47. Luzon which accounts for around 73% of total generation in the Philippines has three large
combined cycle gas-fired power plants in Batangas (Sta. Rita, San Lorenzo, and Ilijan) of 2,880 MW
aggregate installed capacity. These plants operate largely in a baseload regime due to the high
take-or-pay gas quantities specified in the Malampaya gas supply. This results in distortion of the
merit order and displacement of coal. As a result, coal units have had to play the principal “swing”
role in responding to load growth, seasonal demand patterns, diurnal demand cycles, variations in
hydropower output, and temperature-dependent loads. The cost of electricity generated from the
Malampaya natural gas is significantly higher than the cost of an equivalent amount of electricity
from existing or new coal-based capacity, resulting in an upward pressure on Philippine electricity
prices. A more economic dispatch of the gas power stations would suggest the natural gas-based
generation being concentrated in higher demand periods and during periods of planned or unplanned
capacity outages.16 Philippines: Energy Sector Assessment, Strategy, and Road Map
48. The government has sought to maximize the use of indigenous renewable resources since
the enactment of the Renewable Energy Law in 2008. The DOE subsequently launched the National
Renewable Energy Program (NREP) in 2011 which established targets and a road map by which to
achieve them. The Philippines introduced a feed-in tariff (FiT) in 2015 which spurred the development
and commercialization of 0.68 GW of solar capacity, 0.43 GW of wind, and 0.20 GW of biomass,
adding to the existing 1.69 GW installed capacity for geothermal and 3.18 GW for hydropower.31
Despite these achievements, significant renewable energy potential remains untapped.
2. Demand
49. Total electricity consumption reached 888 kilowatt-hour per capita in 2016.32 Compared to
other developing countries in Asia, economic development in the Philippines has been less energy-
intensive (measured in electricity consumption per gross domestic product per capita) because of
higher contributions to growth by the services sector. Nevertheless, development is coupled with
electricity consumption and the demand continues to increase along with economic growth.
50. The DOE predicts peak demand for electricity in Luzon to grow by 4.78% annually from 2016
to 2040—from 9,726 MW in 2016 to 14,501 MW in 2025, reaching 29,852 MW by 2040.33 On face
value, projects under development by the private sector are more than sufficient to meet the expected
demand growth: the DOE reported a pipeline of 19,934 MW of capacity under development.34 This is
comprised of 4,264 MW of “committed” projects due to go online from 2017 to 2022 and 15,670 MW
of “indicative” projects from 2017 to 2025.35
51. The rate of peak demand growth for electricity in the Visayas is expected to be higher than in
Luzon. The DOE projects peak demand in the Visayas to grow by 6.85% annually from 2016 to 2040—
from 1,878 MW in 2016 to 3,427 MW in 2025, and 9,210 MW by 2040 (footnote 35). The DOE
reported a pipeline of 4,095 MW of capacity under development by the private sector comprising
468 MW of “committed” projects and a further 3,627 MW of “indicative” projects (footnote 36).
During 2016, the Visayas region rapidly transitioned into a state of oversupply following the addition
of 323.9 MW of solar power plants in Negros and Leyte and two coal-fired plants totaling 285 MW
in Panay.
52. Expectations for robust demand growth in Luzon and Visayas are mirrored in Mindanao.
Historically undersupplied and subject to demand curtailment (power outages), recent additions of
coal-fired capacity have eased curtailments and otherwise unmet demand leading to significantly
increased electricity usage. Peak demand in Mindanao reached 1,653 MW in 2016.36 This is expected
to grow by 7.54% every year from 2016 to 2040 to reach 3,456 MW by 2025 and 10,225 MW by 2040
(footnote 35). Despite the improved supply and demand situation, Mindanao’s hydropower supplies
31
Government of the Philippines, Department of Energy. 2017. FIT Monitoring Board Summary as of 31 December 2016.
https://www.doe.gov.ph/national-renewable-energy-program?q=renewable-energy/fit-monitoring-board-summary.
32
Government of the Philippines, Department of Energy. 2017. 2016 Power Statistics - Electricity Consumption. https://www.
doe.gov.ph/sites/default/files/pdf/energy_statistics/electricity_sales_and_consumption_2016.pdf; and footnote 3.
33
Government of the Philippines, Department of Energy. 2017. Power Development Plan 2016–2040. Manila.
34
Government of the Philippines, Department of Energy. Private Sector Initiated Power Projects. https://www.doe.gov.ph/
private-sector-initiated-power-projects (accessed 27 June 2017).
35
The DOE lists “indicative” projects as generally being those that are at the feasibility study, permitting, or pre-construction
stage in their project development. “Committed” projects have a higher degree of certainty that they will come online, have
typically entered the construction phase of project development, and have a relatively fixed commercial operations date.
36
Government of the Philippines, Department of Energy. 2017. Annual System Peak Demand per Grid as of 2016. https://
www.doe.gov.ph/sites/default/files/pdf/energy_statistics/annual_system_peak_demand_per_grid_2016.pdf.Core Sectors Issues 17
are subject to variation due to water availability, particularly in El Niño years. Hydropower accounted
for 52% of generation capacity in 2013, but even the current share of 27% is high enough to pose a risk
of seasonal power shortages in future El Niño years. On the other hand, 1,289 MW of new capacity
could come online by 2019 if all currently “committed” projects materialize and the DOE is tracking a
further pipeline of 3,627 MW of capacity as being “indicative” (footnote 36).
53. Outside of the three main grid-based regions of Luzon, Visayas, and Mindanao, total off-
grid demand amounted to 209.86 MW in 2015 (around 1.6% of total) (footnote 35). On smaller
islands and isolated grids, power provision by new power providers, independent power producers,
and qualified third parties is increasingly being encouraged but the NPC-Small Power Utilities Group
still acts as the main provider in these regions. However, many of the areas served by the NPC-Small
Power Utilities Group still do not get reliable and 24-hour electricity services. As of July 2017, of the
123 NPC-Small Power Utilities Group existing power plants nationwide, 76 are operating less than
24 hours per day, indicating unmet demand. Some small island electric cooperatives also operate
diesel generator sets that may only provide 4 hours to 6 hours of electricity per day.37 Much of the
off-grid demand lies on the islands of Masbate, Palawan, and Mindoro, and there are tentative plans
by the NGCP to interconnect the latter to the main Luzon grid as discussed further in the succeeding
section.
3. Transmission
54. Grid infrastructure across the Philippines will face increasing pressure for expansion and
reinforcement to support demand growth. Grid development is invariably complicated by the
difficulties of securing rights of way. Regional misalignments of supply and demand have become a
prominent feature over the last 2 years, most notably in the Western Visayan regions of Panay and
Negros where the addition of significant renewable energy capacity (mainly solar) has created grid
congestion that limits the potential benefit of renewable energy resources in these locations.
55. The quality and strength of the grid within the Philippines is also subject to significant regional
variation. Luzon, representing around 73% of total load requirements within the Philippines, has
inherently been at the focus of grid infrastructure improvements. In 2016, transmission and distribution
losses in Luzon were 7.87%, compared to 11.81% in Visayas and 13.68% in Mindanao (Figure 7).38
56. As the concessionaire responsible for managing, operating, and investing in the
transmission grid, a heavy burden of responsibility rests on the NGCP to fulfill its mandate with
the Energy Regulatory Commission (ERC) also playing a pivotal role in having to approve major
capex projects. Projects in the NGCP’s most recent Transmission Development Plan (2014–2015)
published in December 2016 underscore the differing stages of development of each of the three
main regional grids.
57. The NGCP’s focus in Luzon is on strengthening the transmission system and improving
reliability and resilience through extensions of the existing 500-kilovolt (kV) transmission backbone
from around the main load center of Metro Manila and into the generation heartlands of Western
Luzon and Batangas. The NGCP is also due to undertake a looping of the Northern Luzon 230 kV
37
National Power Corporation Small Power Utilities Group. 2017. Grid Statistics. http://www.spug.ph/index.php/2015-05-27-
06-23-45 (accessed 1 December 2017).
38
Government of the Philippines, Department of Energy. 2017. 2016 Power Statistics—Electricity Consumption. https://
www.doe.gov.ph/sites/default/files/pdf/energy_statistics/electricity_sales_and_consumption_2016.pdf; Government of
the Philippines, Department of Energy. 2017. 2016 Power Statistics—Gross Power Generation by Plant Type. https://www.
doe.gov.ph/sites/default/files/pdf/energy_statistics/bgross_power_generation_by_plant_2016.pdf.You can also read