Sustainable Energy for All (SE4All): Rapid Assessment and Gap Analysis Republic of Fiji - Pacific Climate Change Portal
←
→
Page content transcription
If your browser does not render page correctly, please read the page content below
Republic of Fiji

Sustainable Energy
  for All (SE4All):
Rapid Assessment and
     Gap Analysis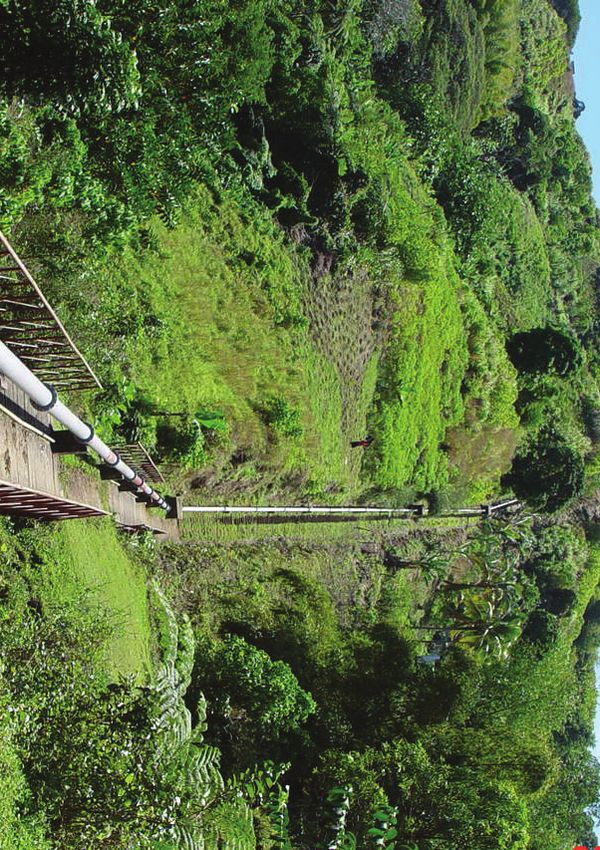
Republic of Fiji

Sustainable Energy for All (SE4All):
  Rapid Assessment and Gap Analysis
              This is a publication of the Government of Fiji.

  This document was prepared by the National Energy Policy Review
  Advisory Committee, chaired by the Department of Energy, with the
  assistance of Economic Consulting Associates Limited and SMEC.

  The National Energy Policy Review Advisory Committee was made
  up of the Department of Energy and the Department of Transport of
  the Ministry of Transport, Works and Public Utilities, the Ministry of
  Strategic Planning, National Development and Statistics, the Climate
  Change Unit of the Ministry of Foreign Affairs, the Reserve Bank of Fiji,
  the Deutsche Gesellschaft für Internationale Zusammenarbeit (GIZ)
  and the United Nations Development Programme (UNDP).

  The energy policy review process including preparation of the Fiji
  SE4ALL Rapid Assessment and Gap Analysis was supported by the
  German Government through the Coping with Climate Change in the
  Pacific Island Region (CCCPIR) programme, jointly implemented by
  GIZ and the Secretariat of the Pacific Community (SPC) and by the
  UNDP Pacific Centre.

                                Sustainable Energy for All (SE4All): Rapid Assessment and Gap Analysis i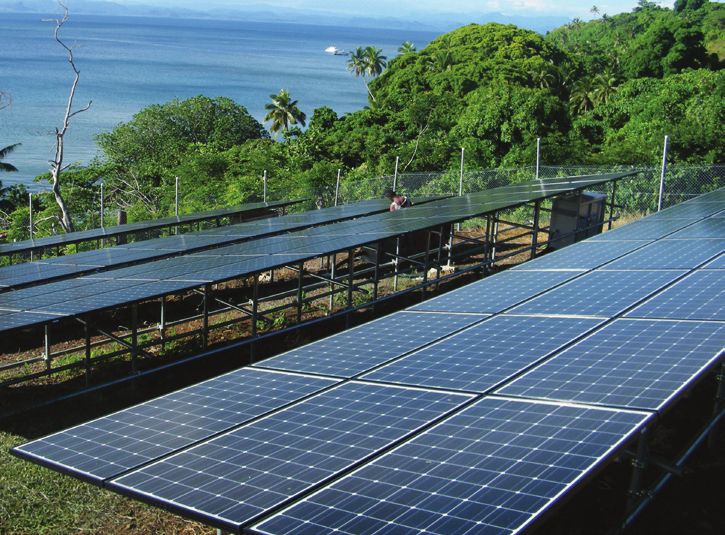
Contents
Abbreviations and Acronyms                                                  iv

Map of Fiji                                                                 ivi

Executive Summary                                                            1

1       Introduction                                                         6
        1.1     Country Overview                                             6
        1.2     Energy Situation                                             9

2       Current Situation with regards to SE4ALL Goals                      17
        2.1 Energy Access vis-à-vis Goal of SE4ALL                          17
        2.2 Energy Efficiency vis-à-vis Goal of SE4ALL                      25
        2.3 Renewable Energy vis-à-vis Goal of SE4ALL                       28
        2.4 Consolidated Summary                                            30
        2.5     SE4ALL Targets                                              31

3       Challenges and Opportunities for Achieving SE4ALL Goal              37
        3.1 Institutional and Policy Framework                              37
        3.2 Programmes and Financing                                        42
        3.3 Private Investment and Enabling Business Environment            46
        3.4     Gaps and Barriers                                           49

A1      References                                                          52

A2      Physical Extension of FEA Grid in Viti Levu                         54

A3      Hydro Potential in the Main Islands                                 55

A4      Geothermal Potential in the Main Islands                            56

A5      Supply and Demand Model SE4ALL Targets                              58

ii Sustainable Energy for All (SE4All): Rapid Assessment and Gap Analysis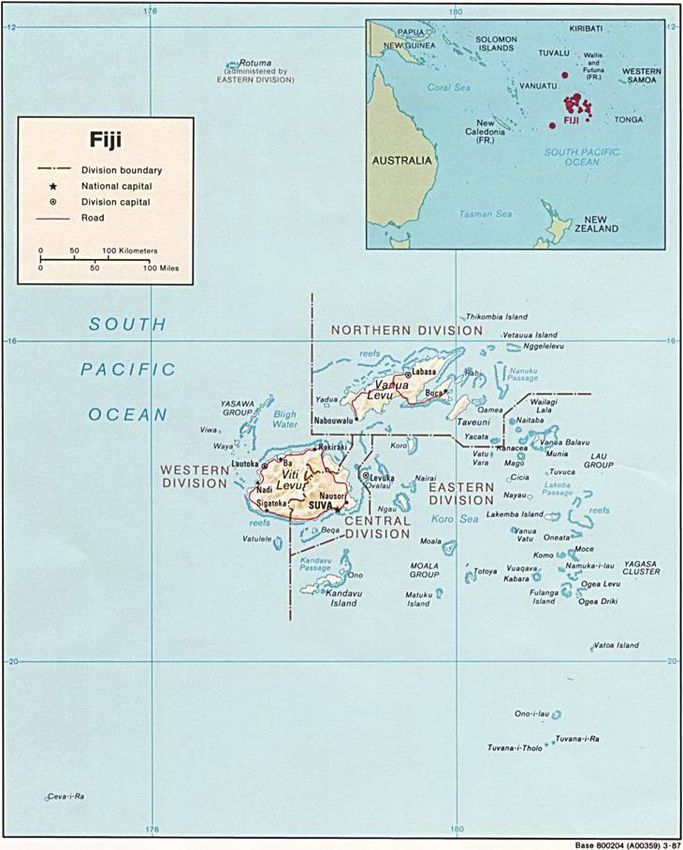
Tables
Table 1 Fiji population by geographic sector                                                                           6
Table 2 GDP per capita 2008 – 2011                                                                                     7
Table 3 Fossil fuel supply (retained imports)                                                                         10
Table 4 Electricity supply by FEA                                                                                     11
Table 5 Estimated consumption of petroleum in Fiji by industry (kilolitres) 2000                                      12
Table 6 Electricity demand projection 2013 – 2020                                                                     12
Table 7 Access to grid electricity and modern fuels                                                                   18
Table 8 Maximum retail prices for fuels April 2013                                                                    19
Table 9 Access to grid electricity                                                                                    20
Table 10 Number and capacity of various rural generation technologies                                                 21
Table 11 Current FEA tariff valid since January 2013                                                                  22
Table 12 Major planned FEA renewable energy projects                                                                  23
Table 13 Estimated Energy intensity in Fiji                                                                           26
Table 14 Summary of current situation and barriers to SE4ALL goals                                                    30
Table 15 SE4ALL Targets                                                                                               32
Table 16 Average annual investments required to achieve SE4ALL targets in the electricity
sector from 2014 - 2020                                                                                               33
Table 17 Assumed Specific Investment Cost                                                                             34
Table 18 Targets - Grid Based Power                                                                                   35
Table 19 Targets - Rural Power Access                                                                                 35
Table 20 Targets - Modern Fuel Access                                                                                 36
Table 21 Targets Fuel Efficient Vehicles                                                                              36
Table 22 Targets - Biofuels                                                                                           36
Table 23 Government budget for energy (000 FJD)                                                                       43
Table 24 Solar electrification programme                                                                              44
Table 25 Biofuel programme                                                                                            45
Table 26 Regulatory reform programme                                                                                  48
Table 27 Summary of key gaps, barriers and additional requirements                                                    51
Table 28 Hydro potential in the main islands                                                                          55
Table 29 Geothermal potential in the main islands                                                                     56
Table 30 Supply and Demand Model SE4ALL Targets                                                                       58

Figures
Figure   1 Retained fuel imports and current account                                                                  10
Figure   2 Energy demand by sector (2012)                                                                             11
Figure   3 Macroeconomic linkages of energy imports                                                                   13
Figure   4 Headline inflation and energy inflation (percentage)                                                       13
Figure   5 Investments as percentage of GDP                                                                           14
Figure   6 Access to modern energy and electrification rates PIC                                                      17
Figure   7 Main fuel used for cooking in households 2007                                                              18
Figure   8 FEA grid coverage                                                                                          20
Figure   9 Recent, Current and Estimated Generation mix FEA (GWh)                                                     23
Figure   10 Energy intensity in Pacific Island Countries (percentage)                                                 26
Figure   11 Specific fuel consumption Pacific Utilities (kWh/l), 2010                                                 27
Figure   12 Transmission and distribution losses Pacific Utilities (percentage), 2010                                 27
Figure   13 Setting Energy Policy Targets                                                                             31
Figure   14 Electricity Demand Supply Balance                                                                         34
Figure   15 Proposed Institutional Arrangements                                                                       38
Figure   16 Physical extension of FEA Grid in Viti Levu                                                               54
Figure 17 Renewable energy potential in Fiji                                                                          57

                                                         Sustainable Energy for All (SE4All): Rapid Assessment and Gap Analysis iii
Abbreviations and Acronyms
ACP        Africa Caribbean Pacific Organization                      IPP      Independent Power Producer (private single
ADB        Asian Development Bank                                              purpose investor)
APEC       Asia Pacific Economic Cooperation                          MoF      Fiji Ministry of Finance
CCCPIR     Coping with Climate Change in the Pacific                  NEP      National Energy Policy
           Island Region programme jointly implemented                NEF      National Energy Forum
           by the SPC and GIZ                                         OECD     Organisation for Economic Co-operation and
CNO        Coconut Oil                                                         Development
CROP       Council of Regional Organizations in the                   PIC      Pacific Island Country
           Pacific                                                    PPA      Pacific Power Association / Power Purchase
DAC        Development Assistance Committee                                    Agreement
DFI        Development Finance Institution                            PPI      Private Participation in Infrastructure
DoE        Fiji Department of Energy                                  PPP      Public Private Partnership
EC         European Commission                                        PCCPP    Peoples Charter for Change, Peace and
EEZs       Exclusive Economic Zones                                            Progress
EE         Energy Efficiency                                          PSD      Private Sector Development
EIB        European Investment Bank                                   RBF      Reserve Bank of Fiji
EU         European Union                                             RESCO    Renewable Energy Service Company
EDF        European Development Fund                                  RDSSED Roadmap for Democracy and Sustainable
                                                                             Socio - Economic Development
FAO        Food and Agriculture Organisation of the
           United Nations                                             SAIDI    System Average Outage Duration
FBoS       Fiji Bureau of Statistics                                  SAIFI    System Average Interruption Frequency Index
FCC        Fiji Commerce Commission                                   SE4ALL Sustainable Energy for ALL (UN Initiative)
FDI        Foreign Direct Investment                                  SPC      Secretariat of the Pacific Community
FEA        Fiji Electricity Authority                                 SPREP    Secretariat of the Regional Environment
                                                                               Programme
FJD        Fiji Dollar
                                                                      UNDP     United Nations Development Programme
FSC        Fiji Sugar Corporation
                                                                      UNEP     United Nations Environment Programme
FREPP      Fiji Renewable Energy Power Project (GEF)
                                                                      USP      University of the South Pacific
GDP        Gross Domestic Product
                                                                      TA       Technical Assistance
GEF        Global Environmental Facility
                                                                      WB       World Bank
GIZ        German Agency for International Cooperation
GIS        Geographical Information System                            WTO      World Trade Organisation
GoF        Government of Fiji

iv Sustainable Energy for All (SE4All): Rapid Assessment and Gap Analysis
Minister’s Foreword
                                             The Sustainable Energy for All (SE4All): Rapid Assessment and Gap Analysis
                                             report lays out Fiji’s targets and requirements for achieving sustainable energy
                                             for all Fijians. It presents a comprehensive analysis of the overall energy
                                             situation in Fiji and subsequently identified the key gaps and support needed
                                             for achieving the three intertwined objectives of SE4All:

                                                     i.   ensure universal access to modern energy services

                                                  ii.     double the global rate of improvements in energy efficiency

                                                 iii.     double the share of renewable energy in the global energy mix.

                                             The Government’s aim to provide all Fijians with access to modern energy
                                             services which are also affordable, clean and reliable is well supported by
                                             the SE4All initiative which provides further impetus to the ‘Green Growth’
                                             development model pursued by the nation. Therefore, this SE4All report is
                                             reflective of Fiji’s efforts towards realizing the United Nation’s vision of
                                             ‘Sustainable Energy for All’.

                                              Targets for the Fiji SE4All initiatives with commitments in the short-medium
term (2020) as well as in the long term up to 2030 are closely aligned with the National Energy Policy (NEP) and in common
with the SE4All initiative, Energy Efficiency and Renewable Energy are also amongst the key strategic areas identified in the
NEP. Therefore, implementation of the NEP and the related Strategic Action Plan will compliment works towards achieving
the objectives of the SE4All. The Department of Energy will be the lead implementing agency for NEP and SE4All initiatives.

Furthermore, in view of our high dependency on imported mineral fuels coupled with the escalating fuel prices, the global
SE4All initiative offers the challenge as well as the opportunity to collaborate at the global front and also seek support
and cooperation for greater utilisation of indigenous renewable energy resources. Thus, with the completion of the SE4All
analysis for Fiji, the nation stands prepared to continue working closely with the United Nations for the betterment of the
lives of all Fijians.

Finally, the outstanding feature in the consolidation of this important document has been the active involvement of all
stakeholders through an open, transparent and inclusive consultative process. On the same note, I extend my sincerest
appreciation to all stakeholders for their valuable inputs and I laud the tremendous contributions of the National Advisory
Committee. My thanks are also due to our development partners and funding organisations the Deutsche Gesellschaft für
Internationale Zusammenarbeit (German Technical Cooperation - GIZ), the German Government and the United Nations
Development Programme (UNDP) for their support.

I entrust the SE4All initiative will enhance our efforts towards securing a resource efficient, cost effective and sustainable
energy future for Fiji.

Timoci Lesikivatukoula Natuva
Minister for Works, Transport and Public Utilities

                                                          Sustainable Energy for All (SE4All): Rapid Assessment and Gap Analysis v
Map of Fiji vi Sustainable Energy for All (SE4All): Rapid Assessment and Gap Analysis
Executive Summary
The Sustainable Energy for All (SE4ALL) is a global initiative aimed to mobilise actions from all sectors of society to achieve
the three objectives below by 2030:
Ensure universal access to modern energy services
Double the global rate of improvements in energy efficiency
Double the share of renewable energy in the global energy mix.
Fiji has seen significant progress over the last ten years, especially in the area of access to modern energy and in increasing
the share of renewable energy sources in electricity generation. New bio-fuel, wind, solar and hydropower plants have been
installed, rural electrification has advanced, energy efficiency promotion has been conducted by the Department of Energy
and some incentives to replace inefficient vehicles and appliances are in place, amongst other activities in the energy sector.
As a small island nation in the Pacific, one of the main issues in Fiji’s energy sector is the high reliance on imported fuels.
The impact of the energy sector on Fiji’s macro-economy through high and volatile fuel prices and high import payments is
significant. The need to reduce reliance on imported fuels and thus safeguard foreign reserves is considered key in ensuring
macro-economic stability for Fiji. This provides a natural drive for Fiji to find alternative fuels in the form of renewable and
indigenous fuels.
Current situation
Universal access
Fiji is making progress in providing access to modern energy services. Of the rural population, approximately 82% has
access to electricity (2007), which reflects a marked improvement – rural electrification was approximately 69% in 2003 –
but it is still significantly less than the 96% of the urban population with access to electricity (as at 2007).
Access to modern cooking fuels is almost universal for all urban and peri-urban areas while in rural areas the use of biomass
is still common. The situation in rural areas is perhaps due to issues of affordability of modern fuels and supply chain gaps.
However, there are significant data gaps on rural energy consumption, which constrain long term planning. Under the new
draft 2014 National Energy Policy (NEP), provisions have been made to address these data constraints. Once sufficient data
has been collected and analysed, it will be possible to effectively devise measures aimed at improving the situation of those
rural dwellers that still use biomass fuels.
Energy efficiency
In the 2006 NEP the Government committed itself to facilitating greater energy efficiency in the industrial and other sectors.
The Department of Energy (DoE) has established a Demand Side Management (DSM) unit which is responsible, among
others, for the implementation of the Energy Conservation and Efficiency Programme. At present the DSM unit is staffed
by six officers. Fiji is also the only Pacific Island Country (PIC) to date to have introduced mandatory minimum energy
performance standards and appliance labelling for freezers and refrigerators with the DoE planning to expand this system to
cover other appliances in the next few years.
Apart from DoE, the Fiji Electricity Authority (FEA) also maintains a DSM unit. FEA is committed to assist its customers to
become more energy efficient, and use energy responsibly. FEA’s DSM unit is responsible for providing technical assistance
and also for spreading awareness of energy efficiency.
The draft 2014 NEP includes a quantifiable energy efficiency target for both fuel and electricity.
Renewable energy
The FEA has been performing relatively well in comparison with other PIC utilities in the region. However, it has been
unable to achieve its own renewable energy target of reaching 90% renewable energy electricity by 2012 (FEA, 2010).
Nevertheless, the electricity sector still has the potential to transform Fiji’s energy sector. By utilising the considerable local
Sustainable Energy for All (SE4All): Rapid Assessment and Gap Analysis 1renewable energy resources particularly geothermal energy and an almost untapped solar potential, the power sector could
replace its own fossil fuel use worth approximately 100 million FJD per annum. Fiji’s NEP 2006 had set a goal to achieve
50% renewable energy in all sectors by 2015. Currently, the main contributor to renewable energy is power generation, with
60% of grid electricity generated using renewable energy sources (FEA, 2011). It is clear that renewable energy needs to be
promoted as a replacement of fuels in other sectors as well, in particular the land and maritime transport sectors.
In the transport sector, the 2006 NEPstated that 30% of transport fuel should be from alternative sources such as LPG
and bio-fuels by 2010. This has not been achieved, as in 2012, only 2% of land transport used alternative sources. There
are opportunities for replacing fossil fuels used in land transport through the use of bio-fuels, hybrid and electric vehicles.
However, in the case of the latter, this assumes that the increase in electricity generation needed to support land transport
could be met through renewable energy generation. In addition, according to research conducted at the University of the
South Pacific (USP), there is a considerable potential to reduce fossil fuel consumption in maritime transport. Options
include the use of renewable energies (bio-fuel, solar and wind) and improved efficiency of vessels and engines.
Main challenges and gaps
One of the main challenges in the power sector is institutional in nature: there is no effective Independent Power Producer
(IPP) framework in place that would attract the urgently needed private capital into renewable energy based power generation.
FEA has operated since 1966 as a State-owned Enterprise (SOE) without effective regulatory oversight. Hence, FEA has
determined the conditions for potential private sector participants. For example, power purchase tariffs offered by FEA to
date have not been sufficient to attract private investors or IPPs and power generation project selection criteria are not clear.
FEA currently offers an IPP tariff that is 11.5% under the minimum IPP tariff of 25.65 FJD cents/kWh set by Fiji’s price
regulator the Fiji Commerce Commission (FCC)1.
Whilst planning for restructuring of FEA is under way, another constraint in attracting private sector investment into energy
projects is the challenging business environment in Fiji (WB, 2012). Although the commercial banking sector has an
unprecedented liquidity, access to capital for energy sector investment is difficult. For private sector investment to take
off, these and other gaps needed to be closed. The World Bank (WB) supported Sustainable Energy Finance Project (SEFP)
implemented by DoE addresses small-scale financing, but does not have the resources to support financing of larger IPP
projects.
An enabling framework for private sector participation would also have to address the barriers that currently exist with
regards to small-scale decentralised grid-connected renewable energy based generation. At present there are no feed-in
tariffs, net metering provisions or incentive programmes that would promote such generation by households and Small and
Medium Enterprises (SMEs). DoE has launched a new project with support from GEF and UNDP: The Fiji Renewable Energy
Power Project (FREPP) which aims to address some of the constraints in these areas.
Therefore, gaps in existing policies relating to expanding the grid and renewable generation supplying the grid include,
amongst others, a need for:
a Power Development Plan (PDP) that is updated on an annual or biannual basis, building on the present
PDP developed by FEA;
a regular review of the costs and resource availability for different generation technology options (this could
be a component of the PDP;
a grid asset management plan detailing the operation and maintenance programme and costs for managing
the grid and associated generation. This will facilitate that on one hand the grid is not being run down and on
the other there is no “gold plating”. Additionally, this plan (that defines the operations and maintenance costs
for the existing grid and generation) will also assist in setting the electricity tariff basis;
a transparent IPP framework for the competitive procurement of large-scale generation;
a clearly defined framework for connecting small scale Renewable Energy (RE) technologies to the grid. This
would encourage rooftop solar and other forms of small-scale renewable generation; and
the transfer of technical regulatory functions to an existing Government entity or the establishment of an
independent regulator.
1 The IPP tariff was set by the Fiji Commerce Commission determination of 2012.
2 Sustainable Energy for All (SE4All): Rapid Assessment and Gap AnalysisIn terms of the energy sector in general, numerous recent energy sector studies in Fiji and the wider Pacific region
have identified the poor quality of national and regional energy sector data as a constraint on the effective analyses of
issues. Reliable time series data is lacking and critical information is often not disclosed by key public and private sector
stakeholders. This limits opportunities for policy, planning, rational decision-making and future performance improvement.
In particular, there is a considerable data gap with regard to the use of firewood or other biomass as a traditional fuel source
and in the electricity sector there is limited reliable, consistent, up-to-date information on resources, fuel use, and technical
and economic performance of the power utility.
Targets
Fiji’s targets for the energy sector as laid out in the draft 2014 NEP, given below, are aligned with the Sustainable Energy
for All (SE4ALL) initiative of the United Nations2.
Indicator Baseline Targets
2015 2020 2030
Access to modern energy services
Percentage of population with electricity
access 89%3 (2007) 90% 100% 100%
Percentage of population with primary
reliance on wood fuels for cooking 20%4 (2004) 18% 12%on capital). These mechanisms should not disadvantage either FEA or investors and the implementation of such
mechanisms should not add unduly to the overall cost of electricity supply in Fiji. This will be accompanied by net
metering arrangements that give electricity consumers incentives to invest in on-site small-scale renewable energy
generation.
Strengthen transparency and effectiveness of the regulation of the electricity industry. This includes establishing
a formal regulatory contract with Fiji Electricity Authority (FEA) that sets out a process for regularly reviewing the
efficient costs of electricity supply and setting tariffs to recover these, and making all forms of electricity subsidy
transparent including to energy consumers. It also includes ensuring the technical and economic regulatory functions
(including licensing and defining frameworks for encouraging Independent Power Producers) are carried out by the DoE
and the Fiji Commerce Commission.
Rural electrification:
Develop a national electrification master plan, showing how each un-electrified area of Fiji will be served with least
cost solutions. Technological solutions to be considered in consultation with communities will include grid extension,
diesel and hybrid mini-grids, and solar home systems. The plan will also clearly define a minimum level of service
which qualifies as ‘electrification’.
Establish a dedicated electrification fund and an associated framework that will be used to provide capital subsidies for
electrification projects. The electrification fund will facilitate the implementation of the national electrification master
plan. The fund framework should consider how to facilitate equitable electricity access taking into account gender
aspects and vulnerable groups. Going forward, funding being provided by the Government for the implementation of
rural electrification projects will be channelled into this fund, thereby making subsidies more transparent and easier
to monitor and evaluate. Subsidies will leverage capital contributions from beneficiaries and project promoters as
far as possible and will be provided as once-off capital contributions for viable projects. Recurrent costs will not be
subsidised.
Renewable energy:
Maintain a comprehensive assessment of Fiji’s renewable energy resources, including hydro, wind, biomass, solar, and
geothermal resources. This assessment will include an inventory of available sites and technologies, their technical and
economic viability, and social and environmental impacts.
Make all data on renewable energy resources available to the public and prospective investors through a single national
repository at the Department of Energy. This will ensure that a lack of information on resource potential does not
continue to be an impediment to private sector and other relevant project developers.
Conduct further investigations into geothermal energy resources with a view to identifying a pilot project for development.
This recognises the contribution that geothermal energy can make to diversifying the energy mix, providing base load
generation and thereby reducing the reliance on hydropower and petroleum imports.
Transport:
Promote the fuel efficiency of imported motor vehicles in order to reduce petroleum consumption. This includes
continuing to enforce age limits for second hand vehicles and provide import tax incentives. It may also include
introducing new measures such as labelling for vehicle fuel economy of imported land transport vehicles.
Investigate the potential and cost-effectiveness of energy efficiency and renewable energy solutions for sea vessels,
including biofuels, solar and sail-assisted sea transport and efficient motors, vessel design, and improved maintenance
models to improve the overall efficiency and reduce fuel consumption in sea transport within Fiji.
Support the development and implementation of the Department of Transport’s land and marine transport policies that
encourage a shift towards more energy efficient forms of land and sea transport.
Petroleum and bio-fuels:
Reduce the cost of imported petroleum products by negotiating directly with fuel suppliers and reviewing the pricing
templates for petroleum products. Also continue to explore the costs, potential benefits and risks of bulk procurement
of petroleum, building on existing studies and initiatives in this regard. This may include regional cooperation or the
creation of a single (bulk) buyer to improve bargaining power.
4 Sustainable Energy for All (SE4All): Rapid Assessment and Gap Analysis Improve the transparency of petroleum supply, including collecting data on fuel quantity imports, re-exports,
consumption, and pricing and making this data publicly available.
Continue research to explore the potential for increased production and use of bio-fuels. This includes encouraging
the production of coconut oil in remote islands and the use of locally produced molasses for ethanol production. Any
actions for the widespread development of bio-fuels in Fiji should be based on rigorous analysis showing that it is
both technically and economically feasible and should be mindful of the risks, in particular the trade-offs between
production of crops suitable for conversion to bio-fuels and production of food and cash crops.
Energy efficiency:
Continue to increase public education and awareness of energy efficiency by providing targeted information to end-
users on the range of energy saving technologies and options available. This should include encouraging businesses to
undertake energy audits and to factor in the operating costs of energy use as well as the capital costs when investing.
Public awareness campaigns should be informed by analysis of energy consumption patterns and market research of
appliance purchases. Education and awareness campaigns should target specific groups.
Extend the current system of energy labelling and minimum energy performance standards to all widely imported
electrical appliances and industrial equipment that contribute substantially to energy demand. A system will be put in
place to prevent and protect consumers from the use of false energy rating labels.
Develop and implement an energy information database, so that demand side data is collected and analysed and
a verifiable data trail is created upon which energy savings can be verified. Where possible this data should be
disaggregated by rural and urban users, sex and socio-economic groups. This database will be integrated with other
supply-side energy information databases where possible.
Sustainable Energy for All (SE4All): Rapid Assessment and Gap Analysis 51 Introduction
1.1 Country Overview
1.1.1 Physical Characteristics10
Fiji lies between 177° E and 178° W Longitude and 12° to 22° S Latitude with a land area of 18,333 km2. This includes
320 islands of which about a third are inhabited. The majority of the land is on continental-like volcanic islands that rise to
well over 1,000 metres in elevation. Over 87% of the land is concentrated in the islands of Viti Levu and Vanua Levu. Fiji’s
climate is tropical, averaging 26°C with annual rainfall ranging from 1800 to 2600 mm. It is considerably richer in natural
resources than its Polynesian and Micronesian neighbours with extensive timber, rich soils, mineral deposits and fish. The
country is subject to earthquakes, landslides, cyclones, flooding, and storm surges.
1.1.2 Population
The latest census was undertaken in 2007. The Fiji population by geographic sector is presented in the Table 111.
Table 1 Fiji population by geographic sector
Geographic Sector Population Size
Urban 424,846
Rural 412,425
Total Fiji 837,271
Source: Fiji Island Bureau of Statistics, 2008
The population increased during the 1996-2007 intercensal period by 62,194 persons. This increase amounts to an average
intercensal rate of growth of 0.7% per year, compared to 0.8 % per year during the previous 1986-1996 intercensal period.
In other words, during the last two decades, the national population growth rate has remained almost the same. During the
1996-2007 intercensal period, urbanization continued: in 2007 the urban population was larger than the rural population.
The urban population is now about 51% of the total population. Given continuation of the present growth rates for the
different ethnic groups, it is estimated that the population of Fiji will reach the one million mark in 2030and that by 2030,
61% of the population will be urban.
1.1.3 The Economy
The World Bank classifies Fiji as a lower middle-income economy.12 Table 2 below shows gross domestic products (GDP) per
capita in US$ for the period 2008-2011. As can be seen per capita GDP in 2011 was US$ 4,397. Fiji’s growth has been
extremely volatile as a result of a series of external and internal shocks. These include a series of natural disasters (cyclones
in 1985, 1992, 1993, 2009, and 2010); two global oil shocks (in 1979 and in 1981–1982); effects of coups (1987,
2000, and 2006); the Asian financial crisis (1997); spikes in food and fuel prices (2008); the global economic crisis (2009
and 2010); and, more recently, severe flooding in the Western and Northern Divisions of the country (January 2012 and late
March 2012) followed by Tropical Cyclone Evan in December 2012 (ADB, 2012).
10 Pacific Regional Energy Assessment 2004 – Fiji National Report, SPREP, pp. vii, 2005.
11 Census 2007 Results: Population Size, Growth, Structure and Distribution, Fiji Islands Bureau of Statistics, Statistical News No 45, pp. 1-2 & p. 4, 2008.
12 http://data.worldbank.org/country/fiji
6 Sustainable Energy for All (SE4All): Rapid Assessment and Gap AnalysisTable 2 GDP per capita 2008 – 2011
Year GDP Per Capita (US$)
2008 4,255
2009 3,377
2010 3,687
2011 4,397
Source: World Development Indicators, World Bank
Fiji is one of the most developed of the PIC economies, though still with a large subsistence sector.13 Services are by
far the major contributor to GDP.14 Fiji’s economy is relatively well diversified and has experienced significant structural
changes in recent years. The services sector currently accounts for more than half of GDP, with the balance provided by
primary production (13%), manufacturing and mining (14%), and utilities (4%). Structural change is occurring, both within
and between sectors, as urban-based services and manufacturing activity become relatively more important, and as the
agriculture and forestry sectors declines (ADB 2012).
The services sector has steadily grown and has increased between 1970 and 2009 from 32% of GDP to 69%. Rapid growth
in the services sector has been the result of a steady expansion in tourism-related services, finance, communications,
wholesale and retail trade, and public services. The share of the agriculture, forestry, and fisheries sector in GDP has
declined steadily over the past decade. Within the agriculture sector, large shifts have occurred—the share of sugar to
agricultural GDP began to fall after 1999 while non-sugar output has climbed. In 2011, real GDP increased by 2.7%, but
this reflects primarily a bounce-back in agricultural output from the natural disasters in 2009 and 2010. Real GDP growth
was 1.7% in 2012 and is forecast at 3.6% for 201315.
Almost all Fiji’s raw materials (including fuels), intermediate and capital inputs are imported.16 International trade and
investment are vital to Fiji given its small domestic market and limited natural resources. According to ADB near-term growth
is expected to be driven by tourism and public infrastructure investments and longer-term economic prospects are likely to
be influenced by political as well as economic developments.17 Fiji’s economy is forecast to grow by 3.6% in 201318, driven
mainly by tourism and higher public capital expenditure. Higher consumption, combined with public infrastructure work,
election-related expenditure, and continued expansion in tourism in line with an improving global economy, underpin a GDP
projection of 3.0% in 201419. Barriers to higher growth include limited fiscal flexibility under current debt levels and a
challenging business environment, as well as a longstanding need for structural reform in some sectors, particularly in the
sugar sector.20
The latest ADB economic report21 concludes that Fiji’s private sector operates below its potential due to constraints in factor
markets22, the extensive role played by state-owned enterprises, poor quality infrastructure, overregulation, and gaps in the
commercial legal framework. This situation is exemplified by the poor participation of the private sector in power generation.
The lack of a clear regulatory framework for independent power producers (IPP)23 has prevented potential private sector
investors from bringing their IPP projects to closure. Since 2006 foreign direct investment (FDI) projects implemented have
declined significantly. Using foreign investment as a proxy for the quality of the private sector investment regime, the recent
trend in FDI thus reflects weaknesses in the investment climate.
In contrast to other PICs, external aid plays a relatively modest role in Fiji. Between 2008 and 2010, Fiji received an
amount equivalent to 2% of GDP, from the Development Assistance Committee (DAC) of the Organisation for Economic
Co-operation and Development (OECD) countries. In 2008, for example, Fiji received a total of $40 million in net official
development assistance, of which $28.6 million was in the form of bilateral grants and $11.8 million was multilateral
assistance. The main traditional bilateral donors are Australia, Japan, and New Zealand, with France and the United States
(US) also providing aid in some years. Multilateral aid flows are, among others, from ADB, the European Union (EU), the
United Nations (UN), and the World Bank (WB). Non-traditional donors have been providing significant external credits since
13 Republic of Fiji – Poverty Trends, Profiles and Small Area Estimation (Poverty Maps) in Republic of Fiji (2003-2009), World Bank, p. 2, September 2011.
14 Fiji Trade Policy Review - Report by the Secretariat, World Trade Organization (WTO) Secretariat, p. vii, 18 February 2009.
15 Republic of Fiji - Economic and Fiscal Update: Supplement to the 2014 Budget Address, Ministry of Finance, 8th November 2013.
16 Fiji Trade Policy Review - Report by the Secretariat, World Trade Organization (WTO) Secretariat, p. viii, 18 February 2009.
17 Asian Development Outlook 2013 – Asia’s Energy Challenge, ADB, pp. 260-261, 2013.
18 Republic of Fiji - Economic and Fiscal Update: Supplement to the 2014 Budget Address, Ministry of Finance, 8th November 2013.
19 Ibid
20 Asian Development Outlook 2013 – Asia’s Energy Challenge, ADB, p. 262, 2013.
21 Fiji 2012: Revitalising the Fiji economy, Asian Development Bank.
22 A factor market is a market used to exchange the services of a factor of production: labour, capital, land and entrepreneurship. Factor markets, also termed resource markets,
exchange the services of factors, not the factors themselves which are exchanged through product markets. Capital and land are two resources than can be and are legally
exchanged through product markets. The services of these resources, however, are exchanged through factor markets (see also Economic Glossary http://glossary.econguru.com/).
23 The World Bank Definition for IPP is used here: A long-term contract between a private party and a government agency, for providing a public asset or service, in which the
private party bears significant risk and management responsibility (Reference Guide PPP, World Bank, 2012 p11).
Sustainable Energy for All (SE4All): Rapid Assessment and Gap Analysis 72008. The ratio of aid to GDP ranged from 2.4% of GDP to almost 5% of GDP in the 1990s, but it has fallen to about 2%
of GDP in 2008−2010. In 2006, the EU suspended new aid programmes while the WB and ADB halted new lending. New
sources of foreign borrowing have been tapped to offset the decline in financing from Fiji’s traditional donors, with official
loans for infrastructure development provided by a number of new development partners, including the People’s Republic
of China and Malaysia.
1.1.4 Poverty
According to the Fiji Bureau of Statistics poverty report from 2012 in 2008/09 31% of the Fijian population lived in poverty.
While this number is high, the overall national incidence of poverty declined from 35% in 2002/03. While there has been
considerable improvement in urban areas over the six years (a decline in poverty from 28% to 19%), rural areas showed
increased poverty from 40% to 43% largely attributed to the declining agricultural activities, particularly the sugar industry,
and under-developed infrastructure and utilities. 24
These aggregated national poverty levels disguise a large sub-national variation in poverty. In Fiji the Northern division
comes out as poorest (47%), followed by the Eastern Division (35%). In contrast, the Central division (21%) is the least
poor division. Among urban areas, the best performers are the Eastern (30%), Central (16%) and Western (17%) divisions.
Among rural areas the highest incidence of poverty was recorded in the Northern division (50%), followed by Western
(43%), Eastern (39%) and Central division (35%). Poverty in Fiji is driven by multiple factors. Poverty varies considerably by
household and individual characteristics. Of these characteristics, old age, number of children, education and employment
of household-heads have particularly strong links to poverty. 25
Development indicators are also generally the highest for the capital city of Suva and surrounding provinces, as well as
the more remote outer islands that have benefited from relatively high levels of financial support over an extended period.
Indicators in general are lower on Vanua Levu (the Northern Division) compared to the main island of Viti Levu, and are also
usually lower in inland areas compared with coastal areas (ADB, 2012).
1.1.5 Human Development including Progress on the MDG
Fiji is classified by UNDP as a medium human development country26 with a life expectancy at birth at 69.4 years and mean
years of schooling of adults being 10.7 years. Although the country has strong social indicators, Fiji’s human development
ranking dropped from 66th place in 1998 (out of 174 countries) to 100th (out of 187 countries) in 2011 and moved to
rank 96 in 2012. Fiji recorded the highest value and ranking in Human Development Index (HDI) among the Pacific island
countries in the 1990s, but fell behind Tonga and Samoa in the HDI rankings by 2005.
Since the signing of the Millennium Declaration in 2000, Fiji has made
”…great achievements towards reaching the MDG targets, particularly in achieving universal basic education,
reducing child and maternal mortality, ensuring environmental sustainability, reducing external debt, and making
available the benefits of new technology especially in the telecommunications industry”.27
However according to the second MDG national progress report from 2010, Fiji is unlikely to achieve MDG 1: Eliminate
Extreme Poverty and Hunger, MDG 3: Promote Gender Equality and Empower Women; and MDG 6: Combat HIV/AIDS and
Other Diseases.
24 Fiji Bureau of Statistics, Poverty in Fiji, 2012
25 Asian Development Bank - Fiji 2012: Revitalising the Fiji economy, Mandaluyong City, Philippines (ADB 2012) & Ministry of Strategic Planning, National Development and
Statistics, 2013
26 Human Development Report 2013 - The Rise of the South: Human Progress in a Diverse World, UNDP, 2013.
27 Millennium Development Goals - 2nd Report (1990-2009) for the Fiji Islands, Ministry of National Planning, Government of Fiji, p. ii, September 2010.
8 Sustainable Energy for All (SE4All): Rapid Assessment and Gap Analysis1.2 Energy Situation
1.2.1 Energy Policy
In the Roadmap for Democracy and Sustainable Socio - Economic Development (RDSSED) 2010 – 2014 which is aligned
to the Peoples Charter for Change, Peace and Progress (PCCPP), the government of Fiji sets out a framework to achieve
sustainable democracy, good and just governance, socio-economic development and national unity. The key foundation
of the Roadmap is the PCCPP, which was compiled through a nationwide consultation process, involving a wide range of
stakeholders. The objective of the Roadmap is to implement policies to achieve the Vision of “A Better Fiji for All”, which
is consistent with the Peoples Charter. To achieve this vision, the overarching objective is to rebuild Fiji into a non-racial,
culturally vibrant and united, well-governed, truly democratic nation that seeks progress and prosperity through merit-based
equality of opportunity and peace.
In the Roadmap, the Fiji Government sets the energy sector goal as “To facilitate the development of a resource-efficient,
cost effective and environmentally – sustainable energy sector”. In view of the developments since the formulation of Fiji’s
first energy policy in 2006 the Government of Fiji has recently undertaken a review of the national energy policy and the
accompanying strategic action plan. The present rapid assessment and gap analysis exercise to establish the baseline for
the three objectives of SE4ALL28 and to identify gaps and support needed has been undertaken as part of the energy policy
review process. An analysis of the existing legislative framework and recommendations for any possible legislative changes
to facilitate the future development of the energy sector for the benefit of the nation was also undertaken as part of this
review process.29
The energy policy review exercise was carried out with full consultation and participation of key actors (private sector, public
institutions, NGOs, financial institutions, development partners, civil society representatives) within relevant sectors. A
major National Energy Forum was held in Suva on April 3rd and 4th 2013, to kick-start the consultation process, which was
followed by one-on-one interviews with key stakeholders. The event attracted more than 100 participants representing all
key stakeholder groups and was characterized by open and productive discussions on gaps, opportunities and key actions
required to boost sustainable development of Fiji’s energy sector30. Additional consultations were held at a National Energy
Policy Workshop held on 21st August 2013 in Suva. At this workshop high-level SE4ALL targets were discussed together with
the policies suggested for the new NEP. Finally on the 16th October 2013, a Seminar was held where the final draft version
of the new draft NEP was presented.
1.2.2 Energy Supply
Primary energy sources
Energy in Fiji is supplied in three main forms: i) biomass/wood for cooking in rural areas and to a lesser extent for power
co-generation in the wood and sugar industries; ii) as imported fossil fuels and iii) as electricity, of which a significant share
is generated from hydropower with much smaller contributions from wind and solar energy.
There is little known about the quantities of traditional biomass fuels (wood and agricultural waste such as coconut husks
and shells) used in Fiji. The Pacific Island Renewable Energy Project (PIREP) report of 2004 estimated the total supply of
fuelwood to be 250,000 tonnes per annum. Approximately 500,000 tonnes of bagasse are currently burned in Fiji’s sugar
industry to generate steam and electricity. Tropic Woods, a woodchip manufacturer supplying the pulp and paper markets
also generates steam and electricity using their biomass wastes.
Total retained imports of the three major liquid fossil fuels amounted to 364 million litres in 2011 representing a value of
583 million FJD. In addition approximately 11,000 tonnes of LPG was imported in 2011. Fuel imports account for 30 %
of total import value. Fuel imports have a significant impact on the current account and trade deficits as shown in Figure
1. In addition, there is a significant risk of fuel supply interruptions.
28 The three of objectives of SE4ALL by 2030 are: 1) Ensuring universal access to modern energy services; 2) Doubling the global rate of improvement in energy efficiency; and, 3)
Doubling the share of renewable energy in the global energy mix.
29 See also www.fdoe.gov.fj/review
30 ECA/SMEG – Report on National Energy Forum, April 2013.
Sustainable Energy for All (SE4All): Rapid Assessment and Gap Analysis 9Figure 1 Retained fuel imports and current account
Source: Reserve Bank of Fiji 2012 (data is provisional)
The latest import statistics for the main liquid fuels as displayed in Table 3 below shows the dominance of diesel fuel
accounting for 76% of all imports.
The data shows no distinct pattern in terms of volumes with large changes from year to year (e.g. the huge drop in reported
aviation turbine fuel volumes from 121 million litres in 2010 to 17 million litres in 2011). This may reflect changing GDP
growth but it is more likely a reflection of the lack of reliable data on petroleum imports and consequently, inconsistent data
reporting from year to year. For example, visitor arrival figures suggest that the tourism sector expanded from 2010 to 2011,
which might be expected to lead to increased aviation fuel use.
These anomalies in the fuel data demonstrate one of the weaknesses in energy sector management: the unreliable and
inaccurate data for fuel supply and use. DoE has made concerted efforts to obtain fuel data from the three oil companies
operating in Fiji and has offered to sign a Memorandum of Understanding (MoU) which assures that the government would
acknowledge commercial confidentiality of the data. However, only the French multinational Total has signed the MoU, but
is yet to supply any data to DoE.
Table 3 Fossil fuel supply (retained imports)
Motor Spirit Aviation Turbine Diesel TOTAL
Quantity Value Quantity Value Quantity Value Quantity Value
(million (F$M) (million (F$M) (million (F$M) (million (F$M)
litres) litres) litres) litres)
Year
2008 43 71 103 307 248 390 394 768
2009 45 58 82 126 189 218 316 402
2010 78 100 121 133 318 366 517 599
2011 70 99 17 17 276 410 363 526
2012 69 101 19 14 264 402 352 517
Source: Fiji Bureau of Statistics / Reserve Bank of Fiji 2012. (Data is provisional)
Power sector
In the power sector, total installed capacity of FEA is 256 MW, comprising 83 MW in the Monasavu Hydro Scheme, 42 MW
in the Nadarivatu Hydro Scheme in Viti Levu and approximately another 10 MW in smaller schemes in Viti Levu and Vanua
Levu, 10 MW of wind turbines and about 111 MW of diesel capacity in 10 stations on the three main islands (FEA, 2011
& 2012). Of the total diesel capacity 88 MW is installed on the main island of Viti Levu where diesel is supplementing
the hydro schemes (FEA, 2011 & 2012). Total generation of FEA in 2012 was 970 GWh with more than 90% of this total
10 Sustainable Energy for All (SE4All): Rapid Assessment and Gap Analysissupplied on the main island of Viti Levu (FEA, 2012). Table 4 shows peak demand and total generation for the three islands
supplied by FEA.
Table 4 Electricity supply by FEA
Viti Levu Vanua Levu Ovalau TOTAL
Peak MW Energy Peak MW Energy Peak MW Energy Peak MW Energy
Year GWh GWh GWh GWh
2011 152.3 822.1 12.4 61.8 2.8 14.7 167.5 898.6
2012 162.5 873 16.1 79.8 3 15.9 181.6 968.7
Source: FEA Annual Reports 2011 & 2012
More than 500 small diesel powered village mini-grids31 also supply power in rural areas. These grids have been installed
under the government’s rural electrification programme and are operated by the communities they supply or by the Ministry
of Works. It is estimated that the current total installed capacity of these diesel mini-grid schemes is approximately 14 MW.
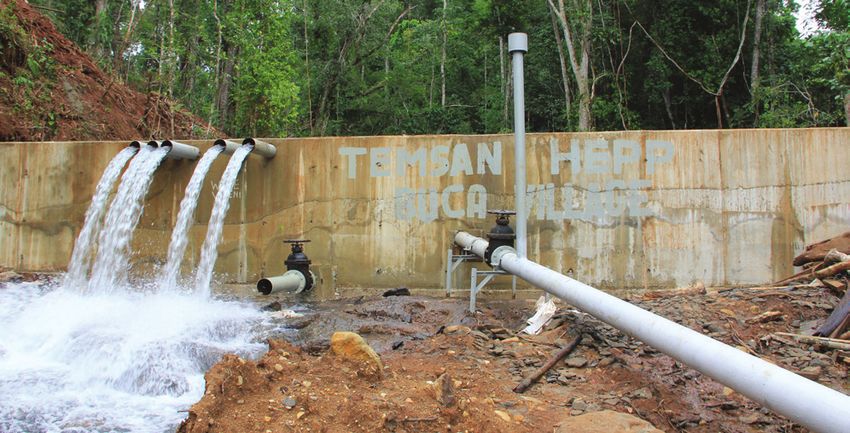
It is however not known how many of the schemes are operational at present. There are also two community mini-hydro
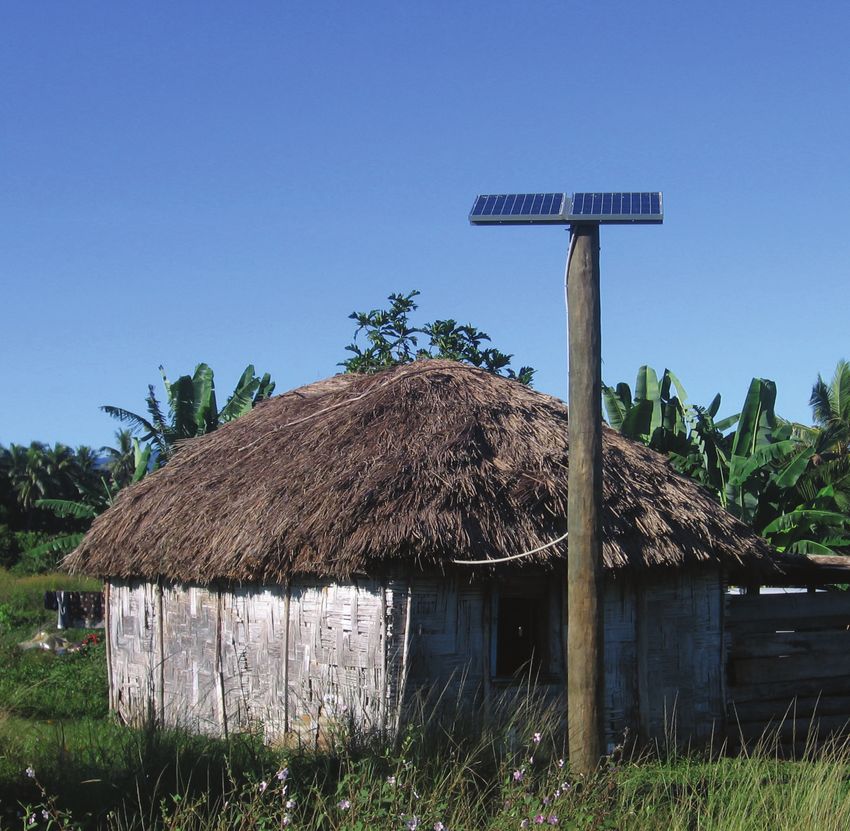
schemes of 30 and 100 kW. Total supply of PV solar home systems (SHS) to rural communities currently stands at 430
kWp and a total of 3,700 systems. These systems have been provided under DoE’s rural electrification programme and are
typically located in remote areas and outer islands.
Fiji has very good renewable energy endowments (solar, biomass, wind, geothermal and hydro) and considerable energy
efficiency potential. With significant decreases in the cost of some renewable energy technologies, renewable energy has
become a least-cost option in many cases for both increasing access to electricity for rural households and businesses and
grid-connected electricity generation. Energy efficiency improvement can also contribute to reducing energy import costs.
1.2.3 Energy Demand
Fiji’s energy demand is driven by household consumption of electricity and transport fuels and by the need of its major
industries, i.e. agriculture and forestry, fisheries, tourism and mining. Unfortunately, there is little data on the demand side
of the energy balance. Disaggregated data of demand for fuels are not reported by the oil industry and demand surveys
are not performed on a regular basis. A future priority for DoE is to increase its capacity in energy use data collection and
conduct energy demand surveys on a regular basis.
The Climate Change Unit of the Ministry for Foreign Affairs and International Cooperation provides a breakdown of energy
demand by sectors as shown in Figure 2 (Fiji Ministry of Foreign Affairs, 2012). The break down shows a dominance of the
transport sector, which consumes 42% of all modern energy in Fiji. The transport sector includes land, marine and aviation
and essentially uses motor spirit in cars, diesel in cars, trucks busses and marine vessels while the aviation sector uses
multi-purpose kerosene.
Figure 2 Energy demand by sector (2012)
Source: Fiji Bureau of Statistics and Fiji Department of Energy, 2004
31
DoE, 2013.
Sustainable Energy for All (SE4All): Rapid Assessment and Gap Analysis 11Fiji’s industrial energy consumption is dominated by the Vatukoula Gold Mine, which generates its own electricity using
diesel fuel. Energy demand in the mining sector has been stagnant in recent years. However, mining development could
potentially have a substantial impact on Fiji’s energy demand. Several new mining projects, including bauxite mining in
Nawailevu in Bua are at various stages of development. Investment to date in the Namosi copper mine project is around $80
million, and planned capital investment in this project is currently estimated at approximately $1 billion with production due
to commence in 2014, at the earliest. It is estimated that the Namosi copper mine would require approximately 100 MW
of power. Other smaller gold mining projects, in Mount Kasi, Wainivesi, and Tuvatu, were at various stages of preparation
in 2012.
The speed of mining development will be a major driver of energy demand in Fiji. However, the mining sector is associated
with many uncertainties. In addition to global market conditions, the viability of new mining projects will ultimately depend
on several factors that include security of tenure, political stability, access to affordable sources of energy, local attitudes
toward mining, and the licensing and taxation regime in place (ADB 2012).
The DoE has estimated industrial petroleum fuel use from 1993-2000 incorporating information extrapolated from the Census
of Building and Industry (1993-1994), which included detailed information on expenditures for fuel use disaggregated by
industry and type of fuel (Table 5). DoE converted money values into physical units of energy. Industrial census data are two
decades old, and the structure of the Fiji economy has since changed so this method is probably not an accurate indication
of business and industrial energy use today. However, there are no better data available. The large quantity of Industrial
Diesel Oil (IDO) reported under mining and manufacturing is attributed to the Vatukoula Gold mine, which not only operates
heavy machinery but also generates its own power using an installed capacity of 30 MW.
Table 5 Estimated consumption of petroleum in Fiji by industry (kilolitres) 2000
Industrial sector Petrol ADO IDO RFO Kerosene LPG
Mining & quarrying 287 151 10,508 11 0 0
Food manufacture 1535 1418 1395 1692 43 288
Clothing & footwear 1209 74 547 4 4 269
Wood products 165 248 182 643 240 4
Paper & printing 460 45 175 20 2 133
Chemical products 305 40 55 3 11 0
Building & construction 787 1651 85 883 1 33
Other industry 734 533 1,118 71 0 10
Total 5,482 4,160 14,065 3,327 300 737
Source: PIREP Report Fiji 2004
The projected overall electricity demand is increasing, as shown in Table 6, reflecting: a) population growth; and b) expansion
of electricity service coverage area through rural electrification. There also seems to be a trend to replace traditional biomass
fuels with modern cooking fuels such LPG.
Table 6 Electricity demand projection 2013 – 2020
Year Viti Levu Integrated System (VLIS) Vanua Levu System Ovalau System
Peak Demand Energy Demand Peak Demand Energy Demand Peak Demand Energy Demand
(MW) (GWh) (MW) (GWh) (MW) (GWh)
2013 172.2 921.8 19.6 97.1 3.1 16.1
2014 181.6 969.5 22.3 110.1 3.3 17.2
2015 189.6 1011.0 24.5 120.9 3.6 18.7
2016 195.5 1042.5 26.6 131.0 3.9 20.3
2017 201.3 1073.4 28.1 138.0 4.2 21.9
2018 207.2 1105.1 29.5 145.1 4.29 22.2
2019 213.3 1137.5 30.9 152.0 4.34 22.6
2020 219.5 1170.8 32.2 158.4 4.4 23.0
Source: FEA Power Development Plan for Fiji (2011 to 2020), 2010
12 Sustainable Energy for All (SE4All): Rapid Assessment and Gap Analysis1.2.4 Energy and Economic Development
Price and demand developments in the energy sector impact economic development in Fiji in a major way. The Reserve
Bank of Fiji (RBF) is concerned with the negative impact of rising fuel import cost and the macro-economic linkages that
are evident in Fiji. In Figure 3 these linkages are displayed.
Figure 3 Macroeconomic linkages of energy imports
As at 2012, Fiji used almost 8.8 % of
its total GDP of around 7 billion FJD
to import fuel for domestic use. While
RBF is concerned with the impact of
fuel imports on inflation as depicted in
Figure 4, the share of GDP that has to
be used in Fiji to import fuels is low
in comparison with some neighbouring
countries. The share of GDP to be used
for fuel imports is 27% in Cook Islands,
26% in Marshall Islands and 17% in
Samoa. PNG and Vanuatu are in a better
position using 6%of their GDP for fuel
imports. While some of the other PICs
Source: Reserve Bank of Fiji are even more exposed to energy market
volatility, the high share of fuel imports
and the associated vulnerability of Fiji’s economy is still a concern for the Fiji government and key stakeholders.
Figure 4 Headline inflation and energy inflation (percentage)
Source: Reserve Bank of Fiji, 2013
One of the key questions with regard to future economic development and its impact on energy supply and demand is
whether the government’s investment target of 25% of GDP can be achieved in the foreseeable future. The trend of total
investment in Fiji’s economy since 2003 is negative as shown in Figure 5. A decline in private investment explains most of
the reduction in Fiji’s total investment levels. On the other hand, public and state-owned enterprises investments including
power sector development have remained relatively stable at 10%–12% of GDP since 2000.
Sustainable Energy for All (SE4All): Rapid Assessment and Gap Analysis 13Figure 5 Investment as percentage of nominal GDP
Source: Fiji Bureau of Statistics and Reserve Bank of Fiji, 2013
As the above graph shows, the trend of declining investments has been reversed in 2012. This is partly due to investments
in new wide body aircraft by the national airline, Fiji Airways as well as the general pick-up in economic activity.
1.2.5 Energy Strategy and Relevant Targets
In November 2006, the Fiji Government endorsed its first National Energy Policy (NEP) and associated strategic action plan,
which has since guided the work of the Department of Energy (DoE). The stated objectives of this policy were to:
Strengthen the capacity for energy planning through appropriate policy, regulatory and implementation
frameworks and effective and efficient management;
Enhance energy security through greater participation and collaboration within the industry;
Increase access to affordable and reliable electricity services;
Research, promotion and utilisation of renewable energy applications.
Under each stated objective, a policy framework describes the strategic actions the Fiji Government intended to make in
order to develop and expand the country’s energy sector. The policy was accompanied by a detailed strategic action plan that
listed numerous activities all geared towards achieving the above objectives.
In March 2013, the government began a review of the policy framework and associated strategy, tapping into technical
assistance from GIZ and UNDP. The preparation of this report and the development of the new NEP have been coordinated in
order to ensure that targets, policies and strategic actions are aligned and consistent. Summaries of the key priority policies
in the draft 2014 NEP for each area of Fiji’s energy sector are provided below. The priority policies listed below have been
chosen on the basis that they can be readily implemented and have the most potential to achieve the objectives and targets
for the energy sector. For all other policies please refer to the draft 2014 NEP.
Grid-based power supply:
Increase private sector investment in large-scale electricity generation., by establishing a transparent process for
procurement of new large-scale capacity from Independent Power Producers (from both renewable and non-renewable
energy sources), pricing and other principles to be applied in all new Power Purchase Agreements, and grid-connection
standards.
Increase private sector investment in small-scale grid-connected renewable generation, by establishing economically
justified feed-in tariffs or similar mechanisms to give incentives and reduce the risks for electricity production from
small-scale renewable sources that are connected to the grid (including by providing investors an adequate return
14 Sustainable Energy for All (SE4All): Rapid Assessment and Gap AnalysisYou can also read