Solar Generation V 2008 - Solar electricity for over one billion people and two million jobs by 2020
←
→
Page content transcription
If your browser does not render page correctly, please read the page content below
> Com peti ti ve n e ss

                          Solar Generation V – 2008
                          Solar electricity for over one billion people
                          and two million jobs by 2020
Contents

Foreword  .     .    .         .         .         .         .         .              .              .              .              .              .              .              . p. 4

Executive Summary  .                          .         .         .          .              .              .              .              .              .              .        p. 7

PV Solar Electricity – frequently asked questions  .                                                                                                                   .        p. 11

Solar Basics  .      .         .         .         .         .         .              .              .              .              .              .              .              . p. 13

The Solar Power Market  .                                    .         .              .              .              .              .              .              .              . p. 21

The Solar Future  .                 .         .         .         .           .              .              .                 .           .              .              .       p. 29

Costs and Competitiveness  .                                                .              .              .              .              .              .              .         p. 39

Solar Benefits  .         .         .         .         .         .           .                 .              .              .           .                 .              .    p. 47

Policy Drivers  .         .         .         .         .         .              .              .              .              .              .              .              .    p. 57

In 2001, for the first time, EPIA and Greenpeace joined forces with a mission in telling a broad

    audience of the latest developments and future potentials of Photovoltaics. Thus, Solar Generation

    was born.

    7 years and 5 editions later, 7 GW of PV capacity more, tens of thousands of PV jobs created,

    hundreds of companies founded, many TWh of electricity produced and millions of tons of CO2

    saved; PV is facing a different world. Nobody, not even the optimistic PV industry thought back in

    2001 that only a few years later more than 2 GW, almost 10 times more than in 2001, would be

    installed in only one year.

    Last year’s Foreword to Solar Generation highlighted that a unique window of opportunity for PV was

    opened. Scientific reports (Stern Report, IPCC Report) and political activities (2020 Energy targets of

    the European Union) have driven a public awareness all over the world that the time has come,

    ultimately, for action in order to save the planet from the consequences of climate change.

4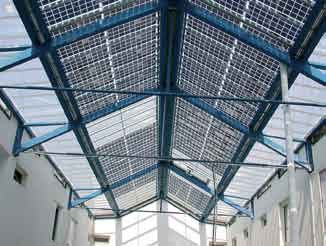
Foreword

In 2008, as also during the years before, EPIA and Greenpeace had to update their scenarios in order

to keep pace with the dynamic PV development. The global energy situation has changed even more

drastically in just one year. If last year a window of opportunity for PV was opened; this year the entire

front wall of the house has been torn down. The opportunity for action has not only become huge, it

has become an economic necessity!

Energy prices are skyrocketing. Energy is becoming more and more unaffordable for more and more

people all over the world. The global PV capacities have to grow faster and they can grow faster as

Solar Generation V will show. The global PV industry is willing to take the challenge.

EPIA                                             Greenpeace
Ernesto Macias                                   Sven Teske
President European Photovoltaic Industry         Renewables Director Greenpeace
Association (EPIA)                               International

                                                                                                             5
Executive Summary

                    7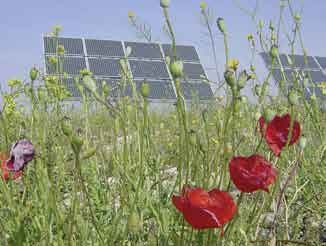
Executive Summary

                Global Status of Solar Photovoltaics                        sents merely a foretaste of the massive transformation
                                                                            and expansion expected to occur over the coming
                The solar electricity market is booming. By the end of      decades. The target: the realisation of a common
                2007, the cumulative installed capacity of solar            goal of substantially increasing the penetration of solar
                photovoltaic (PV) systems around the world had              electricity into the global energy mix, whilst also
                reached more than 9,200 MW. This compares with a            cutting greenhouse gas emissions.
                figure of 1,200 MW at the end of 2000. Installations
                of PV cells and modules around the world have been          Much work still needs to be done to turn potential into
                growing at an average annual rate of more than 35%          reality. One crucial step is to bring a far broader range
                since 1998.                                                 of actors into the sector, particularly in the investment,
                                                                            finance, marketing and retail areas. At the same time,
                Such has been the growth in the solar electricity           there is a need to transmit to as wide an audience as
                industry that it is now worth more than an annual           possible, the message that solar electricity will bring
                € 13 billion.                                               socio-economic, industrial and environmental benefits
                                                                            to regions which proactively encourage its uptake.
                Competition among the major manufacturers has
                become increasingly intense, with new players
                entering the market as the potential for PV opens up.       Solar Generation: A Projection to 2030
                The worldwide photovoltaics industry, particularly in
                Europe, the USA, China and Japan, is investing              Numerous qualitative analyses about the potential
                heavily in new production facilities and technologies.      market development of solar photovoltaics have been
                At the same time, political support for the develop-        published in the past. The aim here has been to
                ment of solar electricity has led to far-reaching           compile a detailed quantitative knowledge base,
                promotional frameworks being put in place in a              coupled with clearly defined and realistic assumptions
                number of countries, notably Germany, Spain, Italy,         from which extrapolations could be made on the likely
                France, South Korea, USA, etc.                              development of the solar electricity market up to 2030
                                                                            and beyond.
                Since the first edition of Solar Generation was
                published in 2001, the global PV market has                 Taking its lead from success stories like those in
                continued to expand at more than the rate then              Germany or Spain, this EPIA/Greenpeace report
                predicted (see table below). Although in some               looks forward to what solar power could achieve -
                countries progress has been slower than expected,           given the right market conditions and an anticipated
                others have exceeded expectations. The German               fall in costs – over the first three decades of the
                market in particular has consistently performed at the      twenty-first century. As well as projections for installed
                upper limit of its projected expansion rate. Other          capacity and energy output, it makes assessments of
                countries outside the OECD nations are also showing         the level of investment required, the number of jobs
                their determination to develop a solar-powered future.      which would be created, and the crucial effect which
                                                                            an increased input from solar electricity will have on
                This clear commercial and political commitment to the       greenhouse gas emissions.
                expansion of the PV industry means that the current
                surge of activity in the solar electricity sector repre-

                 Annual MW Installations Capacity:
                 Market versus ‘Solar Generation’ Scenario Predictions since 2001

                            Year      2001     2002      2003       2004     2005      2006      2007      2008       2009      2010
                    Market Result      334       439      594       1,052   1,320     1,467      2,392
                   SG I 2001 MW        331       408      518        659      838     1,060      1,340     1,700     2,150     2,810
                  SG II 2004 MW                                               985     1,283      1,675     2,190     2,877     3,634
                  SG III 2006 MW                                                      1,883      2,540     3,420     4,630     5,550
                 SG IV 2007 MW                                                                   2,179     3,129     4,339     5,650
                  SG V 2008 MW                                                                             4,175     5,160     6,950
8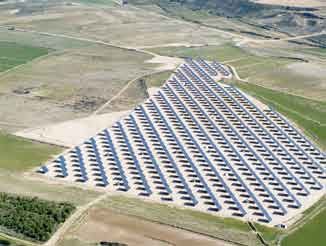
Executive Summary
This scenario for the year 2030, is based on the Solar Generation: Key Results of the EPIA/
following core inputs: Greenpeace Analysis
✜ PV market development over recent years, The key results of the EPIA/Greenpeace scenario
both globally and in specific regions clearly show that, even from a relatively low baseline,
✜ National and regional market support solar electricity has the potential to make a major
programmes contribution to both future global electricity supply and
the mitigation of climate change. The figures below
✜ National targets for PV installations and
are for the Advanced Scenario:
manufacturing capacity
✜ The potential for PV in terms of solar irradia-
Global Solar Electricity Output in 2030
tion, the availability of suitable roof space
8.9 % of global electricity demand from PV – demand
and the demand for electricity in areas not forecast from IEA Reference Scenario
connected to the grid 13.8 % of global electricity demand from PV – demand
forecast from the Greenpeace Energy [R]evolution Scenario
The following assumptions have been
employed: Detailed Projections for 2030
PV systems cumulative
1,864 GW
capacity
Global electricity consumption: Two different
assumptions are made for the expected growth in Electricity production 2,646 TWh
electricity demand. The reference version is based on Grid-connected consumers 1,280 million
the International Energy Agency’s latest World Energy
Outlook (WEO 2007). An alternative version is based Off-grid consumers 3,216 million
on the Greenpeace/European Renewable Energy
Employment potential 10 million jobs
Council Energy [R]evolution Report, which assumes
extensive energy efficiency measures. The PV Market value € 454 billion per annum
contribution is therefore higher under this projection. € 7-13 per kWh depending
Cost of solar electricity
on location
Carbon dioxide savings: Over the whole scenario Cumulative CO2 savings 8,953 million tonnes of CO2
period, it is estimated that an average of 0.6 kg of
CO2 would be saved per kilowatt hour of output from
a solar generator.
Solar Generation: PV’s Contribution to Global
There are two versions of the scenario: an Advanced Electricity Supply
Scenario based on the assumption that additional
support mechanisms will lead to dynamic worldwide The EPIA/Greenpeace Advanced Scenario shows
growth; a Moderate Scenario which assumes a that by the year 2030, PV systems could be generat-
continuing but lower level of political commitment. ing approximately 2,600 TWh of electricity around the
The growth rates assumed in these scenarios vary world. This means that, assuming a serious commit-
from 40% reducing to 15% over the scenario period ment is made to energy efficiency, enough solar
(2030) under the Advanced version, 30% reducing to power would be produced globally in twenty-five
10% under the Moderate version. years’ time to satisfy the electricity needs of almost
14% of the world’s population.
The two scenario versions are also divided in two
ways – into the four main global market divisions
(consumer applications, grid-connected, remote
industrial and off-grid rural), and into the regions of the
world as defined in projections of future electricity
demand made by the International Energy Agency.
9
Executive Summary
The capacity of annually installed solar power Policy Recommendations
systems would reach 281 GW by 2030. About 60%
of this would be in the grid-connected market, mainly In order to supply more than 3 billion people with
in industrialised countries. The total number of people solar electricity by the year 2030, a major shift in
by then covering their own electricity from a grid- energy policy will be needed. Experience over the
connected solar system would reach 1,280 million. past few years has demonstrated the effectiveness of
joint industrial and political commitment to achieving
Although the key markets are currently located mainly greater penetration of solar electricity into the energy
in the industrialised world, a global shift will result in a mix at local, national, regional and global levels.
significant share – about 20% or an annual market of
56 GW – being taken by the developing world for
rural electrification in 2030. Since system sizes are A number of key political actions are required:
much smaller, and the population density greater, this
means that up to 3.2 billion people in developing ✜ Firstly, growth of the world annual PV market
countries would by then be using solar electricity. This to a level of 281 GW by 2030 will only be
would represent a major breakthrough for the technol- achieved through the extension of best-prac-
ogy from its present emerging status. tice support schemes, appropriately adapted
to local circumstances, to encourage the
uptake of solar electricity amongst consum-
Solar Generation: PV’s Contribution to ers. The German and Japanese experiences
Industry, Employment and the Environment highlight the impact which such actions can
have. In Europe, the feed-in tariff has proved
As the annual PV market could grow to 281 GW, the to be the most effective market support
PV industry is facing great chances. For the job mechanism for renewable energy, including
seekers of the third decade of the 21st century, there solar PV.
would be a major contribution towards their employ- ✜ Secondly, the inherent barriers to the take-up
ment prospects. On the assumption that more jobs of solar power - and the subsidies available
are created in the installation and servicing of PV to fossil and nuclear fuels which currently
systems than in their manufacture, the result is that by penalise renewable sources - must be
2030, around 10 million full-time jobs would have removed.
been created by the development of solar power
✜ Thirdly, a variety of legally-enforced mecha-
around the world. The majority of those would be in
nisms must be implemented which secure
installation and marketing.
and accelerate the new market for solar
photovoltaics.
By 2030, solar PV would also have had one other
important effect. In environmental terms, it would be Our goal now must be to mobilise the necessary
reducing annual CO2 emissions by 1.6 billion t. This industrial, political and end-user commitment to this
reduction is equivalent to the output from 450 coal- technology and, more importantly, the services it
fired power plants. Cumulative CO2 savings from solar provides. We must redouble our efforts to ensure that
electricity generation would have reached a level of the generation born today benefits from all the
9 billion t. socio-economic and environmental benefits that solar
electricity offers.
10PV Solar Electricity – frequently asked questions
What is the difference between solar thermal Is PV only efficient in southern countries?
collectors and a photovoltaic power system? No. PV works everywhere where there is light. Even
Solar thermal collectors are used to heat water, in southern Germany, an average sized roof-top
mainly for household use. Photovoltaic systems system of 3 kW generates close to 3,000 kWh
generate electricity. annually. This could cover the annual total electricity
What is the difference between grid- demand of a single household.
connected and off-grid? Is PV expensive?
Grid-connected applications can feed electricity The electricity generation costs for PV systems are
directly into an electricity network. Off-grid systems currently higher than for other energy sources, if the
often have batteries to store the electricity produced environmental costs of conventional electricity
and have no access to the electricity grid. generation are excluded. Financial support is
Do we have enough silicon as raw material? therefore needed to develop a strong industry with
economies of scale. With large-scale production,
The raw material silicon used in the PV industry is
prices are expected to fall below residential
abundantly available worldwide. However, the
electricity prices and will also compete with the
process of producing the pure silicon needed for
generation costs of all other electricity sources
crystalline solar cells is complex. It can take two
(nuclear, fossil) within 20-30 years. In countries with
years from planning a new silicon factory to its first
feed-in tariffs, PV is already a very attractive
output. The dynamic development of the PV market
investment.
has led to a shortage of pure silicon, and the industry
has reacted by building new capacity. These new Is there enough space to install a large
factories improve the supply situation. number of PV systems?
Is it possible to recycle photovoltaic modules? Yes. PV is a space-efficient technology. For a 1 kW
system about 7 m2 of modules are necessary. In
Yes, all components in a solar module can be
order to cover the entire electricity demand of the
recycled. The most valuable parts are the solar cells
EU, only 0.7% of the total land area would be
themselves, which can be recycled into new wafers
needed. There is a huge area available which is not
as the basis for new solar cells. The aluminum
competing with other land uses, including roofs,
frames, glass and cables can also be recycled. For
building façades, noise barriers and vacant plots.
more information: www.pvcycle.org
Space availability is not a limiting factor for PV
When will PV be cost-competitive? development.
In many cases solar electricity is already cost- How long is the lifetime of a PV module?
competitive, especially for stand-alone applications
Many producers give performance warranties of
where no access to the public grid is available.
20-25 years for their modules. At the EC Joint
In southern Europe, grid-connected photovoltaic
Research Centre in Ispra (Italy), crystalline modules
electricity will be cost-competitive with peak power
have been operating in a field test, with excellent
by 2015. PV prices are expected to continue to fall.
performance results, for more than 20 years. The
Do PV systems generate more energy over majority of the modules continue to exceed 92% of
their lifetime than is needed for their their nominal power output as recorded at the
production? beginning of the testing period.
Yes. After approximately two years, a PV system in How much space do you need to install a
southern Europe based on crystalline technology roof-top system?
will have generated as much energy as was
This depends on the technology used. A 3 kW
needed to produce and install all its components.
system based on crystalline modules needs about
For a thin film system, the period is about a year.
23 m2 of a sloped roof area facing approximately
Over a PV system’s lifetime of more than 30 years,
south.
it will produce far more energy than was used to
create it. The energy used in PV production is
continually being reduced.
11© Paul Langrock/Zenit/Greenpeace
 art One:
P
Solar Basics

               13
Part One: Solar Basics
Figure 1.1: Global variations in irradiation Figure 1.2: Energy potential from PV around
the world
2500
300
50 50
2000 250
[kWh / (m2)]
0 0
[kWh / (m2)]
200
1500
-50 -50 150
1000
100
-150 -100 -50 0 50 100 150 -150 -100 -50 0 50 100 150
Source: Gregor Czisch, ISET, Kassel, Germany Source: Gregor Czisch, ISET, Kassel, Germany
The solar potential European Joint Research Centre (JRC) (http://re.jrc.
ec.europa.eu/pvgis).
There is more than enough solar radiation available
around the world to satisfy the demand for solar The greater the available solar resource at a given
power systems. The proportion of the sun’s rays that location, the larger the quantity of electricity gener-
reaches the earth’s surface can satisfy global energy ated. Subtropical regions offer a better resource than
consumption 10,000 times over. On average, each more temperate latitudes. The average energy
square metre of land is exposed to enough sunlight received in Europe is about 1,000 kWh per square
to receive 1,700 kWh of energy every year. metre per year, for example. This compares with
1,800 kWh in the Middle East.
The statistical information base for the solar energy
resource is very solid. The US National Solar Radiation Figure 1.2 shows the estimated potential energy
database, for example, has logged 30 years of solar output from solar PV generators in different parts of
radiation and supplementary meteorological data from the world. The calculation takes into account the
New Isofotón
factory in 237 sites in the USA. European solar radiation data average efficiency of modules and converters, as well
Malaga from 566 sites is published and assessed by the as the correct angle to the sun required at different
latitudes.
A comparison between Figures 1.1 and 1.2 shows
© Isofotón
that only a certain part of solar radiation can be used
to generate electricity. However, unlike with conven-
tional energy sources, there is no waste of energy
through efficiency losses, as sunlight cannot be
wasted. It has been calculated that if 0.71% of the
European land mass was covered with PV modules,
this would meet Europe’s entire electricity consump-
tion. Furthermore, International Energy Agency (IEA)
calculations show that if only 4% of the world’s very
dry desert areas were used for PV installations, this
would meet the whole world’s total primary energy
demand. Considering the vast areas of unused space
(roofs, building surfaces, fallow land, deserts etc) the
potential is almost inexhaustible.
14Part One: Solar Basics
What is photovoltaic energy?
Figure 1.3: Lifecycle of a PV system (c-Si)
‘Photovoltaic’ is a marriage of two words: ‘photo’,
meaning light, and ‘voltaic’, meaning electricity. Production facilities Silicon
Photovoltaic technology, the term used to describe
the hardware that converts solar energy into usable
power, generates electricity from light.
Production facilities Wafer
At the heart of photovoltaic (PV) technology is a
semi-conductor material which can be adapted to
Production facilities
release electrons, the negatively charged particles Cell
Coating Copper
that form the basis of electricity. The most common
Inverter
semi-conductor material used in photovoltaic cells is
Production facilities
silicon, an element most commonly found in sand. Battery (off-grid)
Aluminium Glass Module
There is no limitation to its availability as a raw Cables Charge
controller
material; silicon is the second most abundant material (off-grid)
in the earth’s mass.
Support structures Installation Meter (on-grid)
Junction box
All PV cells have two layers of semi-conductors, one (on-grid)
positively charged and one negatively charged. When
light shines on the semi-conductor, the electric field Demounting
across the junction between these two layers causes
electricity to flow, generating DC (direct current). The
greater the intensity of the light, the greater the flow of Recycling facilities Recycling
electricity.
A photovoltaic system therefore does not need bright
sunlight in order to operate. It can also generate PV technology
electricity on cloudy days. Due to the reflection of
sunlight, days with slight cloud can even result in The most important parts of a PV system are the
higher energy yields than days with a completely cells which form the basic building blocks of the unit,
cloudless sky. collecting the sun’s light, the modules which bring
together large numbers of cells into a unit, and, in
Generating energy through solar PV is quite different some situations, the inverters used to convert the
from how a solar thermal system works, where the electricity generated into a form suitable for everyday
sun’s rays are used to generate heat, usually for hot use.
water in a house, swimming pool etc.
The advantages of PV technology: PV cells and modules
✜ The fuel is free.
✜ There are no moving parts to wear out, break PV cells are generally made either from crystalline
down or replace. silicon, sliced from ingots or castings or from grown
ribbons, or thin film, deposited in thin layers on a
✜ Only minimal maintenance is required to keep
low-cost backing. Most cell production (90% in 2007)
the system running.
has so far involved the former, whilst future plans have
✜ The systems are modular and can be quickly a strong focus on the latter. Thin film technology
installed anywhere. based on silicon and other materials is expected to
✜ It produces no noise, harmful emissions or gain a much larger share of the PV market. This
polluting gases. technology offers several advantages, such as low
material consumption, low weight and a smooth
appearance.
15Part One: Solar Basics
Crystalline silicon
Figure 1.4: Cell technology shares in 2007
Crystalline silicon is still the mainstay of most PV a-Si/µc-Si 5.2% CIS 0.5%
modules. Although in some technical parameters it is CdTe 4.7% Ribbon c-Si 2.2%
not the ideal material for solar cells, it has the benefit Others 0.1%
of being widely available, well understood and uses
the same technology developed for the electronics
industry. Efficiencies of more than 20% have been
obtained with silicon cells already in mass production.
This means that 20% of the incoming insolation can
be transferred into electricity.
As well as the efficiency of the solar cells, their
thickness is also an important factor. Wafers - very thin
slices of silicon - are the basis for crystalline solar cells.
Thinner wafers mean less silicon needed per solar cell multi c-Si 45.2% mono c-Si 42.2%
and therefore lower cost. The average thickness of
Source: Photon International, March 2008
wafers has been reduced from 0.32 mm in 2003 to
0.17 mm in 2008. Over the same period, the average
efficiency has increased from 14% to 16%. By 2010, demand for silicon per watt of capacity can be
the aim is to reduce wafer thickness to 0.15 mm whilst reduced significantly.
increasing efficiency to an average of 16.5%.
During wafer production, a significant amount of Thin film
valuable silicon is lost as sawing slurry. Ribbon sheet
technology represents an alternative approach. This Thin film modules are constructed by depositing
avoids sawing loss by producing thin crystalline extremely thin layers of photosensitive materials onto
silicon layers using a range of techniques, such as a low-cost backing such as glass, stainless steel or
pulling thin layers from the melt, or melting powdered plastic. This results in lower production costs
silicon into a substrate. As sawing procedures, and compared to the more material-intensive crystalline
Large PV power plant
with solar trackers the material losses linked to them, are avoided, the technology, a price advantage which is currently
located in Castejon, Spain counterbalanced by substantially lower efficiency
rates.
Three types of thin film modules are commercially
© Acciona Solar
available at the moment. These are manufactured
from amorphous silicon (a-Si), copper indium
diselenide (CIS, CIGS) and cadmium telluride (CdTe).
All of these have active layers in the thickness range
of less than a few microns. This allows higher
automation once a certain production volume is
reached, whilst a more integrated approach is
possible in module construction. The process is less
labour-intensive compared to the assembly of
crystalline modules, where individual cells have to be
interconnected.
A temporary shortage of silicon has also offered the
opportunity for increasing the market share of thin film
technologies. Several new companies are working on
the development of thin film production based on a
roll-to-roll approach. This means that a flexible
16Part One: Solar Basics
Table 1.1: Module and cell efficiencies
Technology Thin Film Crystalline wafer based
Amorphous Cadmium CI(G)S a-Si/m-Si Monocrystalline Multicrystalline
silicon (a-si) telluride (CdTe)
Cell Efficien- 5-7% 8-11% 7-11% 8% 16 –19% 14 – 15%
cy at STC*
Module 13 – 15% 12 – 14%
Efficiency
Area needed 15 m2 11 m2 10 m2 12 m2 app. 7 m2 app. 8 m2
per kW** (for
modules)
* Standard Testing Conditions: 25°C, light intensity of 1,000W/m2, air mass = 1.5
** kW = kilowatt. Solar PV products and arrays are rated by the power they generate at Standard Testing Conditions
substrate, for example stainless steel, is coated with Modules
layers in a continuous process. The successful
implementation of such a production method will offer Modules are clusters of PV cells incorporated into a unit,
opportunities for significantly higher throughput in the usually by soldering them together under a sheet of glass.
factory and lower costs. EPIA expects a growth in the They can be adapted in size to the proposed site, and
thin film market share to reach about 20% of the total quickly installed. They are also robust, reliable and
production of PV modules by 2010. weatherproof. Module producers usually guarantee a power
output of 80% of the nominal power even after 20-25 years.
Among the three commercially available thin film
technologies, a-Si is the most important in terms of When a PV installation is described as having a
production and installation, with 5.2% of the total capacity of 3 kW, this refers to the output of the
market in 2007. system under standard testing conditions (STC),
allowing comparisons between different modules. In
Multicrystalline thin film on glass (CSG) is a promising central Europe, a 3 kW rated solar electricity system,
thin film technology which is now entering industrial with a module area of approximately 23 square
production. Microcrystalline technology, in particular metres (depending on technology, see Table 1.1),
the combination of amorphous silicon and microcrys- would produce enough power to meet the electricity
talline silicon (a-Si/m-Si), is another approach with demand of an energy-conscious household. Multicrystalline cells
encouraging results. at Q-Cells
© Q-Cells
Other cell types
Concentrator cells work by focusing light on to a small
area using an optic concentrator such as a Fresnel lens,
with a concentrating ratio of up to 1,000. The small area
can then be equipped with a material made from III-V
compound semi-conductors (multi-junction Gallium
Arsenide type), which have efficiencies of 30% and in
laboratories of up to 40%. The two main drawbacks
with concentrator systems are that they cannot make
use of diffuse sunlight and must always be directed very
precisely towards the sun with a tracking system.
17Part One: Solar Basics
Inverters Types of PV system
Inverters are used to convert the direct current (DC) Grid-connected
power generated by a PV generator into alternating This is the most popular type of solar PV system for
current (AC) compatible with the local electricity homes and businesses in the developed world.
distribution network. This is essential for grid-connect- Connection to the local electricity network allows any
ed PV systems. Inverters are offered in a wide range excess power produced to be sold to the utility.
of power classes, from a few hundred watts through Electricity is then imported from the network outside
the most frequently used range of several kW daylight hours. An inverter is used to convert the DC
(3-6 kW) up to central inverters for large-scale power produced by the system to AC power for
systems with 100 kW and above. running normal electrical equipment.
In countries with a premium feed-in tariff, payment for
Components for stand-alone PV Systems the electricity generated (see Part Six: Policy Drivers)
is considerably higher than the usual tariff paid by the
Stand-alone (off-grid) PV systems require a battery, customer to the utility, so all the electricity produced is
frequently of the lead acid type, to store the energy often fed into the public grid and sold to the utility.
for future use. New high-quality batteries designed This is the situation in countries such as Germany or
especially for solar applications, with lifetimes of up to Spain.
15 years, are now available. However, the lifetime of
the battery strongly depends on the battery manage- Off-grid
ment and the user’s behaviour. The battery is Where no mains electricity is available, the system is
connected to the PV array via a charge controller. connected to a battery via a charge controller. This
The charge controller protects the battery from stores the electricity generated for future use and acts
overcharging or discharging, and can also provide as the main power supply. An inverter can be used to
information about the state of the system or enable provide AC power, enabling the use of normal
metering and pre-payment for the electricity used. If electrical appliances. Typical off-grid applications are
AC output is needed, an inverter is required to repeater stations for mobile phones, electrification for
New building at ECN convert the DC power from the array. remote areas (mountain huts) or rural electrification in
with curved PV roof developing countries. Rural electrification means
designed by
BEAR architects: either small solar home systems covering basic
interior electricity needs in a single household, or larger solar
mini-grids, which provide enough power for several
homes.
© BEAR architects, M. van Kerckhoven
Hybrid system
A solar system can be combined with another source
of power - a biomass generator, a wind turbine or
diesel generator - to ensure a consistent supply of
electricity. A hybrid system can be grid-connected,
stand-alone or grid-support.
18Part One: Solar Basics
Figure 1.5: How a grid-connected photovoltaic system works
1 PV array 4 Import / Export meter
2 PV array combiner / junction box 5 Connection to the grid
3 Grid-tied inverter 6 Load
Figure 1.5 shows how electricity generated by solar The householder/generator then has two choices:
cells in roof-mounted PV modules is transformed by either to sell all the output to the local power utility (if a
an inverter into AC power suitable for export to the feed-in tariff is available) or to use the solar electricity
grid network. to meet demand in the house itself, and then sell any
surplus to the utility.
19© Martin Jehnichen/Greenpeace
 art Two:
P
The Solar Power Market

                         21
Part Two: The Solar Power Market
Solar power is booming. By the end of 2007, the Typical of new applications is the use of PV to control
cumulative installed capacity of all PV systems around air conditioning in cars. A small system integrated in
the world had surpassed the landmark figure of 9,200 the roof keeps the temperature inside at a constant
MW. This compares with a figure of 1,200 MW at the level by operating a ventilator when the car is parked,
end of 2000. Installations of PV cells and modules especially in the sun during summertime. This results
around the world have been growing at an average in lower peak temperatures inside the car and a much
annual rate of more than 35% since 1998. cheaper air conditioning system, due to a lower
requirement for power. Manufacturers may also be
The market value of the solar PV market reached an able to save on the cost of expensive heat-resistant
annual € 13 billion in 2007. Competition among the materials in the vehicle’s interior.
major manufacturers has become increasingly
intense, with new players entering the market as the Market development
potential for PV opens up. In 2007, this sector accounted for roughly 1% of
global annual production. As demand for a mobile
Although growth in recent years has been primarily in electricity supply increases, it is likely that the
the grid-connected sector, the demand side of the consumer goods market will continue to grow in
international PV market can be clearly divided into four absolute terms (although its relative share will
sectors. These market categories are used through- decrease), especially with the introduction of
out this report. innovative low-cost solar electricity technologies such
as organic solar cells.
Demand Side Market Sectors
2. Grid-connected systems
1. Goods and services
Applications
Applications PV applications which have a permanent connection to
Solar cells or modules are used in a wide range of the electricity grid are categorised as on-grid applica-
consumer products and small electrical appliances, tions. PV can be installed on top of a roof or integrated
including watches, calculators and toys, as well as to into the roofs and facades of houses, offices and
provide power for services such as water sprinklers, public buildings. Private houses are a major growth
Large solar road signs, lighting and phone boxes. area for roof systems as well as for Building Integrated
power plant in Spain PV (BIPV). A 3 kW solar electricity system in southern
Germany delivers approximately 3,000 kWh/year,
sufficient to supply up to 100% of the annual electricity
needs of an energy-conscious household.
© Ecotecnía
PV is also increasingly used as a design feature by
architects, replacing elements in a building’s enve-
lope. Solar roof tiles or slates can replace conven-
tional materials, flexible thin film modules can even be
integrated into vaulted roofs, whilst semi-transparent
modules allow for an interesting mixture of shading
and daylight. PV can also be used to supply peak
power to the building on hot summer days, when air
conditioning systems need most energy, thus helping
to reduce the maximum electricity load.
If a solar electricity system is recognised as an integral
part of a building, then the money spent on decorative
materials for facades, such as marble, can instead be
invested in solar modules. Solar power doubles up as
both an energy producer and a building material. For
22Part Two: The Solar Power Market
prominent businesses, it can provide the public face of Another substantial benefit of the grid-connected
their environmental commitment. domestic market is the control which PV systems
allow the consumer over their power supply. Not only
Distributed generation using solar facades or roofs is electricity generated at the point of demand,
can also provide benefits to a power utility by avoiding avoiding grid losses of electricity, but the consumer is
grid replacement or by strengthening and potentially effectively transformed into the operator of his or her
reducing maximum demand for conventional own power station. As international power markets
electricity, especially in countries with a high cooling steadily liberalise, this is likely to have increasingly
load. In particular, PV can soften the peak demand important market implications. The full effect will be
caused by the use of air conditioning systems. In visible as soon as PV gets close to achieving parity
many areas around the world, the extensive use of air with domestic electricity prices.
conditioning during the summer months leads
repeatedly to black outs and brown outs. Since
supply from PV systems matches perfectly the 3. Off-grid electrification
demand from air conditioning systems. on bright,
sunny days it can help to reduce the number of Applications
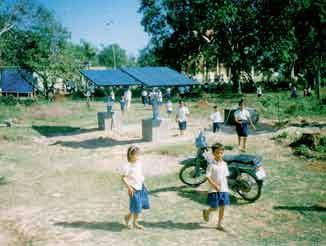
power cuts or reductions. PV provides vital power for communities in the
developing world who have no access to mains
Large-scale grid-connected PV arrays (> 1 MW) electricity. About 1.7 billion people around the world
represent about 10% of the European PV market. currently live without basic energy services. 80% of
These systems are particularly suitable in areas where them live in rural areas. This huge market is a great
there is no competition from other land use demands. opportunity for both the PV industry and the local
Such large plants function solely as power plants, and population.
are therefore exclusively delivering electricity to the grid,
without self-consumption. Sun-drenched desert PV can provide electricity for both private consump-
regions present good opportunities in the longer term tion and industrial uses. Domestic energy systems
for large-scale plants, especially as module prices provide high quality lighting and communications
continue to fall, for instance in the south-west United (radio/TV/internet), whilst energy used for cooling,
States, Africa and Mongolia. In Germany, large-scale water pumping or powering tools can be a crucial
ground-based systems in the megawatt class have motor for local economic development. PV has the
become a new market in recent years. This offers a potential to deliver much more than just electricity for Installation of a
fresh source of income for farmers, who can rent their lighting or improved health care. By providing the PV system on a roof
land to investors, with the advantage of a secure
revenue for at least 20 years.
© Conergy
Market development
This market segment is the current motor of the PV
boom, with most development taking place in the
OECD countries. More and more national governments
see PV as an important technology for the future and
have already established, or are in the process of
establishing, support programmes. Whilst in 1994 only
20% of new PV capacity was grid-connected, this had
grown to approximately 90% by 2007.
A growing number of countries have followed the
successful examples of Germany, Japan and the USA,
which have all established support programmes for grid-
connected PV systems. These programmes will continue
to provide an impetus for market growth for some years
to come - until PV becomes competitive with domestic
electricity prices (see Part Six: Policy Drivers).
23Part Two: The Solar Power Market
Figure 2.1: Global cumulative PV capacity
10000 9162
9000
8000
6770
7000
6000 5167
5000
MW
3847
4000
2795
3000 2201
1762
1428
2000 948 1150
580 669 795
502
1000
0
1994 1995 1996 1997 1998 1999 2000 2001 2002 2003 2004 2005 2006 2007
power supply for computers, for example, it can Market development
enable people to access better education or Apart from its clear social advantages, the economic
information through the internet. justification for using PV is through the avoided fuel
costs, usually expensive diesel, or by comparison
There is also a powerful need to provide clean with the cost of extending the grid. For subsistence-
drinking water in the developing world. The World level communities, the initial stumbling block is often
Health Organisation estimates that 10,000 children the capital cost of the system. Although numerous
die each day from water-borne diseases. Solar-pow- rural development programmes have been initiated in
ered water purification systems and pumps are easily developing countries, supported both by multi- and
transportable, easy to maintain and simple to use bilateral assistance programmes, the impact has so
and, as part of rural health initiatives, could be an far been relatively small. However, it is expected that
PV systems important tool in the fight against disease. this market segment will capture a substantial part of
integrated in the
façade of a the global PV market share in the coming decades. In
building 2007, approximately 4% of global PV installations
were dedicated to rural electrification.
© Fronius
4. Off-grid industrial
Applications
The most common industrial uses for off-grid solar
power are in the telecommunications field, especially
for linking remote rural areas to the rest of the country.
In India, for example, more than a third of the PV
capacity is devoted to the telecommunications sector.
There is a vast potential for repeater stations for mobile
phones powered by PV or PV/diesel hybrid systems.
Desalination plants are another important off-grid
application for PV. Others include traffic signals,
marine navigation aids, security phones, weather or
pollution monitors, remote lighting, highway signs and
wastewater treatment plants.
24Part Two: The Solar Power Market
Figure 2.2: Global annual PV market
2392
2500
2000
1603
1500 1321
MW
1052
1000
594
439
500 278 334
153 202
78 89 126
0
1995 1996 1997 1998 1999 2000 2001 2002 2003 2004 2005 2006 2007
Figure 2.3: Top 5 PV country markets
Rest 20% Germany 42% Rest 13% Germany 46%
Italy 1% Italy 2%
USA 8%
USA 9%
Japan 21% Spain 7% Japan 10% Spain
Top 5 Total installed capacity 2007 (MW) Top 5 New capacity 2007 (MW)
Germany 3,800 Germany 1,100
Spain 632 Spain 512
Japan 1,938 Japan 230
USA 814 USA 190
Italy 100 Italy 50
Rest 310
Market development The demand for off-grid industrial PV systems is
Apart from avoided fuel costs, by totally or partly expected to continue to expand over the next decade
replacing a diesel engine for example, industrial PV and beyond, especially in response to the continued
systems offer high reliability and minimal maintenance. growth of the telecommunications industry. Mobile
This can dramatically reduce operation and mainte- telephone masts and repeater stations offer a
nance costs, particularly in very remote or inacces- particularly large potential, especially in countries with
sible locations. low population densities. Providing communications
25Part Two: The Solar Power Market
services to rural areas in developing countries as part
Figure 2.4: Regional and national shares
of social and economic development packages, will of global PV cell production in 2007
also be a major future market opportunity for photo-
voltaics. About 4% of global PV installations were Rest of Asia 3% Australia 1% Africa &
Middle East 0%
used for PV industrial off-grid applications in 2007.
Taiwan 11% Germany 20%
Japan 22%
Supply Side Market - Manufacture
Rest of
Europe
Solar grade silicon 7%
Silicon is the basic material required for the produc-
tion of solar cells based on crystalline technology –
90% of the world market. The availability of sufficient
silicon at reasonable prices is therefore an essential India 1%
precondition for a dynamic PV industry.
China 29% USA 6%
Until recently, the silicon industry produced electronic
Source: Photon International – March 2008
grade silicon exclusively for the semi-conductor
industry, mainly for use in computers. Only a small
fraction was delivered to the PV industry, which conductors, and can thus be produced more
represented a good way for the suppliers to level out cheaply. Several companies have therefore begun to
demand fluctuations from the semi-conductor develop processes for producing solar grade silicon.
industry. With the dynamic growth of the PV industry The development of these production lines and
in recent years, however, the situation has changed. construction of the first factories will still take time,
In 2007, more than half of the worldwide production however. So, until all the new planned production
of electronic grade silicon was used to produce solar facilities for solar grade silicon are operational, the PV
cells. industry will continue to compete with the semi-con-
Aerial view of the ductor industry for the currently limited supply
German Parliament This growing demand has motivated the silicon available on the market.
with PV modules
integrated industry to change its approach. Silicon for solar cells
on the roof can be of lower quality than that required for semi- It is expected that by 2008 the availability of solar
grade silicon for the PV industry will lead to a much
more relaxed situation in the silicon market. Between
2008 and 2010 it is projected that more than
© Engcotec
€4.1 billion will be invested in upscaling silicon
production capacities.
Solar cell and module production
In 2008, the level of investment in new plants to
manufacture solar cells and modules is expected to
exceed €1.6 billion. This excludes wafer and silicon
manufacturing capacities. This figure underlines the
pace at which the PV industry is expanding in order to
satisfy global demand.
26Part Two: The Solar Power Market
Up to now, the manufacture of solar cells and
Figure 2.5: Top 10 PV cell producers
modules has been concentrated in three key
geographical areas – Europe, Japan and the United Rest of the World Q-Cells 9%
47%
States. However, the country with the strongest Sharp 8%
growth in production facilities is China. Suntech
8%
The leading cell production companies can be seen
in Figure 2.5. Although until a few years ago the
market was dominated by BP Solar, a subsidiary of
the multinational oil company, this situation has
radically changed with the entry of new Japanese and
European players. More recently, the leading
company in cell production has been the Japanese Kyocera
company Sharp. However, in 2007 Sharp has 5%
continued to lose market share relative to its competi- Ja Solar 3% First Solar 5%
Yingli 3% Motech 4%
tors, in particular the German-based Q-Cells and
Sanyo 4% SolarWorld 4%
Solarworld and the Chinese Suntech. These have
Source : Photon International
together decreased the dominant position of Sharp
from 23.6% in 2005 to 8.5% in 2007. In 2007
Q-Cells became the new market leader. Just over
53% of all cell production is handled by the 10 The higher up the PV value chain one travels, the fewer
biggest companies (compared to 75 % in 2006); companies are involved. At the upper end of the chain,
nearly all of these are currently investing heavily in silicon production requires substantial know-how and
new production facilities. investment, as does the production of wafers. At the level of
cell and module producers, on the other hand, where know-
An important issue for manufacturers is being able to how and investment needs are smaller, there are many more
match the opening of new production capacity with players in the market. At the end of the value chain, the
expected demand. Investors need a planning horizon installers are often small, locally-based businesses.
that goes beyond a typical factory’s write-off period of
five to seven years. Some smaller companies have
nonetheless been able to obtain investment from Installation of modules
public share ownership, often through one of the on a building roof
increasing number of green investment funds. This is
why the relative stability of systems such as the
German feed-in tariff, has proved crucial to business
© Goldbeck
commitment. In anticipation of a flourishing market,
Germany has seen a steady increase in both solar
cell and module manufacture from 1995 onwards.
Further encouraged by the Renewable Energy Law,
updated in 2004, annual production of PV cells
increased from 32 MW in 2001 to around 850 MW in
2007.
27 art Three:
P
The Solar Future
29Part Three: The Solar Future
The Greenpeace/EPIA The two EPIA /Greenpeace scenarios outlined below
‘Solar Generation’ Scenarios are based on the following core inputs:
✜ Current PV market data from reliable sources
Methodology and Assumptions (national governments, the International
Energy Agency, PV industry)
If PV is to have a promising future as a major energy ✜ PV market development over recent years,
source, it must build on the experiences of those both globally and in specific regions
countries that have already led the way in stimulating
✜ National and regional market support
the solar electricity market. In this section, we look
programmes
forward to what solar power could achieve - given the
✜ National targets for PV installations and
right market conditions and an anticipated fall in costs
manufacturing capacity
- over the coming two decades of the twenty-first
century. As well as projections for installed capacity ✜ The potential for PV in terms of solar irradia-
and energy output, we also make assessments of the tion, the availability of suitable roof space
level of investment required, the number of jobs that and the demand for electricity in areas not
would be created and the crucial effect that an connected to the grid
increased input from solar electricity will have on
greenhouse gas emissions (see Part Five: Solar
Benefits). 1. Advanced Scenario
This scenario is based on the assumption that
continuing and additional market support mecha-
nisms will lead to a dynamic expansion of worldwide
PV installed capacity. Market support programmes
create economies of scale and PV prices will fall
faster as a result, leading to a further market push.
Although such market programmes are designed to
be only a temporary means of support, they are
nonetheless crucial in initiating a stable commercial
PV Cell production environment. EPIA/Greenpeace strongly believe
process that this scenario can be achieved if the
necessary political support is forthcoming.
© Ersol
Market growth rates under the Advanced Scenario
Average growth rate 2007-2010 40%
Average growth rate 2011-2020 28%
Average growth rate 2021-2030 18%
30Part Three: The Solar Future
2. Moderate Scenario The ‘Alternative Scenario’ for future electricity demand
is based on the Greenpeace/European Renewable
This scenario envisages the development of PV Energy Council Energy [R]evolution report (January
against the background of a lower level of 2007), and takes into account the extensive use of
political commitment. Over the longer term, the energy efficiency measures in order to decrease final
gap between the Moderate and Advanced Scenarios electricity consumption. This scenario shows global
widens considerably. With insufficient additional global demand for power increasing from 13,675 TWh in
political support, fast market deployment is difficult. 2003 to 14,188 TWh in 2010, 16,614 TWh in 2020
Without the potential for economies of scale, PV and 19,189 TWh in 2030. The PV contribution is there-
production costs and prices will fall at a slower rate fore higher under this projection.
than in the Advanced Scenario, resulting in a lower
level of PV deployment. Carbon dioxide savings
An off-grid solar system which replaces a typical
Market growth rates under the Moderate Scenario diesel unit will save about 1 kg CO2 per kilowatt hour
Average growth rate 2007-2010 30% of output. The amount of CO2 saved by grid-connect-
ed PV systems depends on the existing profile of
Average growth rate 2011-2020 21%
electricity production in different countries. The global
Average growth rate 2021-2030 12%
average figure is taken as 0.6 kg CO2 per kilowatt-
hour. Over the whole scenario period, it has therefore
The growth rates presented in the scenarios represent an been assumed that PV installations will save on
average calculated from varying rates of annual growth. average 0.6 kg CO2 per kilowatt-hour.
The following assumptions have been employed to The scenarios are also divided in two further ways -
show the effect of these scenarios in terms of both into the four global market divisions (consumer
electricity supply and carbon dioxide savings: applications, grid-connected, off-grid industrial and
off-grid rural), and into the regions of the world as
Electricity consumption defined in projections of future electricity demand
Two assumptions are made for the expected growth made by the International Energy Agency. These
in electricity demand over the first decades of the 21st regions are OECD Europe, OECD Pacific, OECD
century. North America, Latin America, East Asia, South Asia,
China, the Middle East, Africa and the Transition Large solar
The ‘Reference Scenario’ for growth in global Economies (mainly the former Soviet Union). power plant in Spain
electricity demand, against which the percentage
contribution from PV power can be judged, is
extracted from projections by the International Energy
© Ecotecnía
Agency (WEO 2007). These show global demand for
power increasing from 15,016 TWh in 2005 to
21,278 TWh in 2015 and 29,737 TWh in 2030.
31Part Three: The Solar Future
Table 3.1: Solar Generation scenario results for global PV market up to 2030
Current situation Scenarios
2007 2010 2020 2030
Advanced Scenario
Annual Installations in GW 2.4 6.9 56 281
Accumulated Capacity GW 9.2 25.4 278 1,864
Electricity Production in TWh 10 29 362 2,646
PV Contribution to electricity consumption - reference scenario (IEA) 0.07% 0.16% 2.05% 8.90%
PV Contribution to electricity consumption - alternative scenario 0.07% 0.20% 2.18% 13.79%
Grid connected people / households / people living on PV in Million 5.5 18 198 1,280
Off grid connected people in Million 14 32 757 3,216
Employment in thousand people 119 333 2,343 9,967
Market value in Billion € 13 30 139 454
Annual CO2 savings in Mt 6 17 217 1,588
Cumulative carbon savings in Mt 27 65 976 8,953
Moderate Scenario
Annual Installations in GW 2.4 5.3 35 105
Accumulated Capacity GW 9.2 21.6 211 912
Electricity Production in TWh 10 24 283 1,291
PV Contribution to electricity consumption - reference scenario (IEA) 0.07% 0.14% 1.20% 4.34%
PV Contribution to electricity consumption - alternative scenario 0.07% 0.17% 1.70% 6.73%
Grid connected people / households / people living on PV in Million 5,5 14 136 564
Off grid connected people in Million 14 59 837 2,023
Employment in thousand people 119 252 1,462 3,718
Market value in Billion € 13 24 94 204
Annual CO2 savings in Mt 6 15 170 775
Cumulative carbon savings in Mt 27 61 839 5,333
32Part Three: The Solar Future
Table 3.2: Solar Generation scenario: PV market development (annual installed capacity) up to 2010
2007 2008 2009 2010
Advanced Scenario 2,392 MW 4,175 MW 5,160 MW 6,950 MW
Moderate Scenario 2,392 MW 3,110 MW 4,043 MW 5,256 MW
Key results In Europe alone, there would be roughly 300 million
The results of the Greenpeace/EPIA ‘Solar Genera- people receiving their household electricity supply
tion’ scenarios show clearly that, even from a relatively from grid-connected solar electricity. This calculation
low baseline, PV electricity has the potential to make is based on an average household size of 2.5 people
a major contribution to both future electricity supply and an average annual electricity consumption of
and the mitigation of climate change. The main figures 3,800 kWh.
can be seen in Table 3.1 for the whole scenario
period up to 2030, and the results for annual capacity In the non-industrialised world, approximately
up to 2010 only in Table 3.2. 320 GW of solar capacity is expected to have been
installed by 2030 for rural electrification. Here, the
The Solar Generation Advanced Scenario therefore assumption is that, on average, a 100 Wp stand-
shows that by 2030, PV systems could be generating alone system will currently cover the basic electricity
approximately 2,646 terawatt hours of electricity around needs of three people per dwelling. Over time, it is
the world. expected that larger systems will be used for rural
electrification. However, system sizes in the develop-
Under this scenario, the global installed capacity of ing world are presently much smaller than for on-grid
solar power systems would reach 1,864 GW by applications in the developed word, and the popula-
2030. About 74% of this would be in the grid- tion density is greater. This means that up to
connected market, mainly in industrialised countries. 3.2 billion people in developing countries would
The total number of people by then supplied with by then be using solar electricity. This would
household electricity from a grid-connected (including represent a major breakthrough for the technology
building-integrated, large-scale and roof-top) solar from its present emerging status.
system would reach approximately 1,280 million.
PV module
production line
© aleo solar
33You can also read