Global Market Outlook - For Solar Power / 2018 2022
←
→
Page content transcription
If your browser does not render page correctly, please read the page content below
Global Market Outlook
For Solar Power / 2018 - 2022

Supported by:
Africa-EU Renewable Energy
                          Cooperation Programme (RECP)

                                                                                            Caption to image. © SPE

CONNECTING AFRICAN AND EUROPEAN
DEVELOPERS AND INVESTORS

          Finance Catalyst                                          Funding Database
          The Finance Catalyst links projects                       RECP has developed a database on
          to finance opportunities targeting                        funding instruments financing
          small- and medium-scale renewable                         private sector projects on renewable
          energy projects in Africa.                                energy in Africa.

          Events                                                    Market Information
          Our matchmaking and information                           RECP offers a variety of products to
          events provide insights into African                      give your business an overview on
          RE markets and link European and                          the energy markets of selected African
          African entrepreneurs and financiers.                     countries.

                                                  The RECP is a programme of the Africa-EU Energy Partnership (AEEP),
www.africa-eu-renewables.org                        a partnership between the European Union and the African Union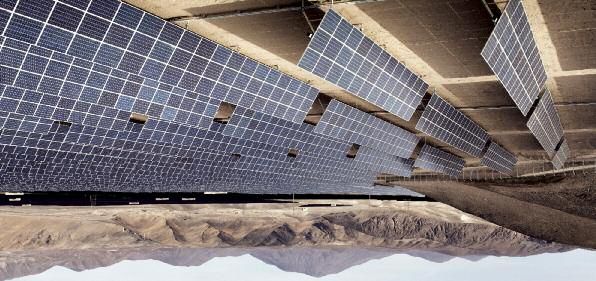
FOREWORD

Welcome to SolarPower Europe’s Global Market Outlook 2018 – 2022. We are very proud that our market intelligence team
has been awarded the ‘Winner for Best Provision of Industry Information and Intelligence’ at the European Association
Awards 2018. This award truly recognises the skill and value of this report for the solar sector, and the capabilities of our
market intelligence team. Winning the award gives us the motivation to provide you with an even more comprehensive
edition. We have again cooperated with the Global Solar Council (GSC) to address the development of solar in many new
emerging markets. As the number, size and importance of solar markets is quickly increasing, we have invited partner solar
associations, of the GW+ scale solar markets, to provide insights on their home countries.
The speed of current solar developments is truly amazing. It was only in 2016, that we celebrated Europe reaching the important
milestone of 100 GW of grid connected solar power capacity. At that time, nobody had anticipated that only a year later, in 2017,
the world would add nearly 100 GW of solar in just 12 months.
2017 was also a very special year, because solar deployed nearly twice as much capacity as wind. Solar also out performed
traditional energy generation technologies, with almost 3 times as much solar compared to gas and coal, and around a factor
of 9 times more than nuclear additions. Solar alone installed more generation capacity than all fossil fuels and nuclear together.
The reason for solar’s popularity are manifold – it’s unique in its flexible and distributed clean nature, which allows innumerable
applications. It is now also increasingly the lowest-cost power generation technology. Researchers and industry have been doing
a tremendous job of reducing solar costs.
Another record solar bid took place in 2017 in Saudi Arabia, bringing the tariff record down to 2.34 US cents/kWh. Even more impressive
is that in that tender, 7 of the technical bids were below 2.9 US cents/kWh. In other words, a low 2 US cent tariff range is the new
normal, when you want to win a solar tender under ideal conditions, with high irradiation and a stable policy framework.
This Saudi tender also included one bid that was as low as 1.79 US cents, which was disqualified in the end. This bid reportedly
included bifacial technology, which enables power generation on both sides of a solar module and promises yield improvements of
10 to 30%. Bifacial solar is a simple and outstanding technology, though just one of many fascinating innovations in the solar field.
The solar industry has done its homework in bringing cost down and providing the facilities to deploy solar rapidly (in 2017,
China alone installed 53 GW in one year). Now it’s key that policy makers embrace this opportunity by quickly creating the right
regulatory frameworks for solar and storage, and other relevant technologies, to help speedily accomplish the energy transition.
We are very glad that just before we went to print with this report, the European Union’s three legislative institutions – the
Commission, Parliament and Council – agreed on a 32% 2030 renewables target and empowered citizens, companies and
communities with the right to produce, consume, store and sell power without being subject to punitive taxes or excessive red
tape. That’s the right direction – and what we’ve been lobbying for. A new solar dawn is breaking in Europe and SolarPower
Europe are at the forefront of shaping the new framework for solar and delivering its potential for our members.
If you would like to get an idea of the manifold solar business opportunities, or the regulatory environment controlling solar
deployment in Europe, please check the Trends chapter. Here we outline the key issues that SolarPower Europe is working on
to enable solar to play the core role in the clean energy transition.
Enjoy reading our Global Market Outlook 2018 – 2022.

                                                                                            Thanks to our Sponsor Members:

JAMES WATSON           MICHAEL SCHMELA
CEO                    EXECUTIVE ADVISOR

                                                             SolarPower Europe / GLOBAL MARkET OUTLOOk fOR SOLAR POWER 2018-2022 / 3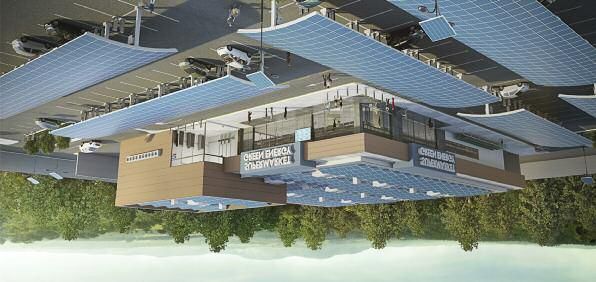
TABLE OF CONTENTS

                                                         FOREWORD                                                                                                   3
                                                         EXECUTIVE SUMMARY                                                                                          5
                                                         1     GLOBAL SOLAR MARKET                                                                                 7
                                                               UPDATE 2000 - 2017                                                                                  7
                                                               PROSPECTS 2018 - 2022                                                                              15
                                                               PROSPECTS 2018 - 2022 / SEGMENTS                                                                   22

                                                             TRENDS WHAT’S HOT IN SOLAR                                                                      23
                                                               1  Small is beautiful: Small-scale installations and
                                                                  the European energy transition                                                             24
                                                               2 Solar smart cities: A great match                                                           26
                                                               3 Solar mobility: Choosing solar for the driver’s seat                                        27
                                                               4 Solar & storage: Unleashing the potential for the
                                                                  perfect partner                                                                            29
                                                               5 Sustainability and environmental footprint:
                                                                  Taking care – solar generating truly green power                                           33
                                                               6 O&M: Long-term high solar system performance
                                                                  with a little help from a friend                                                           35
                                                               7 Solar power purchase agreements: Increasing leadership
                                                                  from private sector looking for green power procurement                                    37
                                                               8 Tenders: Controlling solar growth & cost                                                    40
                                                               9 Solar in emerging markets - so much untapped potential                                      42
                                                               10 Technology update - how to cut cost even further                                           43

                                                         2     GW-SCALE SOLAR POWER MARKETS IN 2017                                                               47
                                                         3     THE EUROPEAN SOLAR MARKET                                                                          69
                                                               2000 - 2018 UPDATE                                                                                 69
                                                               2000 - 2018 UPDATE / SEGMENTATION                                                                  72
                                                               PROSPECTS 2018 - 2022                                                                              73
                                                         4     GLOBAL MARKET OUTLOOK FOR SOLAR POWER                                                              78

Project manager & lead author: Michael Schmela, SolarPower Europe.

Market intelligence: Zubair Aslam, Thomas Döring, Raffaele Rossi, Michael Schmela, SolarPower Europe.

Internal co-authors: Aurélie beauvais, Naomi Chevillard, Mariano Guillén Paredes, Máté Heisz, Raffaele Rossi, Michael Schmela, SolarPower Europe.

External co-authors: China Photovoltaic Industry Association (CPIA); Dan Whitten & Justin baca, US Solar Industries Association (SEIA); Japan Photovoltaic Energy
Association (JPEA); Faruk Telemcioglu, Günder Turkish Solar Energy Society (GÜNDER); Steve blume, Smart Energy Council; Rodrigo Lopes Sauaia & Stephanie betz,
brazilian Photovoltaic Solar Energy Association (AbSOLAR).

External contributors: AbSOLAR, American University of beirut, APESF, APREN, borzen, bPVA, bSA, bSW-Solar, CPIA, EDORA, Elettricità Futura, ENERPLAN, ENR,
ENS, ERU, European Energy, Finnish Clean Energy Association, Green Energy Association of Israel, GIZ, GSC, GÜNDER, HELAPCO, IRENA, JPEA, MANAP, Multiconsult,
OEb, Photovoltaic Austria, PV POLAND, RPIA, SAPI, SAPVIA, SEIA, Smart Energy Council, Solar Trade Association, Solární Asociace, Svensk Solenergi, Swissolar,
TrendForce, UARE, UNEF.

Design: Onehemisphere, Sweden.

Supported by: Intersolar Europe, Global Solar Council (GSC).

Disclaimer: Please note that all historical figures provided in this brochure are valid at the time of publication and will be revised when new and proven figures are
available. All forecast figures are based on SolarPower Europe knowledge at the time of publication. Please also note that forecast figures have been rounded.

SolarPower Europe’s methodology includes only grid-connected systems.

4 / SolarPower Europe / GLObAL MARkET OUTLOOk FOR SOLAR POWER 2018-2022
EXECUTIVE SUMMARY

2017 was another historic year for     The boost in solar is to a large extent a result of its spectacular cost
the solar power sector. More solar     development. In February 2018, a 300 MW tender in Saudi Arabia was won at a
PV capacities were installed           new world record low solar power price of 2.34 US cents/kWh. Due to technical
globally than any other power          improvements, solar power cost and price will continue to quickly improve.
generation technology. Solar alone
                                       Global solar market demand in 2017 was driven by China. For the first
saw more new capacity deployed
                                       time, China installed more than half of the world’s solar capacity in one year
than fossil fuels and nuclear
                                       – to be exact, 53.3%. But the low cost of solar has been attracting many
combined. Solar added almost
                                       countries to look seriously into this unique, flexible and distributed clean
twice as much capacity as its
                                       power technology. While in 2016, only seven countries installed over 1 GW,
renewable peer, wind power.
                                       in 2017, the number has increased to nine (see p. 47, Chapter on GW-scale
A total of 99.1 GW of grid-connected   market overviews from national associations of these countries).
solar was installed in 2017. That’s
                                       Europe has left its several-year long downward trend in 2017, adding 9.2
almost a 30% year-on-year growth
                                       GW, a 30% increase compared to the 7 GW installed the year before. The
over the 76.6 GW added in 2016.
                                       European growth is primarily a result of Turkey’s gigantic growth. When
In 2017, almost as much solar was      looking at the 28 members of the European Union, there was hardly any
installed in one year as the world     growth at all: the EU-28 added 5.91 GW in 2017, compared to 5.89 GW in 2016.
had installed in total capacity in     This result still stems from the UK’s ‘solar exit’ in 2016, which again halved
2012 (100.9 GW). This led to a total   new installations in 2017. Even though 21 of the 28 EU markets added more
global solar power capacity of over    solar than the year before, the overall market performance was still sluggish.
400 GW in 2017, after solar exceeded
                                       Our Medium Scenario expects about 3.5% market growth to 102.6 GW
the 300 GW mark in 2016 and the
                                       new PV capacity additions in 2018, despite the recent subsidy cut
200 GW level in 2015.
                                       announcement from China to restructure its solar incentive programmes.
                                       Again, all Global Market Outlook 2018 scenarios show stronger growth
                                       than in the previous GMO edition. In 2017, we assumed a cumulative
                                       installed capacity of 471.2 GW for the Medium Scenario in 2018, this year we
                                       estimate 505.2 GW, which is about 7% higher. In the GMO 2018, we
                                       anticipate a range between 714.6 and 1,042.1 GW, with 871.3 GW forecasted
                                       for the most likely scenario in 2021 – that’s about 13% higher.
                                       Under optimal conditions, the world’s solar generation plant capacity
                                       could reach up to 1,270.5 GW by the end of 2022, but we consider 1,026.2
                                       GW more likely. Still, that means solar would reach the terawatt
                                       production capacity level in 2022.
                                       Despite remarkable growth rates in recent years, there is still a long way to
                                       go for solar and renewables – RES total share reached 12.1% of total global
                                       power output in 2017.

                                       The report and all figures can be downloaded at:
                                       www.solarpowereurope.org

                                                     SolarPower Europe / GlOBAl MARKET OUTlOOK FOR SOlAR pOWER 2018-2022/ 5
JOIN 200+
SolarPower Europe
Members

Influence
            /   Intelligence
                               /     Network
                                                       /     Discounts
                                                                                 /     Visibility

                               SolarPower Europe is an association representing over 200 members active
                                              along the whole solar value chain. Find more information:
                                                                          www.solarpowereurope.org
1
GlObal SOlaR MaRKET
UPDATE 2000 - 2017

Diego de Almagor, Chile.                                                                                                              © ENEL

2017 was another historic year for   In fact, solar alone saw more new capacity deployed than fossil fuels and
the solar power sector. More solar   nuclear combined. Solar even added nearly twice as much capacity as its
PV capacities were installed         renewables peer, wind power (see fig. 1). Despite remarkable growth rates
globally than for any other power    in recent years, there is a long way to go for renewables – its total share
generation technology. In fact,      reached ‘only’ 12.1% of total global power output in 2017 (see fig. 2).
solar alone saw more new capacity
deployed than fossil fuels and
nuclear combined. Solar even         FIGURE 1 NET POWER GENERATING CAPACITY ADDED IN 2017
added nearly twice as much           BY MAIN TECHNOLOGY
capacity as its renewables peer,
wind power (see Fig. 1).                                                                    2017

                                         Other Res; 7 GW

                                     Large Hydro; 19 GW                                            Solar; 98 GW

                                          Nuclear; 11 GW

                                               Gas; 38 GW

                                              Coal; 35 GW

                                                                                                   Wind; 52 GW

                                     Source: Frankfurt School-UNEP Centre and BNEF (2018)                              © SOlaRPOWER EUROPE 2018

                                              Solar is the fastest
                                              growing power generation source

                                                                SolarPower Europe / GLOBAL MARkET OUTLOOk fOR SOLAR POWER 2018-2022 / 7
1 GlObal SOlaR MaRKET
               UPDATE 2000 - 2017                                  / CONTINUED

  FIGURE 2 RENEWABLE POWER GENERATION AND CAPACITY AS A SHARE OF GLOBAL POWER, 2007-2017

               70

                                                                                                                                             61%
               60                                                                                                                     57%

               50                                                                       49%                                   47%

                                                     42%                                                          41%
                                                                            40%                     39%
               40
                                                                32%
%

                                      27%
               30

                        20%
                                                                                                                                             19%
               20                                                                                                                     17.%
                                                                                                                             15.7%
                                                                                                                  14.3%
                                                                                                   13.0%
                                                                           11.4%       11.9%
                                                                10.2%
                                      8.2%          9.2%
               10      7.5%
                                                                                                                                             12.1%
                                                                                                                             10.0%   11.0%
                                                                                                    8.6%          9.2%
                                                                                        8.0%
                                                    5.9%        6.1%        6.9%
                       5.2%           5.3%
               0
                       2007           2008          2009        2010        2011        2012        2013          2014        2015    2016   2017

                                                             Renewable capacity change as a % of global capacity change (net)

                                                             Renewable power as a % of global capacity

                                                             Renewable power as a % of global power generation

  Source: Frankfurt School-UNEP Centre and BNEF (2018)                                                                                         © SOlaRPOWER EUROPE 2018

  The boost in solar is to a large extent a result of its                                     part of the 1.18 GW plant PPA in Abu Dhabi). Discussions
  spectacular cost development (see fig. 3). The record low                                   about sustainability of such low price levels became quickly
  solar prices that were achieved in 2016 had caught many                                     obsolete as the price spiral has continued its way
  energy experts by surprise. That year, bids awarded in several                              downwards. In february 2018, a 300 MW tender in Saudi
  tenders were below the 3 US cent per kWh level (2.95 US                                     Arabia was won by local company ACWA Power at a new
  cents for a 800 MW project in Dubai, 2.91 US cents for a power                              world record low price of 2.34 US cents/kWh, while the first
  supply contract in Chile, 2.42 US cents for the ‘winter’ supply                             seven shortlisted bids were all below 2.90 US cents/kWh.

  FIGURE 3 TOP 8 TECHNICAL BIDS FOR 300 MW SAKAKA PV PROJECT IN SAUDI ARABIA

               4

                                                                                                                                     3.37

                                                                                          2.78             2.86           2.86
               3
                                                                           2.77
                                                            2.66
                                             2.34
US cents/kWh

               2          1.79

               1

               0
                     Masdar/EDF            ACWA            Marubeni       Engie        JGC/Trina     Mitsui & Co.         Total      Cobra

                                                                                                                                               © SOlaRPOWER EUROPE 2018

  8 / SolarPower Europe / GLOBAL MARkET OUTLOOk fOR SOLAR POWER 2018-2022
This clearly indicates that solar in the lower 2 US cents                         both sides and come with the promise of 10-30% higher
  range is the new benchmark that needs to be met to win                            yields, depending on solar cell technology and location.
  tenders in the Middle East and other regions with ‘ideal’                         The market share of bifacial technology is expected to grow
  conditions – that is stable policy frameworks, very high                          from less than 5% in 2017 to nearly 40% by 2028, according
  irradiation and a top financing environment.                                      to the International Roadmap of Photovoltaic (ITRPV).
  In most emerging markets where the business                                       Bifacial modules and other technology improvements
  environment deviates from the ideal state, solar prices                           on the crystalline side will further improve solar’s cost
  will remain considerably higher. However, development                             advantage over other generation technologies. That’s
  financing institutions can help significantly to cover risks                      also true for the thin-film solar technology segment,
  on the financing side. The World Bank Group’s Scaling                             where First Solar just introduced its high energy yield
  Solar Programme has enabled a sub-5 US cents price for                            Gen6 module product.
  two projects in the 60 MW Senegal tender, which French
                                                                                    In the Levelized Cost of Energy (LCOE) Analysis – Version
  utility ENGIE and its investment partner Meridiam won
                                                                                    11.0, released in November 2017 by US investment bank
  for 3.80 and 3.95 Euro cents/kWh in April 2018.
                                                                                    Lazard, utility scale solar was again cheaper than nuclear
  Due to technical improvements, solar power cost and price                         and coal, and new combined cycle gas turbines (CCGT)
  will quickly continue to decrease. A foretaste was already                        (see Fig. 4). The lower the capital cost, the bigger is solar’s
  provided in the recent 300 MW Saudi tender, where the                             cost advantage, which is the reason why the solar power
  lowest bid of 1.79 US cents/kWh, which was later                                  purchase agreements (PPAs) signed in ‘stable’ countries
  disqualified, was reportedly based on bifacial module                             like the United Arab Emirates are lower than in many
  technology. Such solar modules can generate power on                              other emerging solar markets in Africa or Asia.

  FIGURE 4 SOLAR ELECTRICITY GENERATION COST IN COMPARISON WITH OTHER POWER SOURCES

                 350

                 300

                 250
LCOE (USD/MWh)

                 200

                 150

                 100

                 50

                  0
                          Residential PV   Commercial PV         Utility-scale PV           CCGT                   Coal            Nuclear

                                               Cost of Capital: 6% CoD, 10% CoE               Cost of Capital: 8% CoD, 14% CoE

  Source: Lazard (2017)                                                                                                            © SOLARPOWER EUROPE 2018

                                                                          SolarPower Europe / GLOBAL MARKET OUTLOOK FOR SOLAR POWER 2018-2022 / 9
1 GlObal SOlaR MaRKET
          UPDATE 2000 - 2017                           / CONTINUED

In 2017, a total of 99.1 GW of grid-connected solar was                        Chinese module producers again prioritized the
installed in 2017 (see fig. 5). That’s almost a 30% year-                      domestic market over demand from abroad.
on-year growth over the 76.6 GW added in 2016. This is
                                                                               Like the year before, the United States was the world’s
much lower than the 49% growth rate recorded in 2016,
                                                                               second largest PV market in 2017. It installed 10.6 GW,
but much higher than the expectations of any solar
                                                                               which falls 42% short of the record level of 15.1 GW
analysts. After the exceptionally strong growth in 2016,
                                                                               reached in 2016. While utility-scale solar remained the
most solar analysts had initially forecasted no growth
                                                                               largest segment, nearly the entire downturn stems from
at all. Our Medium Scenario, estimating a slight 5%
                                                                               that part. However, this decline was largely expected, as
growth rate to 80.5 GW was among the most optimistic
                                                                               many projects were finalized in 2016 to beat an
forecasts for 2018. The actual 99.1 GW installation figure
                                                                               expected expiration of the 30% federal Investment Tax
turned out be close to the upper end of our GMO 2017
                                                                               Credit (ITC), which did not materialize in the end. On top,
High Scenario estimate of 103.6 GW.
                                                                               several projects were shelved due to uncertainty
Global solar market demand in 2017 was dominated                               surrounding the Section 201 import tariffs.
more than ever by China. for the first time, China
                                                                               2017 has been a record year for PV in India. Cumulative
installed more than half of the world’s solar capacity in
                                                                               installed capacity exceeded 19 GW, with net yearly
one year – to be exact, 53.3%. This 52.8 GW of newly
                                                                               additions of 9.6 GW – a staggering 127% market growth
added capacity means a 53% increase over the 34.5 GW
                                                                               from last year’s 4.3 GW. Growth could have been even
installed in 2016, when the Chinese market grew by
                                                                               stronger, if it were not for price hikes of modules from China
128% compared to the 15.1 GW deployed in 2015. While
                                                                               over the course of the year, a lagging rooftop segment and
the huge growth in 2017 stunned almost everyone, in
                                                                               uncertainty regarding import taxes. However, in 2017 solar
hindsight, the explanation is very simple: China’s feed
                                                                               was the largest source of new capacity additions,
in tariff program was basically un-capped, the tariff
                                                                               constituting 45% of new added capacity. India took
levels for solar power plants were higher than in most
                                                                               Japan’s place as the third largest market worldwide and is
other places in the world, and companies wanted to
                                                                               on trajectory to become #2 in 2018.
beat upcoming scheduled subsidy cuts. That’s why

FIGURE 5 EVOLUTION OF GLOBAL ANNUAL SOLAR PV INSTALLED CAPACITY 2000-2017

                                                                                                                                                    99.1
        100

          90

          80

          70

          60
GW

          50

          40

          30

          20

          10

           0
                    2000   2001   2002   2003   2004   2005   2006   2007    2008   2009   2010     2011   2012   2013   2014   2015      2016      2017

                             EUROPE               AMERICA                   CHINA                 APAC*              MEA                     RoW

*APAC excl. China                                                                                                                      © SOlaRPOWER EUROPE 2018

10 / SolarPower Europe / GLOBAL MARkET OUTLOOk fOR SOLAR POWER 2018-2022
The Japanese market continued its downturn, adding The Middle East region not only made headlines with
7.2 GW in 2017, which is 9% less than the 7.9 GW record-low tariff solar tariffs, there were also new
installed the year before. The solar market is in the countries joining the local ‘solar tenders club.’ Next to
middle of a transition from its lucrative FIT scheme to Saudi Arabia, also Oman started to tender its first solar
auctions and self-consumption. But with a huge FIT capacity, while the region’s PV pioneers Abu Dhabi and
pipeline waiting for installation, the 490 MW AC capacity Dubai have continued on their solar path. The biggest
companies bid for was lower than the 500 MW on offer. solar country in the region in 2017 was the United Arab
In the end, only 141 MW AC was awarded. The Japanese Emirates, adding 262 MW.
PV Energy Association (JPEA) expect the country’s solar
The biggest surprise in 2017 in Africa took place in the
downturn to continue until 2024, before market design
continent’s north – in Egypt. Although the actual
and infrastructure will be ready for further growth.
installation volume was still below 100 MW, after
Unlike Japan, Europe has left its several-year long changes for its FIT progamme and delays, the first PV
downward trend in 2017, adding 9.2 GW, a 30% increase power plant was installed. Egypt managed to win back
compared to the 7 GW installed the year before. The confidence with the financial sector, with many banks
European growth is primarily a result of Turkey’s gigantic now having given green light to support multiple
growth, adding 2.6 GW, from less than 1 GW in 2016. projects for the 1.8 GW Benban Solar Park. As in the past,
When looking at the 28 members of the European the continent’s largest market was South Africa. But at
Union, there was hardly any growth at all: the EU-28 172 MW, it was much smaller than in the prior years, due
added only 5.91 GW in 2017, compared to 5.89 GW in to the solar pipeline logjam caused by national utility
2016. This result still stems from the UK’s ‘solar exit’ in Eskom, which refused to sign PPAs with the winners of
2016, which again halved new installations in 2017. Even the latest RE programme bidding rounds. That has been
though 21 of the 28 EU markets showed growth, this solved in the meantime – and even a new bidding round
wasn’t enough to compensate for the British losses. was announced. However, the low cost of solar is
attracting many African countries to look into on-grid
Beyond Asia’s solar leaders China, Japan and India, the
solar as well. As financing is often an issue, the World
region counts several fast growing solar markets, but
Bank Group has established the Scaling Solar Program,
only one other Asian country, South Korea, exceeded
which started in Zambia in 2017 and is quickly
the gigawatt-level in 2017.
progressing and expanding in African countries. In 2017,
In Latin America, in particular Brazil stood out in 2017, in Zambia a second round was launched, Ethiopia
which for the first time installed over 1 GW of solar, announced two tenders for 125 MW each, Madagascar
mostly from systems awarded in auctions. The region’s issued a tender for a solar plus storage system last year,
No. 2 is Chile, where the market slightly decreased by and Senegal tendered 100 MW capacity.
4% to 788 MW. While Mexico grew by 39% to 539 GW, the
In brief, in 2017, solar was even more dominated by
bulk of systems awarded in recent auctions are being
China than ever. But the low cost of solar has been
grid-connected as of this year. Also Latin America is
attracting many countries to look seriously into this
seeing emerging solar markets, like Colombia, which
unique flexible and distributed clean power technology.
installed its first PV power plant in 2017.
While in 2016, only seven countries installed over 1 GW,
After Australia dropped by 15% to 867 MW in 2016, it has in 2017, the number has increased to nine. Details on
shown a strong come back in 2017, when it exceeded the leading solar markets can be found in Chapter 2,
the 1 GW level of new PV additions. The 1.3 GW installed which provides overviews on those nine countries
capacity, mostly stems from residential self- that installed more than 1 GW in 2017 (see p. 47).
consumption systems. With solar LCOE’s now being
increasingly competitive, commercial and ground-
mounted systems are seeing huge interest. While
commercial installations covered around 30% of the
demand in 2017, the ground-mounting segment is
starting as well – around 80 MW was installed – and is
excepted to strongly grow in the next few years.
SolarPower Europe / GLOBAL MARKET OUTLOOK FOR SOLAR POWER 2018-2022 / 111 GlObal SOlaR MaRKET
UPDATE 2000 - 2017 / CONTINUED
FIGURE 6 EVOLUTION OF GLOBAL TOTAL SOLAR PV INSTALLED CAPACITY 2000-2017
450
404.5
400
350
300
250
GW
200
150
100
50
0
2000 2001 2002 2003 2004 2005 2006 2007 2008 2009 2010 2011 2012 2013 2014 2015 2016 2017
EUROPE AMERICA CHINA APAC* MEA RoW
*APAC excl. China © SOlaRPOWER EUROPE 2018
In 2017, almost as much solar was installed in one in 2016, it now even owns more than half of the global
year (99.1 GW) as the world had installed in total in power generation capacity. The European solar
2012 (100.9 GW). This led to a total global solar power pioneers are still ranked second, but its share slipped to
capacity of over 400 GW in 2017, after solar exceeded 28% based on a cumulative PV capacity of 114 GW. The
the 300 GW mark in 2016 and the 200 GW level in 2015. American Continent remained on the third position –
with a total installed capacity of 59.2 GW and a 15%
The cumulative installed solar PV power capacity grew
stake. The Middle East and Africa lost again market
by 32% to 404.5 GW by the end of 2017, up from 306.4
share. After adding 2.1 GW in 2017, the total solar
GW in 2016 (see fig. 6). In only 10 years, the world’s total
capacity of 6.9 GW equals a world market share of 1.7%.
PV capacity increased by over 4,300% – from 9.2 GW in
2007. from the beginning of the century, when the grid- China alone operates now nearly 1/3 of the world’s solar
connected solar era began with the start of Germany’s power generation capacities (see fig. 8). This 32.3% is a
feed-in tariff scheme, total solar power has grown by strong uptick from 2016, when China’s share was 25% and
nearly 255 times. it had taken over the No. 1 position as the country hosting
the world’s largest solar power generation fleet for the first
The Asia-Pacific region expanded its solar market
time. Like in the previous year, China was trailed by the
leadership in 2017. After adding 73.7 GW in 2017, it had
US and Japan. While the US overtook Japan, both lost
221,3 GW of total installed capacity, equal to a 55%
market shares in 2017. The US’ total installed capacity
global market share (see fig. 7). After Asia-Pacific had
reached 51.5 GW, equal to a market share of 12.7%;
become the largest solar-powered region in the world
solar global market
30% growth
Now at 100 GW a year
12 / SolarPower Europe / GLOBAL MARkET OUTLOOk fOR SOLAR POWER 2018-2022FIGURE 7 EVOLUTION OF TOTAL INSTALLED GLOBAL SOLAR PV CAPACITY 2012-2017
100
90
80
70
60
%
50
40
30
20
10
0
2012 2013 2014 2015 2016 2017
EUROPE AMERICA APAC MEA RoW
© SOlaRPOWER EUROPE 2018
FIGURE 8 GLOBAL TOP 10 SOLAR PV MARKETS TOTAL INSTALLED SHARES BY END OF 2017
Rest of World; 14%
Spain; 1% China; 32%
France; 2%
United Kingdom; 3%
Italy; 5%
Germany; 11%
Japan; 12%
USA; 13%
India; 5%
Australia; 2%
© SOlaRPOWER EUROPE 2018
Japan’s 49.3 GW resulted in a 12.2% global share, level is India, which doubled its total PV capacity in 2017
compared to 14% and 13.8% in 2016, respectively. In to 19 GW and a 4.7% market share.
2017, again no European country was among the top 3
The further two countries with solar capacities
solar power generating countries. Though Germany
exceeding 10 GW at the end of 2017 were again Italy at
could defend its fourth rank as the only other country
19.4 GW and the Uk at 12.7 GW. All other countries in the
with a two-digit global share, its comparatively low 2017
top 10 have installed volumes that are somewhat
installations of 1.8 GW mean a drop in market share down
distant from the 10 GW mark – france (8 GW), Australia
to 10.6%, from 13.4% in 2016. The new addition in the top
(7.3 GW) and Spain (5.6 GW) – and are unlikely to reach
5 and first time above the 10 GW solar generation capacity
that level in 2018, according to our estimates.
SolarPower Europe / GLOBAL MARkET OUTLOOk fOR SOLAR POWER 2018-2022 / 1314 / SolarPower Europe / GLOBAL MARkET OUTLOOk fOR SOLAR POWER 2018-2022
1 GlObal SOlaR MaRKET
     PROSPECTS 2018 - 2022

In mid-May, all solar analysts were expecting further market                resulting from the China rush, the anticipated price drops
growth in 2018, even in their conservative scenarios. This                  following NEA’s solar program ‘restructuring’
changed abruptly after China’s National Energy                              announcement could trigger installation of much bigger
Administration (NEA) pulled the brake in early June,                        project volumes than planned to be built this year.
announcing strong subsidy cuts to slow down domestic
                                                                            In any case, China’s market size will define global solar
solar demand that had been much larger than originally
                                                                            deployment in 2018. However, after the world’s largest
planned in 2016 and 2017. While several solar experts were
                                                                            solar market registered 22% YoY growth in Q1/2018,
quick to revise their forecasts from strong growth in 2018
                                                                            installing 9.65 GW compared to 7.1 GW in Q1/2017 and
to no growth at all, we still see a high probability for further
                                                                            the lowest bid in the latest auction-based Top Runner
global solar market expansion in 2018.
                                                                            Programme round reaching 0.31 RMB compared to
Our Medium Scenario expects about 102.6 GW new PV                           much higher fIT levels ranging from 0.55 to 0.75 RMB,
capacity additions in 2018 (see fig 9). That would                          the Chinese administration’s reacted quickly. On June
represent a 3.5% market growth compared to the 99.1 GW                      1, it announced a restructuring of its solar incentive
installed in 2017. The Low Scenario, which models major                     program, which includes an immediate halt of further
markets to withdraw their solar support, assumes a drop                     utility-scale power plant installations for the reminder
in demand as low as 72.6 GW, that’s basically the 2016                      of the year, a status change for full fIT distributed power
level. This outcome is very improbable, when taking into                    generation systems, which are now reimbursed at the
account preliminary installation numbers for the first                      same levels as utility-scale power plants, and an fIT cut.
quarter in leading markets. The High Scenario, forecasting                  However, our Medium Scenario assumes that the
up to 129.2 GW of newly installed PV in 2018, this time                     market will be still 39 GW, which would be a 26%
appears extremely optimistic, but we already said that in                   decrease over 2017, but a 13% YoY growth compared to
the last GMO, and then it came true. It is too early to say                 2016. The simple rationale: China is a very large country
how the market will develop in the second half – in China                   with many administrational layers – and it will take a
and the rest of the world. But price elasticity could play a                while until the message from Beijing will be heard
big role this year to take up some of the capacities                        everywhere, let aside that regions have their own
originally destined for China. While several projects were                  agenda when it comes to supporting local players and
delayed in 2017 due to scarcity of low cost modules                         jobs. Moreover, the Poverty Alleviation Programme

FIGURE 9 WORLD ANNUAL SOLAR PV MARKET SCENARIOS 2018 - 2022

     250
                                                                                                             232.6

     200

                                                                                                           12%
     150
                                                                                                  12%
                                                                          129.2
GW

                                                                                         17%

                                                              99.1   3%
                                                                                 5%
                                                                                                            100.6
     100

                                                                       72.6

     50

      0
              2011   2012      2013    2014    2015    2016   2017        2018    2019     2020     2021     2022

                     Historical data          Low Scenario           High Scenario             Medium Scenario

                                                                                                                        © SOlaRPOWER EUROPE 2018

                                                               SolarPower Europe / GLOBAL MARkET OUTLOOk fOR SOLAR POWER 2018-2022 / 15
1 GlObal SOlaR MaRKET
PROSPECTS 2018 - 2022 / CONTINUED
continues untouched and local support for rooftop solar of bilateral PPA-based systems. In our Medium Scenario,
has triggered strong demand, which could result in we expect China to significantly increase its solar
several GW this year. demand again to around 40 GW in 2020, 45 GW in 2021
and 55 GW in 2022. These numbers are much higher
In the US, our medium scenario expects the market to
than the targets formulated in the early 2017 published
decrease slightly to 10.1 GW in 2018, taking into account
Photovoltaic Industry Roadmap of the China PV
the impact of tariffs on system pricing from import tariffs
Industry Association (CPIA), which was looking for 10-20
and the impacts of the corporate tax reform on
GW additions between 2018 and 2020 and 20-30 GW in
customers, developers and financing institutions.
2022. But the new tools to command incentive schemes
However, according to SEIA almost two thirds of the
on the one hand, and solar combined with storage
2018 utility PV pipeline consist of relatively less-price-
being the cheapest flexible solution to reduce CO2
sensitive renewable portfolio standard projects, while
emissions and fight air pollution on the other hand, will
projects currently in construction have already secured
boost solar in China again.
tariff-free modules, so that import tariff impacts will be
somewhat mitigated that year. Despite China’s anticipated next strong growth cycle for
the 2020-2022 period, the rest of the world will continue
India officially targets 11 GW, including 10 GW ground-
to play a stronger role in the solar sector. While the US
mount and 1 GW rooftop systems, for its fiscal year 2018-
is expected to win on speed post 2020, seeing double
19, which will end in March 2019. After the steep
digit-growth rates, due in 2023, Europe might see an
year-over-year 2017 growth, India is expected to take a
opposite development. After a strong growth phase
breath in 2018. SolarPower Europe’s medium scenario
triggered by tenders in a number of countries to meet
expects slight growth to 10.5 GW of newly installed
the EU national binding targets in 2020, unambitious
capacity in calendar year 2018. The current project
final agreements for the ‘Clean Energy for All
pipeline is lower, after fewer tenders were issued in the
Europeans’ Legislative Package might lead to another
past year. Moreover, the first months of 2018, were
standstill for solar in the EU post 2020, which will impact
governed by uncertainty stemming from a discussion
global growth rates during that period of time (see
on a 70% safeguard tax on imported solar cells,
chapter 3). However, our Medium Scenario assumes
although this seems off the table for now. On the other
global demand to increase 17% to 125.2 GW in 2020,
hand, India’s Ministry of New and Renewable Energy
12% to 140.4 GW in 2021 and 12% to 157.8 GW in 2022.
(MNRE) laid out its roadmap for future tenders to boost
If the leading and most promising emerging market are
demand, announcing end of last year, to tender 20 GW
able to change energy market design to the needs of
in fY 2017/18 and 30 GW each in fY 2018/19 and fY
flexible renewables, and electrification of transport and
2090/20, which explains the very high tender activity
heat sector speeds up, the High Scenario assumptions
over the first months of 2018.
could come true, resulting in an annual market size of
In both Europe and the EU, we anticipate strong growth up to 232.6 GW in 2022.
for 2018. While demand in the EU will be driven by the
national binding 2020 renewables targets and low
prices, the non-EU part of Europe will be propelled by Over
Turkey’s solar program and solar’s attractive costs (for
details, see Chapter 3).
However, in our Medium Scenario, we see the number
of solar GW-level markets to increase by nearly 50% to
1 TW
solar power by 2022
14 in 2018 and with new solar markets emerging, further
global growth is possible this year.
As of 2020, the global solar market is expected to show
again 2-digit growth rates. By then China will have fully
restructured its solar market, which will enable the
administration to have much better control of solar
deployment through low-cost auctions and capped
incentive schemes. There will be also a notable volume
16 / SolarPower Europe / GLOBAL MARkET OUTLOOk fOR SOLAR POWER 2018-2022FIGURE 10 WORLD TOTAL SOLAR PV MARKET SCENARIOS 2018 - 2022
1,400
1,270.5
1,200
1,000
18%
800
19% 813.3
GW
20%
600 531.3
25% 21%
404.5
400 475.8
200
0
2011 2012 2013 2014 2015 2016 2017 2018 2019 2020 2021 2022
Historical data Low Scenario High Scenario Medium Scenario
© SOLARPOWER EUROPE 2018
Again, all Global Market Outlook 2018 scenarios show Although solar is increasingly becoming the lowest cost
stronger growth than in the previous GMO edition. In power generation source in many regions, it needs a
2017, we assumed a cumulative installed capacity of level playing field with the right market design to
471.2 GW for the Medium Scenario in 2018, this year we unleash its cost and technical advantages over inflexible
estimate 505.2 GW, which is about 7% higher (see Fig. power plants. Today, many barriers are still in the way
10). The final year of the 5-year forecast in the GMO 2017, for solar to tap its potential: Functioning emissions
ranged between 623.2 and 935.5 GW with the most likely trading schemes for fossil fuels are usually missing, like
Medium Scenario resulting in 772.1 GW of cumulative in the EU; investments and operation of inflexible
operating solar power in 2021. In the GMO 2018, we centralized power generation technology are often still
anticipate a range between 714.6 and 1,042.1 GW, with being strongly over-subsidized, like the UK’s Hinkley C
871.3 GW forecasted for the most likely scenario in 2021 nuclear plant; while self-consumed solar power is being
– that’s about 13% higher. inappropriately high taxed, like in Germany.
Under optimal conditions, the world’s solar The solar sector’s dependency on few markets is another
generation plant capacity could reach up to 1,270.5 issue that needs to be addressed: In 2017, only one
GW by the end of 2022, but we consider 1,026.2 GW country, China, was responsible for over half of global
more likely. Still, that means solar would reach the demand; the top 3 solar markets (China, US, India) even
terawatt production capacity level in 2022. covered 74%. As we mentioned last year, it “needs only
one major market making the wrong policy decisions to
Reaching the 400 MW milestone already in 2017, we now
disrupt the entire solar sector.” There is a reason why the
expect in our Medium Scenarios the total global installed
solar sector is reacting very nervous on China’s
PV capacity to exceed 500 GW in 2018, 600 GW in 2019,
announcement to restructure its solar incentive program.
700 GW in 2020, 800 GW in 2021 and 1 TW in 2022.
When taking all these risks into consideration, our Low
Scenario assumes a very unlikely development that results
in an annual global market of only 100.6 GW in 2022, which
would mean stagnation compared to 2017 additions.
SolarPower Europe / GLObAL MArKET OUTLOOK FOr SOLAr pOWEr 2018-2022 / 171 GlObal SOlaR MaRKET
PROSPECTS 2018 - 2022 / CONTINUED
Whatever the Chinese solar market development will for the future than in our previous GMO. In 2017, the
look like in the next five years and whether global Asia-Pacific region is assumed to absorb around two
growth follows our Low Scenario or the High Scenario, thirds of total installations and remain in the upper 50%
Asia will continue to dominate the solar sector in the to mid 60% range until 2022.
near future (see fig. 11). We expect even higher shares
FIGURE 11 EVOLUTION OF GLOBAL ANNUAL SOLAR PV MARKET SHARES FOR HIGH AND LOW SCENARIOS UNTIL 2022
250
200
150
GW
100
50
0
Historical High Low High Low High Low High Low High Low
2017 2018 2019 2020 2021 2022
EUROPE AMERICA APAC MEA RoW
% 2017 2018 2018 2019 2019 2020 2020 2021 2021 2022 2022
Historical High Low High Low High Low High Low High Low
Europe 9.18 13.69 11.22 20.80 14.42 18.31 12.27 18.17 11.81 16.79 11.72
America 22.02 15.99 15.90 15.38 18.17 14.75 17.34 14.24 16.32 13.86 14.92
APAC 66.47 64.74 68.03 56.62 61.22 59.38 62.96 58.31 64.04 58.94 65.22
MEA 2.20 5.59 4.85 7.21 6.19 7.56 7.43 9.28 7.83 10.40 8.14
RoW 0.13 0 0 0 0 0 0 0 0 0 0
© SOlaRPOWER EUROPE 2018
18 / SolarPower Europe / GLOBAL MARkET OUTLOOk fOR SOLAR POWER 2018-20221 GlObal SOlaR MaRKET
PROSPECTS 2018 - 2022 / CONTINUED
for the Top 20 global solar markets, the outlook is more The Top 5 markets are expected to add 532.9 GW until
optimistic, the installation volumes are much larger over 2022 in the High Scenario and 267.8 GW in the Low
the next five years (see fig. 12). However, the pattern Scenario. In comparison, the Top 20 are supposed to
remains similar: few countries will install the bulk of all install 729.2 GW until 2022 in the High Scenario and
solar system capacity, though diversity is growing. This 350.6 GW in the Low Scenario. That’s 224.6 GW and 87.3
time, we expect for the High Scenarios two countries to GW more than the 5-year assumption in the GMO 2017
install over 100 GW – China and India (last year it was edition, respectively.
only China) – and eight countries to add at least 20 GW
- China, India, USA, Japan, Spain, Germany, Australia,
Mexico (last year it was only four).
FIGURE 12 TOP 20 MARKETS’ SOLAR PV ADDITIONS FOR HIGH AND LOW SCENARIOS 2018 - 2022
China 283.1
147.8
India 105.0
53.1
USA 75.8
44.5
Japan 38.4
19.7
Germany 26.2
11.7
Australia 21.3
10.7
Mexico 20.0
7.9
Turkey 13.2
7.6
France 17.6
6.9
South Korea 12.0
6.0
Netherlands 13.1
5.0
Egypt 17.5
4.7
Taiwan 8.9
4.6
Brazil 9.3
4.3
Spain 30.6
High Scenario
4.3
Italy 12.5
3.5
Low Scenario
Saudi Arabia 8.8
2.8
Thailand 5.7
2.2
Chile 5.3
1.9
United Kingdom 4.9
1.0
0 50 100 150 200 250 300
GW
© SOlaRPOWER EUROPE 2018
20 / SolarPower Europe / GLOBAL MARkET OUTLOOk fOR SOLAR POWER 2018-2022The prospects for the largest global PV markets will be solar plans, the Trump administration is not considered
overall very good over the coming years. Most of the Top solar-friendly at all. However, the US federal government’s
20 markets will likely see two-digit compound annual negative stimulus is countered by positive developments
growth rates until 2022; two countries are supposed to in many states. Japan is expected to add 29.3 GW until
grow even over 100% (Egypt, Saudi Arabia). 2022, which would make it the fourth largest solar market
over the next five years. Still, unlike for any other country
Despite China’s sudden announcement to cut subsidies,
on this list, annual demand is likely to decrease
there is no doubt that its government will continue to
constantly as the country works on fixing its costly solar
strongly support solar over the coming years. This is
incentive scheme and infrastructure. The Uk is the
about a transition from way too high fITs to more cost-
slowest growing market among the Top 20, expected to
effective support mechanisms. China is expected to add
add only 2.1 GW until 2022. So except for the Uk, the
209 GW in our Medium Scenario, followed by India with
prospects for the leading solar markets are expected to
78.4 GW, and the US with 62.6 GW. While India’s Prime
be mostly sunny over the next few years.
Minister Modi is the master mind behind India’s ambitious
FIGURE 13 TOP GLOBAL SOLAR PV MARKETS’ PROSPECTS
2017 2022 2018 - 2022 2018 - 2022
Total Capacity Total Capacity Medium New Capacity Compound Annual Political support
(MW) Scenario by 2022 (MW) (MW) Growth Rate (%) prospects
China 130,751 339,751 209,000 21%
United States 51,527 114,170 62,643 17%
India 19,047 97,431 78,384 39%
Japan 49,251 78,551 29,300 10%
Germany 42,973 63,237 20,264 8%
Italy 19,392 26,924 7,533 7%
Australia 7,308 22,969 15,662 26%
France 7,999 19,702 11,703 20%
Mexico 1,174 15,252 14,078 67%
United Kingdom 12,676 14,742 2,065 3%
South Korea 5,480 14,497 9,017 21%
Spain 5,627 14,460 8,833 21%
Turkey 3,420 14,320 10,900 33%
Egypt 80 11,750 11,670 171%
Netherlands 2,681 11,430 8,750 34%
Brazil 1,147 8,442 7,295 49%
Taiwan 1,733 8,386 6,653 37%
Saudi Arabia 19 7,070 7,051 227%
Thailand 2,697 6,159 3,462 18%
Pakistan 894 5,787 4,892 45%
SolarPower Europe / GLOBAL MARkET OUTLOOk fOR SOLAR POWER 2018-2022 / 211 GlObal SOlaR MaRKET
PROSPECTS 2018 - 2022 / SEGMENTS
Ground-mounted utility scale solar power systems a lot of effort to educate consumers, while setting up an
continue to clearly dominate the solar space – and this effective platform with the right financing mechanisms
won’t change much for the next five years. In 2017, the and technical standards. That’s why emerging markets
large-scale ground-mounted segment increased its usually begin their solar chapter with tenders for utility-
shares along with the top markets expanding their scale solar and frequently struggle to set up the
global footprints. The growth of the major solar distributed rooftop segment, even if politicians generally
markets is primarily based on ground-mounted PV prefer PV on roofs which they consider the natural place
power, even though there are efforts to foster the for the technology as it avoids any potential conflicts on
rooftop segment as well. With electric vehicles and land use. A good example for such a development is
smart cities making stronger inroads after 2020, there India. Its National Solar Mission officially targets 100 GW
is a lot of upside potential. of solar by 2022, with 40 GW coming from rooftop solar.
But of the 19 GW installed by end of 2017, only 1 to 2 GW
China not only strongly expanded its output to 52.8 GW
are ground-mounted PV power plants.
in 2017 from 34.5 GW in 2016, but also its global market
share to 53% from 45%. Its total installed capacity even Even in developed solar markets in Europe, the recent
increased to over 130 GW of which around 100.6 GW are trend to tenders is triggering a new wave of ground-
utility scale plants. The other around 29.7 GW are what mounted PV power plants that will be installed in Spain,
China calls distributed solar systems (now < 30 MW, earlier for example. The low cost of solar enabling the beginningTRENDS
WHaT’S HOT IN SOlaR
10 TRENDS THAT WILL SHAPE THE SOLAR POWER SECTOR
IN THE COMING YEARS
© SMA
Solar is ready to roll: In many SolarPower Europe has looked at 10 Topics & Trends that support the
countries it is the lowest cost power dissemination of solar power and outlines both the challenges and solutions.
option today – both in residential This chapter is mostly based on the work of different Task forces of
and commercial applications, but SolarPower Europe, where we co-operate closely with our members on
also increasingly in the utility-scale business models and policy recommendations in the fields of Solar & Storage,
field, even if external costs are not Digitalisation, O&M or Corporate Sourcing to enable sector coupled Smart
added to fossil fuels and nuclear Cities as well as emerging countries to be powered smoothly by solar and
power. Still, solar power’s share is other renewables.
in most markets less than 5%.
While decarbonisation through
electrification of heat, transport
and power sectors offer huge solar
1 Small is beautiful: small-scale installations and the European
business opportunities, many
energy transition
obstacles need to be overcome.
2 Solar smart cities: a great match
3 Solar mobility: choosing solar for the driver’s seat
4 Solar & storage: unleashing the potential for the perfect partner
5 Sustainability & environmental footprint: taking care –
solar generating truly green power
6 O&M: long-term high solar system performance with a little
help from a friend
7 Solar PPAs: increasing leadership from private sector looking
for green procurement
8 Tenders: controlling solar growth & cost
9 Solar in emerging markets: so much untapped potential
10 Technology update: how to cut cost even further
SolarPower Europe / GLOBAL MARkET OUTLOOk fOR SOLAR POWER 2018-2022 / 23TRENDS WHaT’S HOT IN SOlaR / CONTINUED
1. SMall IS bEaUTIFUl: SMall-ScalE economic potential in a smarter and cleaner energy
INSTallaTIONS aND THE EUROPEaN ENERGY system. In the European Union, a global pioneer in
TRaNSITION rooftop solar, the Clean Energy for All Europeans
package, a set of legislative proposals currently in the
Solar is quickly becoming the cheapest source of
final discussion stages in Brussels, could make the
electricity, outcompeting conventional power
difference, but political leadership is lacking.
generation plants in several parts of the world. But it will
only reach its full potential in a real decentralized energy What is at risk? No less than the EU missing on the
system that enables integration of major shares of “renewable industrial revolution”, a more complex yet
variable sources of electricity and recognizes much smarter energy system, building on the synergies
appropriately the benefits of small scale, clean and local provided by digital solar & storage to penetrate all
solar installations. These solar rooftop systems can sectors of the economy (sector coupling). from local to
compete on retail price with grid power at most places national level, small-scale solar is already today capable
in the world; still only few countries, like Australia, have of reducing significantly CO2 emissions, provide cheap
been truly tapping this attractive solar solution. and controllable energy and flexibility sources, and
generate new business opportunities – if political
Small solar systems are the backbone of a digitalized,
framework conditions are set appropriately.
decarbonized, distributed and democratized energy
system (4D), which empowers consumers and territories
(e.g. households, hospitals, public buildings, hotels, etc.) What’s Next?
with cleaner, cheaper and local electricity. They have
The epilogue for small-scale installations in the
the potential to support the competitiveness of local
European Union isn’t so far away, as negotiations
businesses, revive rural areas and foster sector-coupling
between European institutions and national
synergies at all levels of society. Last but not least, small-
governments could be finalized by the end of 2018, with
scale solar provides three times more jobs than ground-
the enactment of a new EU legislation beginning 2019.
mounted installations, as shown by the “Solar Jobs
Some of the following challenges remain crucial to
Study”, published by SolarPower Europe and Ernst &
ensuring a cost-efficient transition towards a cleaner
Young (EY) in November 2017.
and more decentralized electricity system that will
Today, there is no level playing field for small solar unlock the economic and social potential of small-scale
players in the energy world. Many obstacles hinder solar installations:
investors in rooftop solar solutions to reach their full
The most validated
satellite-based
solar irradiation data source
solardata.3e.eu
24 / SolarPower Europe / GLOBAL MARkET OUTLOOk fOR SOLAR POWER 2018-2022• Markets “Fit-for-RES”: More liquid and short-term • Empowering renewable prosumers in Europe: Self-
markets are needed to create a level-playing field consumption drives technological developments
between smaller and bigger power generators in which provide European companies with the
Europe and integrate the participation of new opportunity to maintain global industrial leadership.
players through storage and aggregation services. future business models will emerge from the
The implementation of markets fit for PV increasing penetration of small-scale renewables in
installations below 500 kW will be a crucial feature all sectors of the economy: on-site generation
to develop new solar business models. combined with storage, digitalisation and home
automation appliances will guarantee direct
• Creating a regulatory framework that truly
renewable supply to key sectors of the economy
incentivises small-scale PV installations: Small-
such as electro-mobility, or zero-emission buildings.
scale solar represents a significant opportunity for
Such installations will also procure valuable services
Europe in terms of economic and employment
to the electricity grids, setting the stage for the
benefits – and could provide 150,000 jobs in 2021,
uptake of new services for energy supply and
according to SolarPower Europe’s Solar Jobs study
aggregation. Renewable prosumers should
2017. Until a level-playing field is met between
therefore be incentivized and not be exposed to
smaller and bigger power generation players, small-
disproportionate levies and charges, as it is the case
scale solar producers need to be exempted from
if some EU countries.
disproportionate financial and administrative
burdens, such as bidding on the market (removal of • A flexibility Roadmap for European Electricity
priority dispatch) balancing responsibilities. markets: All potential sources of flexibility should
be optimized to transition towards a cleaner and
more decentralized energy system. An adequate
TRENDS FIGURE 1 DIRECT AND INDIRECT JOBS flexibility roadmap would enact the phasing out of
SUPPORTED BY THE PV INDUSTRY IN EU28, BY MARKET the most inflexible and polluting generation
SEGMENT (ROOFTOP AND GROUND-MOUNTED) capacities, foster the penetration of key enabling
350,000
technologies (digitalisation, storage, electrical
vehicles), and encourage transparency and
300,000 competition for the uptake of new service providers
(aggregation, prosumers).
250,000
• Restrict the use of capacity remuneration
mechanisms (CRM): Subsidizing inflexible
Jobs (FTE)
200,000
conventional capacities through capacity markets will
150,000
increase the cost of the energy transition and hinder
the uptake of more decentralized and flexible
100,000 solutions, such as small-scale renewables and
storage. The addition of a carbon criteria, excluding
50,000 the worst environmental performers from capacity
mechanisms, remains a crucial feature of the debate.
0
2008 2016 2021
Rooftop Ground-mounted
© SOlaRPOWER EUROPE 2017
SolarPower Europe / GLOBAL MARkET OUTLOOk fOR SOLAR POWER 2018-2022 / 25TRENDS WHaT’S HOT IN SOlaR / CONTINUED
2. SOlaR SMaRT cITIES: a GREaT MaTcH • first, solar is the most agile renewable technology.
It is heavily decentralized and can basically be
Smart Cities are becoming a major trend in Europe and
added to or integrated into each component of a
beyond. In Europe, the Covenant of Mayors, a European
sustainable urban area: carports, solar-powered
initiative to promote innovative energy transition in cities
urban lighting, solar-powered charging points, large
now gathers more than 7,755 European cities, covering
buildings to single houses or sound barriers. Name
around 250 million inhabitants. Worldwide, more than
it – solar offers a solution. Its ability to be installed
9,000 cities have joined the Global Covenant of Mayors.
very close to consumption points also avoids
Today cities are responsible for around 75% of global significant grid losses. This also includes large-scale
energy consumption and 80% of greenhouse emissions. distributed solar power plants to provide electricity
Urban areas will also face some of the most significant for community solar solutions, for example.
impacts of rising GHG emissions and air pollution,
• Then, solar is also already smart and quickly getting
bearing much of the costs for adaptation and mitigation.
smarter. While digital solar & storage business
for the future, cities want to increasingly become smart, models are taking off for residential and commercial
clean, sustainable - and solar appears as the perfect consumers, smart building technologies reveal their
match to make this happen. potential to optimise self-consumption rates of the
building stock and smoothen grid feed-in, which
enables a cleaner yet reliable electricity supply.
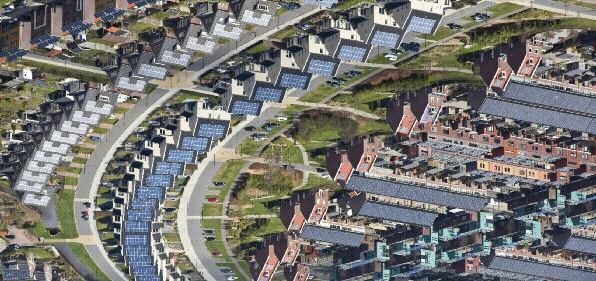
A REAL SMART CITY MAKES USE OF SOLAR’S DISTRIBUTED AND FLExIBLE NATURE BASICALLY ALMOST EVERYWHERE
© DlR, cc-bY 3.0
26 / SolarPower Europe / GLOBAL MARkET OUTLOOk fOR SOLAR POWER 2018-2022What’s Next? 3. SOlaR MObIlITY: cHOOSING SOlaR
FOR THE DRIVER’S SEaT
According to the EU Covenant of Mayors, cities could be
ready for creative actions when it comes to reducing Electro-mobility is a quickly emerging global trend that will
their CO2 emissions – if they have the will. Computed open a world of new and exciting opportunities for solar.
action plans show that over 49% of actions would be
The business case is strong as transport constitutes
covering the buildings sector, while 20% would be
today around 1/3 of Europe’s CO2 emissions. Together
devoted to increase local energy production and 23%
with heating, it is the most emitting sector beyond the
for transport to develop cleaner transports. This all plays
power sector itself, where the road towards renewables
into the hands of solar.
has been already paved unlike in transport. With the
• Solar urban mobility: While solar mobility business world now starting to engage seriously in e-mobility, it
models are kicking off (see p. 27), solar will be is key to ensure these increasing electricity volumes will
particularly relevant to cover electrical consumption be satisfied by additional renewable capacities.
of low distance vehicles. This is a good thing, as cities
2016 forecasts published by the European Environment
plan to increase significantly their share of electric
Agency suggest that Europe’s total electricity
public transport and shared vehicles for their
consumption by electric vehicles will increase from
constituents. Solar again appears like a perfect match.
approximately 0.03 % in 2014 to 9.5 % in 2050. With EVs
• Solar smart buildings: The modularity and share supposed to grow much faster, it is crucial to add
versatility of building integrated solar solutions green power supply capacities quickly as well.
constitute a great chance for cities aiming at
The Solar Mobility case is striking, when looking at
preserving their architectural identity, yet leading by
sector coupling – solar is the perfect answer to
example by developing not only passive but energy
electrification of transport.
positive buildings. Covering all untapped building
facades and rooftops spaces with solar could The ‘Residential Prosumers in the European Energy
definitely help decarbonise Europe’s building stock, Union’ study, carried out by a consortium including
still accounting for 36% of EU’s total CO2 emissions, Cambridge Econometrics (CE) in 2017, found that an
according to the European Commission.1 increase in the number of households with electric
vehicles will lead to a projected 5% to 40% increase in
• Solar sector-coupling: Solar is part of what will turn
installed solar PV capacity by 2030. But the potential
out to be a true energy revolution: enabling
goes far beyond the residential sector: while solar
technologies, such as storage, digitalisation, smart
generates power over the day, equipping all public and
homes and smart grids will play a key role in fostering
private office buildings with solar and EV infrastructure
solar’s establishment as the main power source in our
could enhance even more the flexibility potential for the
society. Sector coupling comes at the heart of every
electricity system. On-site solar combined with digital
citizen’s home - the keywords are on-site generation,
software and smart battery charging can provide the
EVs, smart home appliances. The more solar
system with ancillary services all day-long, while fellow
prosumers the better to foster the advent of the
citizens spend their day at work, and come back home
transformation towards a clean urban energy system.
with a fully solar-charged car.
• Digital peer-to-peer trading: While the policy
Car manufacturers and utilities are increasingly
frameworks for peer-to-peer power trading are often
beginning to engage in innovative solar mobility
still missing, urban solar prosumers will soon
business models. from solar powered vehicles and
increasingly be able to supply also neighbours,
solar powered charging stations to the development of
generating extra value from their PV installations.
innovative solar powered supply offers - solar will be a
Tomorrow, cryptocurrencies based on blockchain
key for the electric mobility revolution.
technologies, such as SolarCoin, GenerCoin,
EnergyCoin or others, might develop into the new
vector to ‘share’ solar energy in urban areas.
1 IMPACT ASSESSMENT Accompanying the document Proposal for a
Directive of the European Parliament and of the Council amending
Directive 2010/31/EU on the energy performance of buildings.
SolarPower Europe / GLOBAL MARkET OUTLOOk fOR SOLAR POWER 2018-2022 / 27You can also read