Dialogue on a RES policy framework for 2030 - Europa EU
←
→
Page content transcription
If your browser does not render page correctly, please read the page content below

Dialogue on a RES
 policy framework
          for 2030

                     D3.2.1

                     Appropriate policy portfo-
                     lios for (nearly) mature
                     RES‐E technologies

                         Authors:
                         Tobias Boßmann, Anne Held, Mario Rag-
                         witz (Fraunhofer ISI)

                         Luis Janeiro, Sonja Förster (Ecofys)

                         Pablo del Rio (CSIC)

                     April 2016

                     A report compiled within the European
                     IEE project towards2030-dialogue
                     (work package 3)

                     www.towards2030.eu
                     Intelligent Energy - Europe, ALTENER
                     (Grant Agreement no. IEE/13/826/SI2.674882)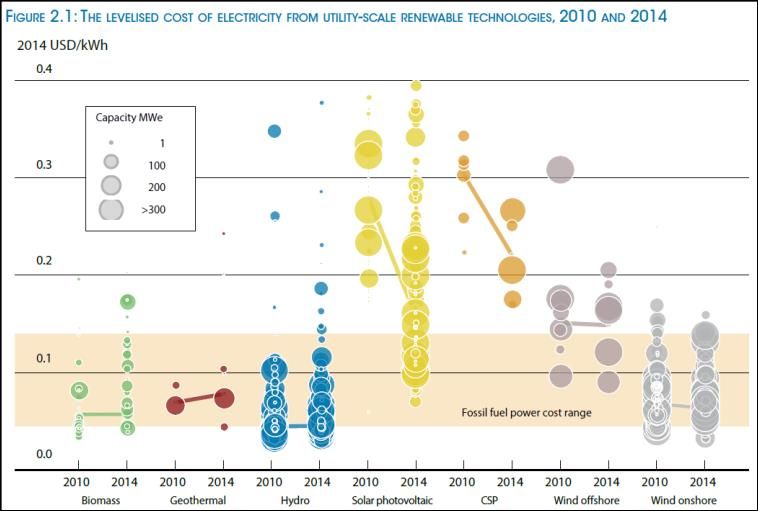
Appropriate policy portfolios for (nearly) mature RES-E technologies

                                   Project duration:     March 2014 – November 2016
                                   Funding               European Commission, EASME; Intelligent Energy Europe
                                   programme:            (IEE) - Programme, Contract No. IEE/13/826/SI2.674882
                                   Web:                  www.towards2030.eu
                                   General contact:      contact@towards2030.eu

About the project
The aim of towards2030-dialogue is to facilitate and guide the RES policy dialogue for the period towards
2030. This strategic initiative aims for an intense stakeholder dialogue that establishes a European vision of a
joint future RES policy framework.
The dialogue process will be coupled with in-depth and continuous analysis of relevant topics that include RES
in all energy sectors but with more detailed analyses for renewable electricity. The work will be based on re-
sults from the IEE project beyond 2020 (www.res-policy-beyond2020.eu), where policy pathways with different
degrees of harmonisation have been analysed for the post 2020 period. towards2030-dialogue will directly
build on these outcomes: complement, adapt and extend the assessment to the evolving policy process in
Europe. The added value of towards2030-dialogue includes the analysis of alternative policy pathways for
2030, such as the (partial) opening of national support schemes, the clustering of regional support schemes as
well as options to coordinate and align national schemes. Additionally, this project offers also an impact as-
sessment of different target setting options for 2030, discussing advanced concepts for related effort sharing.

Who we are?
                                                         Vienna University of Technology, Energy Economics
                                                         Group (EEG), Austria (Project coordinator)
                                                         Fraunhofer Institute for Systems- and Innovations
                                                         Research (Fraunhofer ISI), Germany
                                                         Energy Research Centre of the Netherlands (ECN),
                                                         Netherlands
                                                         Center for European Policy Studies (CEPS),
                                                         Belgium
                                                         National Technical University of Athens (NTUA),
                                                         Greece
                                                         Consejo Superior de Investigagiones Cientificas (CSIC),
                                                         Spain
                                                         Ecofys Netherlands and affiliates (Ecofys),
                                                         Netherlands
                                                         REKK Energiapiaci Tanacsado Ltd (REKK ET),
                                                         Hungary
                                                         European University Institute, Florence School of
                                                         Regulation (EUI), Italy

                                                       Page ii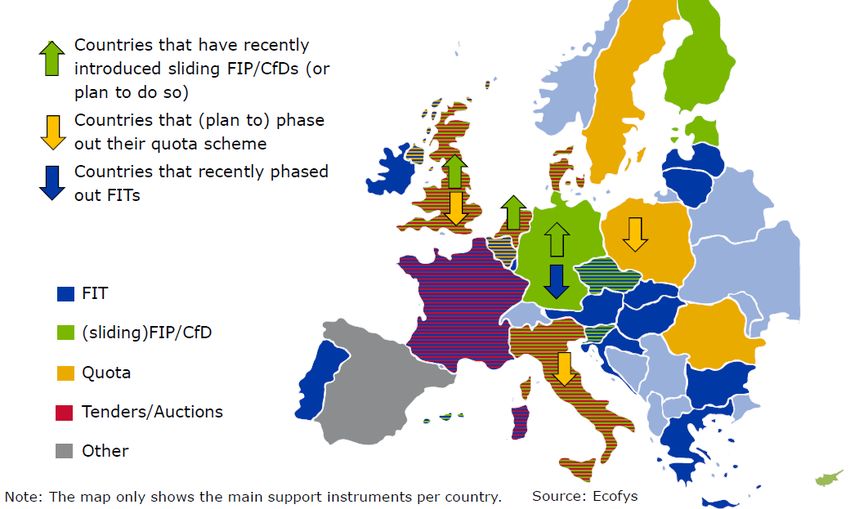
Appropriate policy portfolios for (nearly) mature RES-E technologies

      This report

      Until now, in particular PV and wind have experienced substantial cost reductions
      that brought them close to levelised cost of electricity generation from conven-
      tional generation technologies. Now, it is necessary to offer investors attractive
      framework conditions for these mature RES-E technologies while ensuring mini-
      mal costs for society, in order to attain the targets for RES-E deployment that
      were formulated by the EU.

      This report aims to identify challenges faced by investors of mature RES-E tech-
      nologies, and to suggest policy options to tackle these challenges. The challenges
      addressed in this report are related to factors which affect RES-E deployment in a
      2030 timeframe in the EU. The analysis will focus on policy design options that
      have been proposed in the recent policy discussion. The method will be based on
      qualitative comparisons between different alternatives for each challenge.
      Thereby, we substantiate the analysis of the challenges and possible solutions
      with selected country case studies.

Acknowledgement:                                           Legal Notice:
The authors and the whole project consortium               The sole responsibility for the content of this publication
gratefully acknowledge the financial and in-               lies with the authors. It does not necessarily reflect the
tellectual support of this work provided by the            opinion of the European Union. Neither the EASME nor
Intelligent Energy Europe (IEE) Programme.                 the European Commission is responsible for any use that
                                                           may be made of the information contained therein.
                                                           All rights reserved; no part of this publication may be
                                                           translated, reproduced, stored in a retrieval system, or
                                                           transmitted in any form or by any means, electronic, me-
                                                           chanical, photocopying, re-cording or otherwise, without
                                                           the written permission of the publisher.
                                                           Many of the designations used by manufacturers and
with the support of the                                    sellers to distinguish their products are claimed as
EUROPEAN COMMISSION                                        trademarks. The quotation of those designations in
Executive Agency for Small and Medium-sized                whatever way does not imply the conclusion that the use
Enterprises (EASME)                                        of those designations is legal without the content of the
Intelligent Energy Europe                                  owner of the trademark.

                                                    Page iii
Appropriate policy portfolios for (nearly) mature RES-E technologies

Table of contents
1     Introduction ..................................................................................................................................... 7

2     Basic information ............................................................................................................................. 8
    2.1   Identification and description of mature technologies ................................................................................................ 8
    2.2   Short summary of key challenges .............................................................................................................................. 10
      2.2.1       Technology-related policy challenges ................................................................................................................................... 11
      2.2.2       Macroeconomic-related policy challenges ........................................................................................................................... 12
      2.2.3       Administrative policy challenges ........................................................................................................................................... 12
      2.2.4       Social-acceptance related policy challenges ......................................................................................................................... 12
      2.2.5       Challenges for policy design .................................................................................................................................................. 13

3     Similar challenges across all EU member states ............................................................................ 15
    3.1   Investment uncertainty and rising risk premia .......................................................................................................... 15
      3.1.1       Market-based curtailment .................................................................................................................................................... 15
      3.1.2       Grid-related curtailment ....................................................................................................................................................... 18
      3.1.3       Retroactivity ......................................................................................................................................................................... 21
      3.1.4       Risks arising from support scheme design ............................................................................................................................ 24
    3.2   Shrinking market values ............................................................................................................................................. 27
      3.2.1       Description of the challenge ................................................................................................................................................. 27
      3.2.2       Policy design options ............................................................................................................................................................ 30
      3.2.3       Short appraisal ...................................................................................................................................................................... 31
    3.3   Non-economic barriers .............................................................................................................................................. 31
      3.3.1       Description of the challenge ................................................................................................................................................. 31
      3.3.2       Policy design options ............................................................................................................................................................ 33
      3.3.3       Short appraisal ...................................................................................................................................................................... 34

4     Country-specific challenges ........................................................................................................... 35
    4.1   Spain: Over-capacities are a barrier to the uptake of new RES-E installations .......................................................... 35
      4.1.1       Description of the challenge ................................................................................................................................................. 36
      4.1.2       Policy design options ............................................................................................................................................................ 39
      4.1.3       Short appraisal ...................................................................................................................................................................... 41
    4.2   Germany: No RES-E support in hours with negative prices ....................................................................................... 41
      4.2.1       Description of the challenge ................................................................................................................................................. 41
      4.2.2       Policy design options ............................................................................................................................................................ 44
      4.2.3       Short appraisal ...................................................................................................................................................................... 45
    4.3   UK: Lacking social acceptance for new wind parks .................................................................................................... 45
      4.3.1       Description of the challenge ................................................................................................................................................. 46
      4.3.2       Policy design options ............................................................................................................................................................ 48
      4.3.3       Short appraisal ...................................................................................................................................................................... 49

5     Summary and conclusion ............................................................................................................... 50

6     References ..................................................................................................................................... 53

                                                                                           Page iv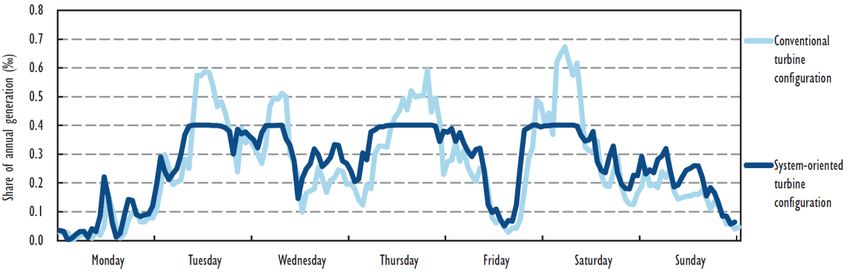
Appropriate policy portfolios for (nearly) mature RES-E technologies

Figures
Figure 1: S curve of technological development and policy instruments. Source: (Foxon, 2005) .......................... 8
Figure 2: The levelised cost of electricity from utility-scale renewable technologies, 2010 and 2014. Source:
(IRENA, 2014) ........................................................................................................................................................ 10
Figure 3: Number of hours with negative prices or with effective floor price. Source: (Fraunhofer ISI et al.,
2015a) ................................................................................................................................................................... 16
Figure 4: Grid related curtailment of RES-E generation in selected EU Member States (left) and share of total
renewable generation (right). Values for 2013 are only available for Germany and Spain. The Spanish value for
2013 only relates to wind energy. Source: (Steurer et al., 2014, Martinez et al., 2015, Fraunhofer ISI et al.,
2015b) ................................................................................................................................................................... 20
Figure 5: RES-E support schemes applied in EU member states. Source: (Klessmann, 2014) .............................. 24
Figure 6: Overview of factors influencing the market value. Source: (Pudlik et al., 2015) ................................... 27
Figure 7: Evolution of relative market values in Germany as function of market share. Source (Pudlik et al.,
2015) ..................................................................................................................................................................... 28
Figure 8: Comparison of electricity generation from two different wind turbine designs. Source (IEA, 2014a) .. 29
Figure 9: Peak power demand vs. available capacity (MW). Source: Own elaboration. Data source: Red Eléctrica
de España. ............................................................................................................................................................. 36
Figure 10: Duration of continuous periods with negative wholesale prices on the day-ahead market of EPEX
Spot. Source: (Fraunhofer ISI et al., 2015a) .......................................................................................................... 42
Figure 11: Evolution of the annual number of hours with negative prices (left) and the respective number of
intervals (right) across the different weather years. 2030* contains the adapted generation profile. Source:
(Fraunhofer ISI et al., 2015a) ................................................................................................................................ 43
Figure 12: Evolution of future amount of curtailed electricity (left) and share in total electricity generation
(right) across the different weather years. Source: (Fraunhofer ISI et al., 2015a) ............................................... 43
Figure 13: Public Opinion towards Wind Farms. Data based on EDF tracker and DECC public attitudes tracker 46

Tables
Table 1: Globally installed capacities of RES-E technologies. Source (REN21, 2015) .............................................. 9
Table 2: Assignment of case studies to EU-wide challenges from Chapter 3 ....................................................... 35
Table 3: Number of hours with negative prices and annual minima of electricity wholesale prices on the day-
ahead market at EPEX Spot, 2008-2014................................................................................................................ 42
Table 4: Further arguments against onshore wind ............................................................................................... 47
Table 5: Overview of measures to tackle challenges hindering the deployment of mature RES-E technologies . 52

                                                                                 Page v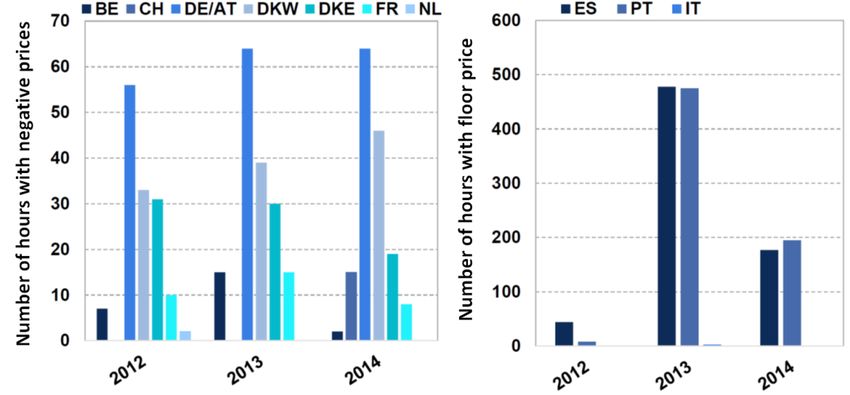
Appropriate policy portfolios for (nearly) mature RES-E technologies

                                                    Page vi
Appropriate policy portfolios for (nearly) mature RES-E technologies
1 Introduction
The European Union has decided to transform the European energy system for reasons of sustainability, cost-
competitiveness and security of supply. The large scale deployment of renewable energy sources for electricity
generation (RES-E) represents a major pillar of the strategy to decarbonise the electricity sector. Until now, in
particular PV and wind have experienced substantial cost reductions that brought them close to levelised cost
of electricity generation (LCOE) from conventional generation technologies. Now, it is necessary to offer inves-
tors attractive framework conditions for these mature RES-E technologies while ensuring minimal costs for
society, in order to attain the targets for RES-E deployment that were formulated by the EU. This can e.g. be
realised by keeping the risk premium for investments low. This report aims on the one hand to identify chal-
lenges faced by RES-E investors triggering an increase of the risk premium and, on the other hand, to suggest
policy options to tackle these challenges.
More specifically, the RES-E policy challenges addressed in this report comply with two conditions: First, they
are directly and indirectly related to factors which affect RES-E deployment in a 2030 timeframe in the EU
through increased market exposure and thus higher risk premia for potential investors. Second, these chal-
lenges shall be addressable by RES-E policy.1 The analysis will focus on policy design options that have been
proposed in the recent policy discussion. The method will be based on qualitative comparisons between differ-
ent alternatives for each challenge. Thereby, we substantiate the analysis of the challenges and possible solu-
tions with selected country case studies.
The report starts with some basic information on the identification and description of mature technologies and
shortly summarises the key challenges to policy support for mature RES-E technologies. The structure of the
remainder is two-part: The first part (Chapter 3) contains an overview of challenges for RES-E investors that
occur across many or a majority of Member States (MS) in the EU. The second part (Chapter 4) shows then
examples of the general challenges, but that are specific to individual EU MS. The report closes with a short
summary and policy recommendations.
1Those challenges which are related to the general functioning of electricity markets and, in particular, issues related to
market integration and grid integration of RES-E are not addressed in this report. Challenges related to external develop-
ments will not be addressed in this report either.
Page 7Appropriate policy portfolios for (nearly) mature RES-E technologies
2 Basic information
This chapter defines which RES-E technologies are regarded as mature. It further provides an overview of chal-
lenges arising for RES-E technologies.
2.1 Identification and description of mature technologies
Following the economics of innovation, a technology’s level of maturity depends on the position in the S-curve
and the stage of the innovation process (see Figure 1). In the course of technology evolution, immature tech-
nologies are located at the stage of development of robust prototypes and demonstration projects (RD&D).
The major challenge for these technologies consists of the incremental decrease of levelised costs of electricity
generation (LCOE). Mature technologies instead have reached a certain level of commercialisation and cost-
efficiency. The final stage of the technology evolution process consists of large scale deployment despite de-
creasing technology support.
Figure 1: S curve of technological development and policy instruments. Source: (Foxon, 2005)
Unlike other commercial products, it is somewhat difficult to precisely locate the different RES-E technologies
in the S-curve as they usually receive support from the government or public agencies (Usha Rao, 2010). How-
ever, there are specific indicators that can be used to determine and compare the stage of technological inno-
vation of individual RES-E technologies. They include primarily the LCOE and the overall globally installed capac-
ity.
Table 1 provides an overview of the globally installed RES-E capacities. It is evident that hydropower presents
by far the most significant capacity. Wind power, solar PV and biomass represent already substantial capacities
Page 8Appropriate policy portfolios for (nearly) mature RES-E technologies
and can thus also be considered as mature technologies. However, as outlined in the chart integrated in Table
1, wind and solar PV currently experience exponential growth (at the global level), whereas biomass is charac-
terised by a rather linear capacity increase (on average). In contrast, geothermal and concentrated solar power
(CSP) only feature small numbers of installed capacities. These technologies could thus be assigned to the
phase of pre-commercial or supported commercial maturity.
Table 1: Globally installed capacities of RES-E technologies. Source (REN21, 2015)
[GW] 2003 2012 2013 2014 400
Wind
350
Hydro 715 960 1018 1055 Solar PV
300 Biomass
Installed capacity [GW]
Geothermal
Wind 48 283 318 370 250
CSP
200
Solar PV 2.6 100 138 177
150
Biomass 36 83 88 93 100
50
Geothermal 8.9 11.5 12.1 12.8
0
CSP 0.4 2.5 3.4 4.4 2000 2005 2010 2015
The evolution of LCOE of different RES-E technologies between 2010 and 2014 is outlined in Figure 2. It is per-
tinent to note that LCOE for hydro-based electricity generation are in the range of conventional power genera-
tors, similar to biomass-based power plants. Solar PV has experienced significant growth in installed capacity
and a substantial drop in costs that makes PV competitive with conventional power generators. A similar evolu-
tion can be observed for wind on-shore, attaining even lower levels of LCOE. Comparatively higher levels of
LCOE and a substantially lower number of large-scale installations are characteristic for geothermal and wind-
offshore, indicating a lower degree of maturity. Electricity generation from CSP features a reduction in LCOE
but is still far from being competitive.
Page 9Appropriate policy portfolios for (nearly) mature RES-E technologies
Figure 2: The levelised cost of electricity from utility-scale renewable technologies, 2010 and 2014. Source: (IRENA,
2014)
Based on this assessment we identify CSP, geothermal and wind-offshore as immature technologies. Solar PV
and wind onshore can be considered as mature technologies at the phase of supported commercial use. Hy-
dropower generation is regarded to be fully commercial. In addition, on the European level, hydro is not ex-
pected to experience substantial further growth in the future. Biomass technologies are partly fully commer-
cial, but there are still non-mature technologies such as gasification plants. Since the range of biomass technol-
ogies covered is very broad, we do not consider biomass as one already mature RES-E technology. Instead, we
focus on solar PV and wind onshore.
2.2 Short summary of key challenges
Work carried out in this project has identified key challenges for European renewable electricity policy in a
2030 perspective, based mostly on a literature review (del Río and Peñasco, 2014). The starting assumption is
that the perspectives of policy makers are reflected in policy documents, both European and from MS. Publicly
available EU documents and information sources at MS level have been consulted. In addition to those official
documents, country case studies in energy and energy policy journals, relevant information in the “grey litera-
ture” and reports from other EU-funded projects have been taken into account (see del Río and Peñasco, 2014,
for further details on the methodology).
The resulting list of documents and articles allowed us to identify relevant challenges, which have been classi-
fied in different categories: technology-related, macroeconomic-related, related to current policy discussions,
administrative barriers and social acceptance. However, we have not tried to rank the relevance of those chal-
lenges. The perspective adopted is mostly that of renewable energy policy-making at MS level.
Page 10Appropriate policy portfolios for (nearly) mature RES-E technologies
2.2.1 Technology-related policy challenges
Technological development determines whether renewable electricity sources are available on the market
(Boie et al., 2014). Renewable electricity deployment critically depends on technology development and cost
reductions (European Commission, 2013). A set of challenges is related to the evolution of the costs and ma-
turity of the technologies. In this respect, the most important technologies to take into account are renewable
energy technologies themselves.
Adapting support level to trends in technology costs
Adapting support levels to the evolution of technology costs in order to avoid overcompensation (or too low
support) represents a challenge for policy makers. Likewise, the costs of renewable electricity deployment may
also be affected by changes in material prices. For example, variations in the price of silicon and steel were
important in explaining those changes in the past in the case of solar PV and wind (Panzer, 2012). There are
also concerns that shortages of rare earth metals (such as indium, tellurium and silver for the deployment of PV
technologies) and carbon fibre (for the offshore wind industry) are likely to drive up the prices and hence will
escalate installation costs in the short to medium term (Zyadin et al., 2014). All these trends would certainly
affect deployment of renewable electricity.
Appropriate combination of R&D support and deployment support for less mature renewable electricity
technologies
Policy-makers have to adapt the type of renewable electricity policy to the specifics of the technology in ques-
tion in order to induce cost reductions and innovation in renewable energy technologies. Some of these will
require more emphasis being put on R&D investments, whereas for others mass deployment will still make
more sense. The balance between R&D support and deployment support for less mature technologies repre-
sents a critical challenge, both at the EU and MS levels.
Adapting to the uncertain evolution of factors affecting the competitiveness of renewable energy technolo-
gies: resource potentials, fossil fuel prices and costs of competing technologies
Since EU renewable energy targets are set as a percentage of final energy consumption, they are affected by
variables either influencing renewable electricity generation or electricity demand. Renewable electricity gen-
eration would be affected by resource endowment. A lower than expected quality of renewable energy re-
sources (wind speeds, levels of solar radiation, rainfall levels…) would entail a lower than expected electricity
production, ceteris paribus. It is a challenge to estimate with absolute precision the amount of those resources
a long time ahead, although this is probably not a major factor, i.e. its relative importance is lower compared to
other variables. An important variable, although also mostly beyond renewable electricity policy, are fossil fuel
and carbon prices. Their influence on renewable electricity deployment can be substantial as they determine
the relative profitability of renewables compared to those technologies fired by fossil fuels. While it is beyond
the boundaries and scope of renewable electricity policy, those prices have to be taken into account when
setting policies for renewable electricity. It is certainly a challenge to predict the trends in those prices, so that
support costs for renewables are neither too low nor too high but simply provide a reasonable comparative
cost advantage compared to fossil fuels. The challenge is compounded by the fact that different types of re-
newable electricity and fossil fuel sources are substitutable to different degrees regarding peak and base loads.
A somehow related topic is the trend in the costs of competing non-renewable technologies. While, again,
clearly beyond the realm of renewable electricity policy, an accurate calculation and prediction of the evolution
of these costs should be made in order to appropriately set support levels for renewable electricity, a challenge
on its own. A particularly relevant factor for renewable electricity deployment is the price of gas.
Page 11Appropriate policy portfolios for (nearly) mature RES-E technologies
2.2.2 Macroeconomic-related policy challenges
Providing support under strict fiscal conditions
The austerity programs adopted to cope with the public deficits have involved a reduction of budget-financed
renewable electricity support, although in most countries renewable electricity is predominantly supported
through a surcharge on electricity bills. The degree of the uncertain economic recovery in the short and medi-
um terms will influence renewable electricity policy and, thus, renewable electricity deployment. A main chal-
lenge for renewable electricity policy makers is to provide continuity of support but consider limited budget at
the same time. This will certainly increase pressure for policymakers to adopt cost-effective policies.
Difficulties in access to finance
On the other hand, the financial crisis has led to credit restrictions which have affected all types of productive
investments and, particularly, renewable electricity investments. The cost of capital has risen in some MS (Eu-
ropean Commission, 2013, and Noothout et al., 2016). This has involved a difficulty to access loans in order to
finance those investments and/or substantially increase total capital costs 2. In some countries, and particularly
in the South of Europe (such as Portugal, Spain), capital is relatively more expensive. A main challenge for re-
newable electricity policy is to mitigate these restrictions and facilitate access to affordable finance for renew-
able electricity investors and, particularly, for the smaller ones.
2.2.3 Administrative policy challenges
Improving and reducing the duration of the administrative procedures
Administrative barriers crucially affect the uptake of renewable electricity. Their relevance has been highlight-
ed by several EU-funded projects and by the European Commission itself. This issue is further addressed below
(see 3.2).
2.2.4 Social-acceptance related policy challenges
Mitigating the not-in-my-backyard (NIMBY) of renewable electricity projects
Public opinion is of particular importance for the deployment of renewable electricity (Boie et al., 2014). The
social acceptance of renewable electricity in a 2030 perspective has two sides. On the one hand, it may refer to
the not-in-my-backyard (NIMBY) phenomena for renewable electricity deployment. Renewable energy projects
bring, both, benefits for the local population and costs. The former may refer to an increase in employment
levels and rural/regional development opportunities. The latter is usually associated to negative environmental
impacts, i.e. visual intrusion, soil occupancy etc. This issue would become more problematic with an increasing
penetration of renewable electricity, which would be the case in 2030 if there was a concentration of renewa-
ble electricity deployment in certain places and for certain technologies. A key challenge for policy makers lies
in developing effective public participation strategies, and in gaining a better understanding of local attitudes
and how participatory approaches in renewable electricity planning can facilitate further deployment of re-
newable electricity.
2According to Bloomberg/NEF, investment in renewables reached a peak in 2011 of 123$Mlrd and decreased thereafter to
53$Mlrd in 2013.
Page 12Appropriate policy portfolios for (nearly) mature RES-E technologies
Addressing social rejection to high or escalating support costs
On the other hand, social acceptance may be related to the costs of public support. If these are too high or
experience a substantial increase in a given year, this would lead to a social backlash against the renewable
electricity deployment support scheme. This suggests that a major challenge for policy-makers is to keep the
costs of renewable electricity policy within reasonable levels. Social acceptance may not only be related to the
total amount of policy costs, but on their distribution among different actors (i.e. equity). If those costs fall
disproportionately on a given group of the population, social rejection is more likely, especially if this group is
well-organised and has considerable negotiation power. Certainly, a challenge for governments is to appropri-
ately inform the people about the costs and benefits associated to the public promotion of renewable electrici-
ty deployment.
2.2.5 Challenges for policy design
Institutional adaptation to the implementation of market-based instruments
The Guidelines on State aid for environmental protection and energy 2014-2020 (European Commission, 2014)
state that renewable support schemes should normally be market-based. Market-based instruments are ex-
pected to increase cost-effectiveness and mitigate the distortions on competition. Competitive bidding (i.e.
auctions) will have to be implemented in order to provide support to most of the new installations from 2017
onwards3. Arguably, this move to market-based instruments in general and auctions in particular will represent
a challenge for policy makers, i.e. the institutional adaptation to a new instrument.
How to design auctions to lead to effective and efficient deployment of renewable electricity
In addition, the choice of design elements for the new market-based instruments in general and auctions in
particular, in order to ensure an effective and efficient deployment of renewable electricity represents a main
challenge. This last point is highly relevant since auctions for renewable electricity can be designed in many
different ways (del Río and Linares, 2014).
Bindingness of targets
The existence of a binding EU target without binding national targets in a context in which the responsibility for
renewable electricity policy instruments remains solely at the MS level raises the issue of how those MS poli-
cies can be expected to contribute to the EU target when there is no responsibility for a national amount of
renewable electricity deployment. Lack of national targets may increase uncertainty (at least initially) in rela-
tion to proportions of renewable electricity on the system (CEER, 2013). This would affect the whole value
chain for renewable energy technologies, including technology providers and project developers. Obviously,
the alternatives (i.e. MS targets and an EU-wide target) also bring challenges, mostly in terms of cost-effective
deployment across the EU, if the renewable electricity targets are set only partially considering renewable
3According to the Guidelines (126 and 127), aid for at least 5 % of the planned new electricity capacity from renewable
energy sources should be granted in a competitive bidding in the transitional phase 2015-2016. From 1 January 2017, aid
should be granted in a competitive bidding process unless Member States demonstrate that only one or a very limited
number of projects or sites could be eligible or that higher support levels or low project realisation rates would result from
the competitive bidding process. The bidding process can be limited to specific technologies where a process open to all
generators would lead to a suboptimal result which cannot be addressed in the process design in view of, in particular: the
longer-term potential of a given new and innovative technology; the need to achieve diversification; network constraints
and grid stability; system (integration) costs or the need to avoid distortions on the raw material markets from biomass
support. Aid may be granted without a competitive bidding process to installations with an installed electricity capacity of
less than 1 MW (6 MW for wind installations), or demonstration projects.
Page 13Appropriate policy portfolios for (nearly) mature RES-E technologies
energy resource potentials in MS (i.e. when they are mostly set according to the economic capacity of coun-
tries).
The impact of market values on the competitiveness of renewable energy technologies
Furthermore, it is usually argued that past and future reductions in the costs of solar PV and wind will make
these technologies cost-competitive with respect to their competing alternatives in the medium or long-term
(Piria et al., 2013). For some, this means that support schemes for wind and solar should be phased out. How-
ever, there is still a challenge for policy makers to encourage renewable electricity investments with the ex-
pected move to market-based instruments, since part of the revenues are received through the wholesale
market and prices are reduced when a greater penetration of renewable electricity takes place (so-called “mer-
it order effect”, see Sensfuß et al., 2008). Therefore, even where the full costs of (variable) renewables are
lower than average market prices, policy intervention may be needed to ensure that sufficient investment is
attracted to renewable electricity projects (Piria et al., 2013).
Balancing stability and flexibility in renewable electricity support
Finally, a fundamental challenge for policy-makers is to balance the trade-off between improved stability for
investors and flexibility of the support scheme to adapt to changing circumstances in order to avoid overcom-
pensation to renewable electricity generators.
The above discussion has identified the main challenges which are common to most technologies, i.e. to re-
newable electricity in general. However, for reasons of simplicity it has not focused on the technology-specific
challenges. These might be relevant. For example, the future of biomass is subject to uncertainties such as lack
of biomass markets, transportation infrastructure and supply chains. In addition, requirements in terms of
efficiency improvements and application of new combustion technologies will limit a strong deployment of this
technology (Boie et al., 2014). In addition, challenges are likely to differ per region within the EU. For example,
as mentioned above, some are likely to have more credit restrictions and budget constrains than others. Feed-
back from stakeholders on those technology-specific and regional-specific barriers would be useful.
Page 14Appropriate policy portfolios for (nearly) mature RES-E technologies
3 Similar challenges across all EU member states
From an investor’s perspective, mature RES-E technologies face a number of challenges that potentially hinder
the further deployment in a scenario of decreasing public financial support. Some of these challenges occur
similarly across all EU member states. They include:
high risk premia due to different factors increasing investment uncertainty,
shrinking market values of RES-E and
non-economic barriers.
One key problem regarding the challenges identified is that reducing the risk premia typically counteracts the
increased market compatibility of RES-E support required for increasingly competitive RES-E technologies. Each
type of challenge and potential policies to remove or at least attenuate these challenges are addressed in more
detail in the following sections. Each section includes a short description of the challenge, describes the respec-
tive policy options (instruments, design elements, combinations of instruments) to tackle the challenge and
outlines their strengths and weaknesses.
3.1 Investment uncertainty and rising risk premia
To ensure profitability of a utility scale RES-E project, the key challenge for an investor is to reduce the cost of
capital (also referred to as weighted average cost of capital, WACC). The cost of capital is substantially influ-
enced by the risk premium that represents costs related to the uncertainty in the occurrence of future reve-
nues and costs. The level of uncertainty and thus the related risk premia are highly heterogeneous across the
EU as they depend on country specific framework conditions. Consequently, also the urgency of introducing de-
risking policies varies across EU member states. From the DIA-CORE project we know that such policies are
implemented in some member states but there are substantial difficulties in many other (EPU-NTUA et al.,
2015). Thus, selected revenue risk challenges and policy designs are outlined in the following.
3.1.1 Market-based curtailment
3.1.1.1 Description of the challenge
Currently, the EU renewable energy Directive (European Commission, 2009) requires MS to ensure priority
dispatch for RES-E in so far a secure operation of the power system is ensured. With increasing RES-E in the
power system, special situations characterised by a highly inflexible must-run electricity generation in combina-
tion with low demand have increasingly occurred in European electricity markets. These situations can be sig-
nalled by negative prices, if market design does not prohibit their occurrence. We briefly assess the frequency
of negative prices at the EEX/EPEX day-ahead as an indicator for situations with high electricity supply and low
demand that may require curtailing RES-E. In recent years, negative prices were observed during a limited
number of hours at the different European day-ahead markets. Figure 3 shows the number of hours with nega-
tive prices or effective price floor (in case no negative prices are allowed) for different countries of the EU. In
such situations, the RES-E operator or marketer has no incentive to sell his electricity on the market if (1) the
electricity is marketed directly under a market premium scheme and if (2) if the market price drops below the
Page 15Appropriate policy portfolios for (nearly) mature RES-E technologies
negative value of the market premium. This behaviour of restrained bidding is also referred to as “market-
based curtailment”4.
Negative prices and market-based curtailment affect likewise conventional and renewable power generators.
However, it should be noted that the impact on the profitability of renewable power plants is more severe
given the differences in their cost structures. As especially wind and solar PV feature substantial capital costs
but no fuel costs, the capital costs can only be covered by maximising electricity generation, which is already
limited by the availability of the respective natural resource. Curtailing generation would further cut the reve-
nue potential beyond the limits of the natural potential. Conventional generators instead are characterised by
higher variable costs and avoiding these costs can reduce the financial impact of curtailment (Bird et al., 2014).
Figure 3: Number of hours with negative prices or with effective floor price. Source: (Fraunhofer ISI et al., 2015a)
With respect to future investments, a risk for investors arises from the difficulty to properly assess how often
negative prices will occur in the future and at which (negative) price levels. Estimates of the future occurrence
of negative prices in the current literature vary substantially. For instance, for the EEX/EPEX day-ahead market
the German think tank Agora Energiewende (2014) expects up to 1,200 hours per year in 2022 with negative
prices (assuming that the share of RES-E exceeds 65% of the hourly demand) whereas Fraunhofer ISI et al.
(2015a) expect approximately 250 hours until 2025. Current investors face even higher uncertainty since fore-
casts are required beyond 2025, given the average life time of RES-E assets of about 20 years.
In order to design appropriate policies that reduce the risk of market-based curtailment, it is essential to obtain
a thorough understanding of the reasons for negative prices. One assumption is that negative prices typically
occur at hours with high shares of RES-based electricity generation and low levels of demand. However, accord-
ing to the analysis of electricity prices at the EEX/EPEX day-ahead market in 2012 and 2013, carried out by Ago-
ra Energiewende (2014), the share of RES-E never exceeded 65% of electricity consumption in all hours with
negative prices. That is, negative prices do not only occur when demand is fully covered by renewable electrici-
ty generation. Instead, even in hours with negative prices (or hours with positive prices, but below the marginal
generation costs of nuclear and lignite power plants) conventional generation capacities, featuring marginal
generation costs superior to zero, account for a substantial share of the total generation mix. The two major
reasons to explain this phenomenon, introduced by Agora Energiewende (2014), are explained in the following:
(1) Certain conventional power plants (in particular base load capacities) are characterised by technical
restrictions that prevent them from shutting down and starting up very quickly or for a short number
of hours. In situations of relatively low demand and/or a high share of RES-based generation lasting
only for a few hours, the operator of such an inflexible power plant has to choose between shutting
4 Market-based curtailment should not be mixed up with grid-related curtailment, where congested grids require the cur-
tailment of electricity.
Page 16Appropriate policy portfolios for (nearly) mature RES-E technologies
down the plant or keeping it running despite market prices being inferior to his marginal generation
costs. In the first case the operator encounters the respective costs for shut-down, start-up and poten-
tial opportunity costs if the minimum shutdown time exceeds the duration of the low price period. In
the second case, he encounters the costs related to the price difference between his marginal costs
and the actual market price, but he benefits from the ability to run the plant in a profitable manner as
soon as the low price period is over. Comparing both options delivers a certain price threshold where
the continuous utilisation of the plant starts being more profitable. This is the minimum price at which
the operator bids his generation at the market. Depending on the length of the low price period and
the type of power plant, this price can be negative.
(2) Operators of conventional capacities can also be required to sell electricity at the market at low prices
if they have to fulfil additional contractual obligations. Reserve capacities sold at the ancillary services
market require the operation of a power plant according to the original schedule despite very low or
negative market prices to ensure short-time positive or negative adjustment in power output in the
contractually agreed period of time. Similar obligations apply to the operators of combined heat and
power (CHP) plants that must supply a contractually agreed amount of heat and are thus forced to sell
the electricity generated simultaneously. In both cases, operators place bids at (negative) prices corre-
sponding to the opportunity cost related to a breach of contract, in order to sell their electricity at the
market.
3.1.1.2 Preventive policies
Based on the assessment of the reasons for negative prices the following section proposes policies to over-
come risks related to market-based curtailment. However, it is important to note that negative prices as such
do not represent a disadvantageous feature of the market design. In contrary, negative prices (similar to ex-
tremely high prices) give a clear indication of situations with deficient system flexibility (assuming a properly
functioning market). Thus, the policy suggestions do not aim to disable this market mechanism of negative
prices. Instead, the aim is (1) to avoid the frequent occurrence of situations with negative prices and (2) to
make the impacts of such situations more manageable for RES-E operators.
In order to avoid situations with negative prices the following measures can be envisaged and triggered by
policies:
(1) The reduction of the must-run capacity block would diminish the capacity of power plants that poten-
tially place negative bids at the market in order to fulfil additional contractual obligations. Reducing
the amount of spinning reserve could be realised by providing RES-E generators better access to the
ancillary services market (e.g. through shortened auctioning periods that are compatible with the
RES-E forecast horizon and adapted prequalification requirements). Incentivising more flexibility in
the heat sector can be realised by supporting the introduction of so-called power-to-heat measures
(that enable a short term substitution of CHP-based heat generation through a RES-E-powered re-
sistance heater5) and heat storage capacities (that permit a more flexible operation of the CHP plants).
(2) An expansion of transmission capacities between EU countries can facilitate the convergence of spot
market electricity prices and thus reduce the frequency of hours with negative prices as well as the
overall price level (Haas, 2008). This effect can be enhanced by a further implementation of the inter-
nal energy market (possibly also in the context of the overarching target of an Energy Union, envis-
aged by the European Commission (2015a) that strives for the utilisation of interconnectors without
any technical or regulatory barriers). A similar effect can be observed through increased storage ca-
pacities (Kondziella and Bruckner, 2012). However, the question is whether price spreads are suffi-
cient to ensure the economic efficiency of storage plants and whether there is enough social ac-
5It should be noted that resistance heater should only be used for heat generation in hours of particularly high shares of
RES-E, in order to avoid an increase of carbon emissions by substituting low-carbon natural gas through carbon-intensive
base load electricity.
Page 17Appropriate policy portfolios for (nearly) mature RES-E technologies
ceptance for large scale projects. In particular the latter issue can be addressed by policy through the
introduction of local benefit schemes, participation programs and information campaigns.
(3) If end consumer prices for electricity reflect the variation in spot market prices (as it is for instance the
case in Sweden), in particular negative prices could induce a shift of demand into the respective low-
price hours, lifting the price level (load management). To increase the flexibility of electricity demand,
adequate policies should pave the way for the introduction of time variable tariffs and possibly pro-
vide the regulatory framework for the rollout of the corresponding infrastructure (smart meters). A re-
design of end-consumer prices (in particular in the residential and commercial sector) can ensure that
charges and taxes (for the network and financing of RES-E support) do not prevent from load man-
agement by making negative price signals “invisible”. Instead, a dynamic design of these components
can provide additional incentives to consumers to consume electricity in hours of high generation
from RES-E. Further information on the impact of demand flexibility on RES-E is provided in Section
3.2.
3.1.1.3 Reactive policies
In the case that market prices lead to a curtailment of RES-E generation there is the option to treat market-
related curtailment as the provision of ancillary services and (partially) compensate any losses in revenue. In
this case curtailment could be understood as an ancillary service in terms of providing downward reserve ca-
pacity or balancing energy (EWEA, 2013). This measure would fully eliminate the risk of market-based curtail-
ment.
3.1.1.4 Short appraisal
All measures suggested to reduce the occurrence of hours with negative prices basically lead to a general im-
provement of the functioning of the electricity market. They enhance flexibility in the electricity system, in-
crease price elasticity of electricity demand at the spot market and thus lead to reduced price levels that are
beneficial for consumers and the economic competitiveness. However, the suggested measures require further
analysis in order to estimate the involved costs and compare these to the achieved benefits.
Providing compensation payments for curtailed RES-E generation in hours of negative prices should only be
introduced after all alternative measures have been taken. Compensation payments disincentivise an economic
utilisation of the RES-E generation capacities and cause additional costs that would need to be borne by the
consumer.
However, the question comes up how to deal with negative prices, when they occur more frequently due to an
over-supply from RES-E generation that exceeds overall demand. In this case, new remuneration elements are
likely to be required in addition to the pure market price to ensure further investments in RES-E capacities. For
example when assuming a transformation of current feed-in tariff schemes based on administrative price set-
ting to tender schemes any potential losses during periods of negative prices will be internalised in the level of
the bids, therefore an automatic adaptation of remuneration levels occurs. However, such situations will only
arise in the long run, when RES-E dominates the overall electricity generation mix.
3.1.2 Grid-related curtailment
3.1.2.1 Description of challenge
In addition to market-based curtailment, RES-E generators face loss of income through congestion manage-
ment and grid related curtailment. Uncertainty about the frequency of congestion situations thus represents
an additional driver for the risk premium.
There are at least two major reasons for grid related curtailment (see for instance Jacobsen and Schröder,
2012):
Page 18Appropriate policy portfolios for (nearly) mature RES-E technologies
(1) Network constraints: Curtailment can take place temporarily (occasionally during several weeks or
months) if the expansion of grid infrastructure is delayed relative to the installation of generation ca-
pacity. Curtailment may also occur more permanently if a distribution or transmission system operator
(DSO or TSO) intentionally hinders grid reinforcement due to substantial additional costs that cannot
be justified by the marginal amount of additionally integrated RES-E generation. The rationale behind
this behaviour is the purpose to avoid overinvestment in grid capacity if the related costs substantially
exceed the costs for lost RES-E generation. That means curtailment is considered as a solution for the
optimisation of capacity investments in the grid.67
(2) Network security and inertia: In contrast to the first aspect, curtailment may also be required at very
short time scales when network security is at risk. In this case, grid capacity is sufficient to accommo-
date all RES-E generation but fast changes in RES-E generation, grid faults or limitations in other fac-
tors (such as reactive power or frequency) threaten the stability of the grid. If fast shut-downs of im-
portant RES-E capacities are foreseeable, precautionary curtailment ahead of the expected drop can
ensure a controlled reduction in generation and the connection of additional spinning reserve. Cur-
tailment may also be required in situations of grid faults and grid maintenance, when RES-E generation
cannot be integrated by the grid. Last, a high share of RES-E generation can trigger e.g. frequency
problems in the grid which require curtailment and the connection of conventional units providing ad-
ditional inertia in the system.
The reasons for curtailment outlined above do not necessarily imply a risk for investors, as curtailment may
happen voluntarily. In this case, RES-E operators and DSOs or TSOs agree on a reduction in generation output
in pre-defined situations and under certain established procedures and compensation schemes (EWEA, 2013).
However, if the curtailment happens involuntarily, it can be understood as a major driver for the risk premium
due to the uncertainty in estimating the potential future loss of income through grid-based curtailment. In this
context it has to be kept in mind that the uncertainty of curtailment does not only depend on the grid man-
agement but also on all other actors linked to the grid. These actors include other renewable capacities and
conventional installations as well as consumers with their individual consumption behaviour that can influence
the occurrence of grid-based curtailment.
In order to get an impression of the scale of grid related curtailment observed in the past, Figure 4 illustrates
the amount of curtailed RES-E generation and the respective share relative to overall RES-E generation for
selected EU countries. Italy is characterised by a decline of curtailment over the past years from nearly 9% to
less than 1% (due to substantial grid upgrades and extensions, according to Steurer et al., 2014), all other coun-
tries feature an increase in curtailment (Spain only in 2013). In the most recent years, the share of curtailed
energy ranges between 0.3% and 2.1%.8
6 Ochoa et al. (2010) determine in their simplified network simulations that accepting curtailment of 2% allows doubling
wind power penetration to 29%. This share rises to more than 40% if 10% curtailment is allowed. The German Energy Agen-
cy, Dena (2012), determined that curtailing wind and PV generation by 2% would reduce required investment by 13%-21%,
depending on the voltage level, until the year 2030.
7In Germany, grid operators are allowed to curtail RES-E generation when grid stability is jeopardized. RES-E operators are
compensated for 95% of the lost profit (Bundesnetzagentur, 2014)
8With regard to Spain, for the period January to April 2013 curtailment translates into economic losses of €70 m (Martinez
et al., 2015). For Germany, the costs for the entire year 2013 sum up to nearly €44 m (Next Kraftwerke, 2015).
Page 19You can also read