A Fuel Efficiency Horizon for U.S. Automobiles
←
→
Page content transcription
If your browser does not render page correctly, please read the page content below
A Fuel Efficiency Horizon for U.S. Automobiles

                                               John M. DeCicco
                                            University of Michigan*
                                                September 2010

                                              Report prepared for
                                             The Energy Foundation

*
    Work on this project was performed as an independent consultant to The Energy Foundation.
    For identification purposes, the author is senior lecturer, School of Natural Resources and Environment,
    and a faculty fellow, Michigan Memorial Phoenix Energy Institute, University of Michigan.
    Contact: DeCicco@umich.edu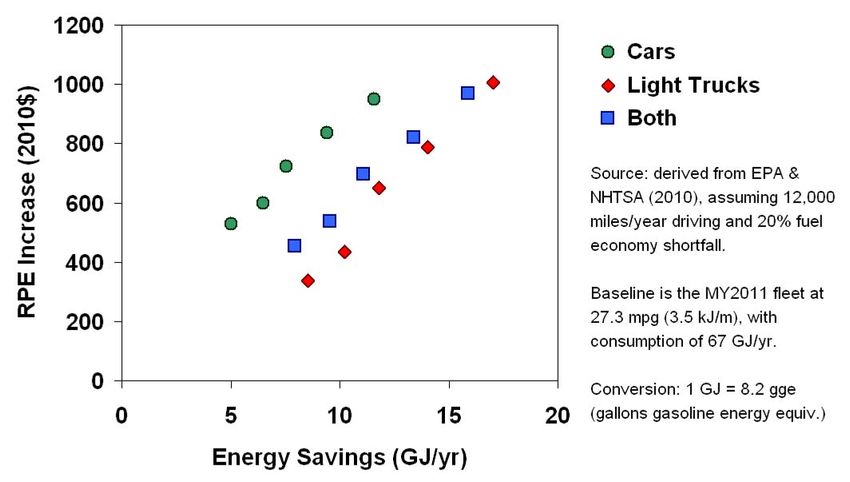
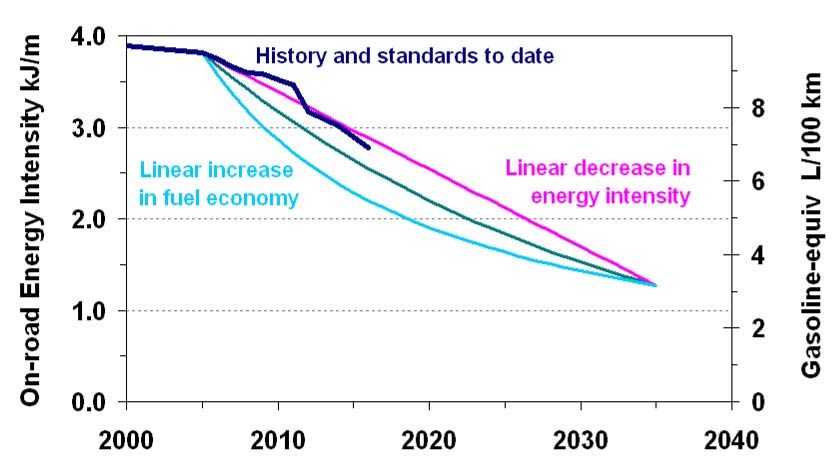
Table of Contents

EXECUTIVE SUMMARY                                                    iii
     Harnessing Real-World Progress                                  iii
     Getting from Here to There                                        v
     Costs and Savings Estimates                                      vi
     Large Benefits; Cost and Consumer Interest Challenges           vii
ACKNOWLEDGEMENTS                                                     viii
INTRODUCTION                                                           1
      Auto Efficiency and GHG Emissions                                1
      Efficiency in the Context of Other Options                       3
      Overview of Report                                               4
PAST EFFICIENCY-RELATED TRENDS                                         5
      Steady Gains in Technical Efficiency                             6
      Performance's Efficiency Penalty                                 7
EFFICIENCY OPPORTUNITIES                                               8
      Compatible as well as Technical Solutions                        9
            Toward Virtual Performance                                10
            The Challenge of Performance Expectations                 10
      Technologies for Efficiency                                     12
            Tractive Load Reduction                                   12
            Powertrain Efficiency                                     15
SYNTHESIS OF TECHNOLOGY ASSESSMENTS                                   19
     Incremental vs. Fundamental Analysis                             20
             Incremental Approach for Justifying Regulations          20
             Fundamental Analysis for Future Horizons                 21
     Rates of Technology Change                                       24
     New Fleet Scenarios                                              27
COST OF EFFICIENCY IMPROVEMENT                                        30
      Interpreting Cost Estimates                                     30
      Cost Curves                                                     32
      Net Present Value Results                                       35
              Automakers Invest, Consumers Save                       37
              Sensitivity Analysis                                    38
CONCLUSIONS                                                           41
APPENDIX: COST CURVE DERIVATIONS                                      43
     Adjusting the Cost of Weight Reduction                           46
     Cost Curve Shifts Through Time                                   47
     Costs of Percentage Changes in Fleet Average Energy Intensity    48
REFERENCES                                                            49

                                              i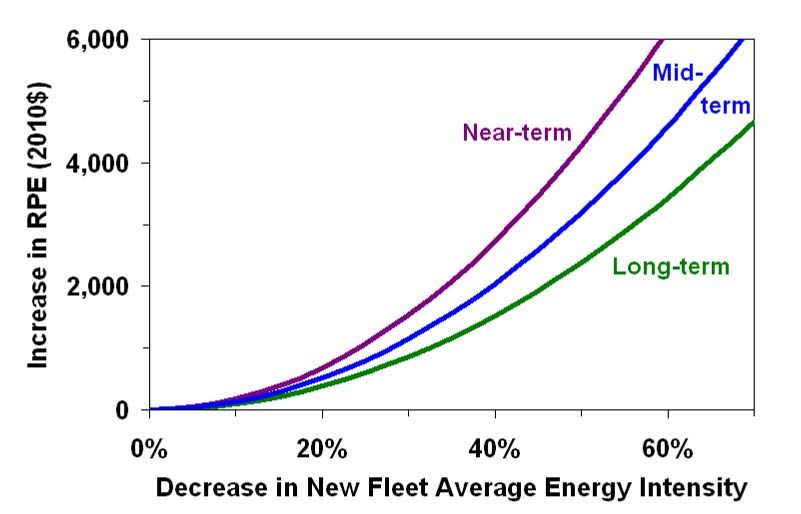
List of Tables
1. Projected horizon for fuel efficiency, fuel savings and CO2 reductions for a v
U.S. light duty gasoline and diesel vehicle fleet
2. Design strategies for automotive energy efficiency 9
3. PNGV concept car fuel economy and consumption results 23
4. Light duty fleet average energy intensity and related metrics: reference levels 29
and future targets based on fuel efficiency horizon scenario
5. Cost and benefit results for fuel efficiency horizon scenario 36
6. Sensitivity analysis results 39
List of Figures
1. New fleet efficiency horizon compared to history and recent regulations iv
2. Technology costs and fuel savings leading to tripled efficiency by 2035 vii
3. GHG emissions breakdown for an average U.S. light vehicle 1
4. Per-vehicle incremental costs and GHG reductions for automotive technologies 3
in a 2035 time horizon, based on MIT (2008)
5. PSFI for new cars and light trucks, 1977-2005 6
6. Trends in engine specific power and vehicle power-to-weight ratio 15
7. Costs of energy savings implied by the MY2012-16 Joint Rule 20
8. Potential gasoline vehicle energy intensity reductions achievable by 2030 22
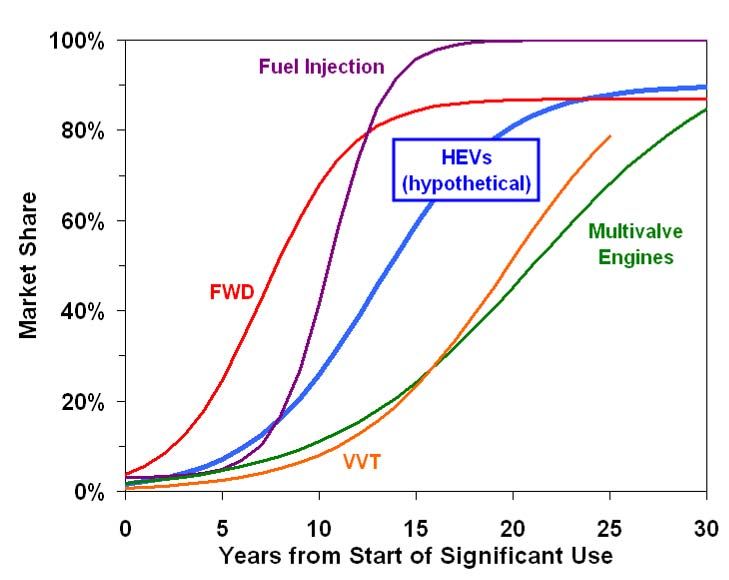
9. Notable historical rates of technology utilization with logistic fits 25
10. Hypothetical market adoption curve for hybrid drive compared to logistic 26
curves based on historical automotive technology adoption rates
11. Scenarios for new fleet energy intensity toward tripled efficiency target 28
12. Transaction prices and price index for new vehicles in the United States 31
13. Average costs of light vehicle energy consumption reduction from quadratic 33
approximations to results of recent studies
14. Cost curves for horizons of automotive efficiency improvement 35
15. Acceleration performance and effect on the cost of consumption reduction 40
A-1. Cost increase vs. consumption decrease for selected studies 43
A-2. Costs and quadratic fits for cars and light trucks based on MIT study 44
A-3. Normalized plots of cost increase vs. consumption decrease 45
ii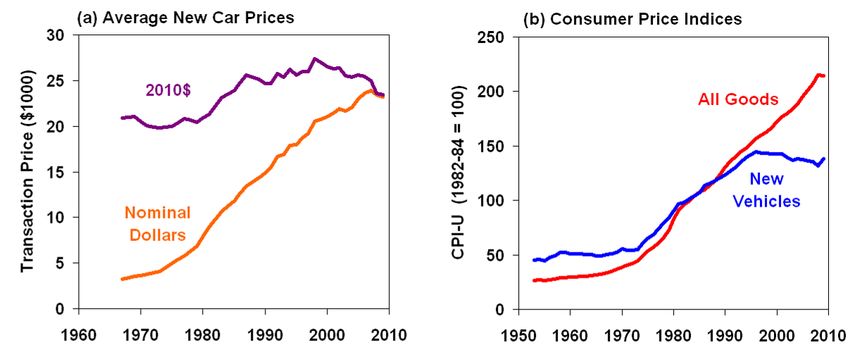
A Fuel Efficiency Horizon for U.S. Automobiles

EXECUTIVE SUMMARY
Improving automotive fuel efficiency is an important way to address transportation oil demand
and greenhouse gas (GHG, "carbon") emissions. In the United States, new light duty vehicle fuel
economy rose nearly 70% after the 1970s energy crisis but then changed little over the 1985-
2005 period. Recently, rises in oil prices and concerns about climate disruption have led to
stricter fuel economy and automotive GHG emissions standards. The single national program
finalized in April 2010 targets a 38% increase in fuel economy, for a projected new fleet average
of 34 miles per gallon (lab-test mpg) by 2016 or a 27% decrease in energy intensity (energy use
per distance driven) and tailpipe carbon dioxide (CO2) emissions compared to 2005.

Fuel efficiency is only one element of a complete transportation sector climate policy, which
must also address travel demand and the net carbon balance of fuel supply. Nevertheless, in light
of its important role, a key question is just how far fuel efficiency can progress over the coming
decades. Given a stock turnover period of roughly 15 years, the new fleet efficiency horizon for
2035 is relevant for helping meet mid-century GHG emissions targets. This study examines how
far automobile efficiency can be taken if it is pursued with determination, using an analysis that
assumes success in technology and design strategies that offer "revolution by evolution."

Many analyses highlight alternative technologies for replacing internal combustion engines and
petroleum-based fuels, such as grid-based vehicle electrification, biofuels, hydrogen or natural
gas. Others point to radical changes in vehicle materials and design. Proponents of these options
marshal technological optimism in scenarios that show how their alternatives will revolutionize
the automobile. While such options mature, it will be crucial to pursue evolutionary advances in
existing systems, which can be greatly improved at cost, but at much less cost and with none of
the other barriers faced by alternative technologies.

Harnessing Real-World Progress
This study focuses the lens of technological optimism on evolutionary changes in automobiles
that still rely on internal combustion engines and largely steel-based structures. Technologies
considered include turbocharged gasoline direct-injection engines, low-emission diesels, a range
of hybrid drive options (but not "plugging in"), advances in lightweight steel and other mass-
efficient material and design solutions. Assumed rates of progress are based on what has been
observed historically in the auto market, where innovation is relentless even when not focused on
fuel efficiency. The analysis assumes competitively driven advances in engineering, with cost
reductions achieved through budget-constrained product development and productivity gains as
witnessed in all aspects of vehicle manufacturing.

Automotive engineering has always seen continuous progress; at issue is the extent to which it is
harnessed for fleetwide efficiency as opposed to other market outcomes. It is this factor -- the
emphasis on reducing fuel consumption relative to different goals -- that more than any other
will influence the direction of the fleet over the first half of the 21st century. In short, improving
auto efficiency is as much a matter of design priority as it is one of technology change.

                                                  iii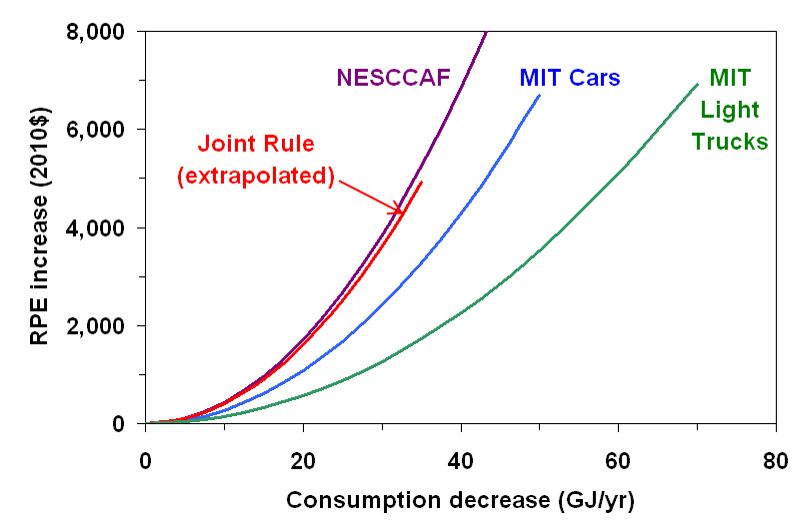
Many studies analyze the ways to improve vehicles along energy-related dimensions including
powertrain efficiency and load reduction. This report does not perform new detailed engineering
analysis, but rather synthesizes published results under an assumption that efficiency gains from
evolutionary technology changes are maximized on a fleetwide basis. New features of this study
include highlighting the role of efficiency-compatible product planning strategies in addition to
the technology options usually analyzed; fitting historical technology changes to logistic curves
to identify rapid but feasible adoption rates for key new technologies; and modeling costs using
quadratic functions of energy consumption reduction that shift through time.

The conclusion is that a tripling of new fleet fuel economy is an ambitious but defensible horizon
for 2035. Figure 1 shows the resulting trajectory in terms of new fleet average energy intensity
(kilojoules per meter, kJ/m, similar to Btu/mile), with historical averages and the levels implied
by recent regulations shown for comparison. The right-hand axis gives corresponding nominal
fuel consumption rates (liters per 100 kilometers, L/100km, based on unadjusted lab tests), which
fall from 9.5 L/100km to 3.2 L/100km over the 25 year horizon 2005-2035. Historically, a drop
of comparable magnitude (roughly 6 L/100km) happened over 12 years, 1975-1987. In terms of
nominal, lab-test fuel economy, this trajectory would take the new U.S. car and light truck fleet
from 25 mpg in 2005 to 74 mpg in 2035, implying an improvement from 20 mpg to 60 mpg in
terms of estimated on-road ("real world") fuel economy.

The assumed rates of technological progress, particularly for the degree of hybridization likely to
be needed, are in line with those of some major automotive technology changes in the past. The
challenge is cost, which rises steadily as greater use of advanced technology is required.
Nevertheless, projected fuel savings greatly exceed upfront costs and this evolutionary horizon
remains less costly than revolutionary changes in vehicles based on electric grid connection,
hydrogen or other alternatives that entail extensive new infrastructure.

 Figure 1. New fleet efficiency horizon in terms of energy intensity and fuel consumption
           rate compared to historical fleet averages and recent U.S. regulations

 Energy intensity is estimated on-road value in kilojoules per meter (kJ/m) assuming 20% fuel economy shortfall
 for all years. Right axis gives nominal (lab-test) fuel consumption rate in liters per hundred kilometers (L/100km);
 convert to miles per gallon (mpg) by dividing L/100km into 235.2. See Table 1 for further details.

                                                          iv
Table 1. Projected horizon for fuel efficiency, fuel savings and CO2 emissions
reductions for a U.S. light duty gasoline and diesel vehicle fleet
New Light Duty Fleet Averages Base & Current Year Trajectory by Model Year
and Per-Vehicle Estimates 2005 2010 2020 2025 2030 2035
Energy intensity (on-road kJ/m) 3.81 3.52 2.20 1.83 1.53 1.27
reduction in energy intensity 0% 8% 42% 52% 60% 67%
Fuel economy (unadjusted mpg) 25 27 43 52 62 74
on-road (adjusted) mpg 20 22 34 41 50 60
CO2 emissions (g/mi, with A/C) 358 330 192 157 128 104
Lifetime fuel savings (gallons) 590 3,264 4,039 4,696 5,254
Lifetime CO2 reduction (tons) 5 29 36 42 47
Fuel savings benefits (2010$) 5,600 6,900 8,000 8,800
Technology costs (2010$) 2,600 3,400 4,000 4,200
Net Present Value (2010$) 3,000 3,500 4,000 4,600
Assumptions: shadow price of fuel $2.88/gal (2010$); 20% fuel economy shortfall; 7% discount rate; 10% rebound
effect. The CO2 emissions rate reflects subtraction of potential air conditioning (A/C) reductions starting in 2020.
Lifetime fuel savings are undiscounted gallons of gasoline equivalent (gge) and CO2 reductions are direct (tailpipe only)
metric tons, both relative to the 2005 base year fleet; dollar values are rounded; see Table 5 for further details.
Although it may seem high, a tripled efficiency horizon can be viewed as having been validated
by the Partnership for a New Generation of Vehicles (PNGV) program. The PNGV concept cars
shown a decade ago demonstrated a factor of 2.6 increase in fuel efficiency with prototype diesel
hybrid powertrains less advanced than today's. Since then many technologies have not only been
developed, but also progressed into commercialization and its attendant stages of competitively
driven refinement and cost reduction. Although performance has risen, so has technological
capability. Thus, tripled efficiency is indeed attainable by 2035, a time frame more than three
decades after the PNGV delivered proof-of-concept cars approaching that goal.
Getting from Here to There
Table 1 summarizes the results of a scenario leading to tripled efficiency by 2035. The analysis
works forward from a 2005 base year fleet, with new fleet average energy intensity declining at a
compound rate of 3.6% per year (a 3.7% per year fuel economy increase). By comparison, the
recent Joint Rule for 2012-16 requires a fuel economy increase averaging 4% per year between
now and 2016. By 2025, the trajectory shown here reaches a nominal 52 mpg, or a doubling of
fuel economy compared to the 2005 fleet. For fleet average GHG emissions rates, given here
after subtracting the reductions likely to be feasible with improved air conditioning systems, the
trajectory implies 157 CO2-equivalent grams per mile (g/mi) in 2025 and 104 g/mi in 2035.
To project this horizon, this analysis uses results from studies that assess particular technologies
such as advanced engines and hybrid drive. As interpreted here, however, these options are used
only as an existence proof of the potential for high fuel efficiency rather than as a literal
technology pathway to be implemented. Thus, the view is technologically agnostic and reflects
opportunities identified through engineering fundamentals.
vThat being said, extensive use of hybrid drive appears necessary for tripling fleet efficiency.
High utilization of hybrids could be reached by 2035 if their adoption rate is greatly increased,
with associated implications for increased cost. The hybrid adoption rate assumed here is faster
than in MIT's studies but still mid-range among those observed historically (see Figure 10).
Reliance on hybrids could be lower if greater progress is seen in mass reduction, other ways to
reduce loads and recover energy, use of start-stop, additional refinements of gasoline and diesel
engines (including lean emissions control) and other advanced combustion techniques.
A central assumption is that going forward, essentially all energy-related technology advances
are focused on fuel efficiency rather than further boosting average acceleration performance. A
sensitivity analysis shows that if performance instead rises in line with past trends, then the 2035
horizon drops to doubled rather than tripled fuel efficiency. Performance enhancement consumes
technological capability and so achieving greater progress on fuel efficiency means redirecting
market trends and customer preferences away from ever more mass and muscle.
Mindful of this challenge, it will be valuable for automakers to pursue what this study terms
efficiency-compatible design strategies in addition to the technical efficiency improvements
commonly considered. Compatible strategies are approaches for both individual vehicles and
product plans that enhance customer value by emphasizing features that are not inherently fuel
consumptive. Such options include intelligent systems content, matching performance to real-
world driving needs, creative downsizing, interior packaging and styling -- in short, appealing to
consumers in ways that are in line with, as opposed to work against, fuel efficiency.
Costs and Savings Estimates
To estimate the costs of pursuing the efficiency horizon given here, estimates from recent studies
were synthesized into cost curves (Figures 13 and 14 in the main text). These curves were chosen
to be quadratic in energy intensity reduction, reflecting an increasing marginal cost for each step
of additional fuel savings. They were also modeled to shift rightward as time goes on, reflecting
progress toward lower costs for achieving a given level of fuel savings overall.
The near-term curve was derived from costs estimated for the Model Year 2012-2016 Joint Rule.
Long-term cost estimates were derived using a recent study by MIT, which reflects steady gains
in efficiency by optimizing internal combustion engines and hybrid drive along with declining
costs for advanced powertrain components. Those findings imply a long-term (2035) cost curve
much lower than the near-term curve. Both near- and long-term curves were adjusted downward
based on studies by the steel industry and Lotus Engineering. In interpreting those findings, this
report assumes that evolutionary mass reduction (reaching 20% by 2035) can be obtained at no
net cost, in contrast to a presumption that saving weight always adds cost.
Figure 2 shows the incremental technology costs and discounted lifetime benefits for the new
fleet by model year. Benefits related to fuel savings mainly depend on the pre-tax price of fuel,
assumed to average $2.50 per gallon. Benefits also include avoided CO2 emission and oil import
externalities valued at $22/ton CO2 and $7.50 per barrel, respectively. The difference between
benefits and costs is the net present value (NPV) listed in the last row of Table 1. NPV grows as
time goes on, reaching $3,500 in 2025 and $4,600 by 2035 (all costs are given in 2010$).
Base case technology costs are $3,400 in 2025 and $4,200 in 2035. Sensitivity cases with more
and less optimistic assumptions yield costs ranging from $3,200 to $4,000 respectively in 2025
viand ranging from $3,800 to $5,700 in 2035. Figure 2. Technology costs and fuel savings
The NPV results vary accordingly, though benefits leading to a new fleet of
lifetime savings still significantly exceed tripled efficiency by 2035
costs in all cases (see Table 6 for details).
Large Benefits; Cost and Consumer
Interest Challenges
The technology costs of achieving the fuel
efficiency horizon projected here are large
even though they are exceeded by the energy
savings and also provide substantial non-
monetary value in terms of reduced GHG
emissions. Pursuing this trajectory may
require ways to better reconcile the upfront
costs, largely borne by automakers, with the
substantial but diffuse benefits that accrue to
consumers over vehicle lifetimes.
The more that consumers can be interested in ongoing efficiency gains -- or at least have their
interests pulled toward amenities that conflict less with fuel efficiency -- the easier it will be for
automakers to invest in the technology and design changes needed. New efforts to engage
consumers in fuel efficiency in spite of the vagaries of fuel prices will therefore be crucial. The
auto market cannot expect to "have it all," that is, to see significant ongoing gains in power
performance and other energy-impactful vehicle amenities while affordably achieving high
levels of fuel efficiency.
A key implication of this analysis is that a great deal of progress can be made with evolutionary
design and technology changes even though the exact mix of vehicle designs and technologies
involved cannot be projected. Therefore, public efforts to foster interest in higher fuel efficiency
should be technology neutral rather than promoting politically popular alternatives that are likely
to be much less cost effective for reducing petroleum demand and limiting GHG emissions from
the automotive fleet.
Attaining this fleetwide fuel efficiency horizon will entail a sustained effort to make efficiency
improvement a high priority both in individual vehicle design and in automakers' overall product
strategies as well as by consumers and policymakers. Policy guidance is clearly needed, although
identifying the best set of policies is left for other work. Effective climate protection will also
require greatly reducing the net GHG impact of fuel supply as well as attention to travel demand
and other factors within the transportation sector and across the economy as a whole. In any case,
if the fuel efficiency horizon identified here is achieved or even approached, the benefits will be
substantial for both protecting the climate and reducing of oil dependence.
viiACKNOWLEDGEMENTS
The author wishes to thank the individuals who provided peer-review comments and suggestions
on earlier drafts of this report. Reviewers included: Randy Armstrong, Roland Hwang, David
Friedman, John German, Jack Jordan, Walt Kreucher, Therese Langer, Michael Love, Nicholas
Lutsey, Don MacKenzie, Sue Zielinski and Marty Zimmerman. Comments reflected diverse
views, not all of which were fully accommodated, and so the author retains full responsibility for
the results and conclusions contained in this report. The author is also most grateful to The
Energy Foundation for its support of the work.
viiiA Fuel Efficiency Horizon for U.S. Automobiles
Introduction
Perennial concerns about energy security and growing concerns about climate disruption
motivate measures to transform transportation energy use. Because it reduces fuel demand,
improving vehicle energy efficiency is one way to address such issues. In the United States,
automobiles (cars and light trucks) account for 60% of transportation energy use (Davis et al.
2009). Their dominance has made them a focus of efforts to improve efficiency and develop
alternatives. Corporate Average Fuel Economy (CAFE) standards established in response to the
1973 oil embargo contributed to a near doubling of new car fuel economy by 1985.
Market forces then worked against efficiency for most of the next two decades. The new fleet
mix shifted from passenger cars to less fuel-efficient light trucks, which came to comprise half
the fleet by 2004. Nevertheless, measured by estimated on-road fuel economy, the U.S. light
vehicle stock was roughly 50% more efficient in 2005 than it had been in 1975. The new fleet in
2005 averaged 19.9 miles per gallon (mpg) according to EPA's adjusted estimates, barely more
than the on-road stock average of 19.7 mpg estimated by FHWA (2006). In nominal (unadjusted
lab-test) terms as used for regulatory purposes, the 2005 new light duty vehicle fleet stood at
24.8 mpg and 358 g/mi CO2 (EPA 2009).
Fuel economy is the inverse of fuel consumption, which in turn maps to a travel activity-based
measure of vehicle energy intensity such as Btu/mile or MJ/km. Important impacts of concern --
whether petroleum demand, CO2 emissions or consumer operating cost -- scale with energy
intensity, making it an ideal metric for analysis. Although fuel economy is commonly used in the
United States, its inverse relationship to energy-related impacts can distort one's view. Thus, this
report presents key results in terms of energy intensity, or "tank to wheels" consumption rate.
AUTO EFFICIENCY AND GHG EMISSIONS
Figure 3. GHG emissions breakdown for
The overall GHG emissions associated with an average U.S. light vehicle
motor vehicles result from two intersecting
product lifecycles. One is the "cradle-to-
grave" materials cycle for production and
disposal of the vehicle and its components.
The other is the "well-to-wheels" lifecycle for 70% Tailpipe
production and consumption of motor fuel. "Cradle to
Figure 3 shows the breakdown for a typical 10% Grave"
Vehicle
U.S. light duty vehicle of today running on Materials
gasoline. About 70% of the combined 20%
lifecycle GHG emissions is from the tailpipe
"Upstream"
during vehicle operation (end use); 20% Fuel Production
occurs upstream during fuel production; and
10% is associated with the materials cycle for Source: Rounded values based on 20 mpg in-use fuel
the vehicle and its components. economy, 150,000 miles lifetime usage, and lifecycle
estimates from Burnham et al. (2006).
1For a given fuel, end-use emissions (largely tailpipe CO2) depend on fuel chemistry and so are
directly proportional to vehicle energy intensity. Upstream ("well to tank") emissions also scale
with the rate of fuel consumption. Thus, 90% of the CO2 emissions for today's vehicle-fuel
system are tied to vehicle energy intensity and so represent the potential reductions that can be
leveraged by improving automotive end-use efficiency.
This report gives on-road ("real world") estimates for energy intensity in kilojoules per meter
(kJ/m = MJ/km = 1.525 kBtu/mile). It also reports gasoline-equivalent fuel economy (mpg), fuel
consumption (L/100 km) and tailpipe CO2 emissions rates (g/mi), with these latter three metrics
given using nominal values (as derived from EPA unadjusted 55% city, 45% highway driving
cycle laboratory tests) unless otherwise stated. The historical fuel economy gain noted above
took the new U.S. car and light truck fleet from 15.3 mpg in 1975 to 25.9 mpg by 1987 in terms
of nominal fuel economy (EPA 2009, Table 1). The entire light duty stock saw a net gain from
13.3 mpg in 1975 to 19.7 mpg by 2005 in terms of estimated on-road fuel economy (DeCicco et
al. 2007, Table A-1), corresponding to the 38% decrease in energy intensity from 6.2 kJ/m in
1975 to 3.8 kJ/m in 2005 as illustrated earlier in Figure 1.
Modest efficiency improvements may be acceptable, as they historically have been, in an energy
security context. Energy conservation is part of a U.S. policy response that otherwise emphasizes
measures oriented to energy supply, including military and diplomatic activities to secure access
to foreign sources of petroleum and facilitate oil imports; expanding domestic petroleum
production; tapping remote and unconventional fossil resources; and promoting alternatives such
as biofuels, electricity and hydrogen. However, as climate protection rises in importance as a
policy concern, the magnitude of the challenge related to unmitigated consumption of carbon-
based fuels is amplified. Science-based targets for limiting GHG concentration imply ambitious
goals, such as an 80% reduction in U.S. GHG emissions relative to recent levels by 2050
(USCAP 2007; White House 2009). Such goals indicate a need for much greater change in the
transportation energy system along all dimensions, including vehicle efficiency.
To date, regulation to improve vehicle efficiency has proven to be both politically acceptable
(though of uneven implementation) and measurably effective among the various options for
addressing transportation energy use. NRC (2002) found that CAFE standards contributed to fuel
savings that reached 2.8 million barrels per day (6.3 EJ) by 2000. These savings amounted to
25% of U.S. automobile fuel demand (the policy's direct target) and 12% of total U.S. petroleum
demand. CAFE standards have also proven to be cost effective. As a leading analyst concludes,
"although numerous hypothetical and theoretical objections to CAFE have been raised, tangible
evidence of significant negative effects is lacking" (Greene 1998: 595).
As energy-related concerns returned to prominence in recent years, policymakers again turned to
regulation, as seen in the recent California and Federal initiatives on GHG emissions and fuel
economy respectively. Efforts converged in a single national program, the EPA & NHTSA
(2010) Joint Rule for model years 2012-16, which requires a 27% average reduction in new light
vehicle energy intensity from the 2005 level. The agencies recently announced a plan to develop
a next round of standards to cover model years 2017-2025 (EPA 2010).
2Figure 4. Projected per-vehicle incremental costs and GHG reductions for future
automotive technologies in a 2035 time horizon, based on MIT (2008)
Source: MIT (2008), Table ES-1 and Figure ES-1(b). Area shaded (by author) covers options based on vehicle
efficiency only that do not require major changes in fuel supply system. Technologies are: NA SI = naturally
aspirated spark ignition; Turbo SI = turbocharged spark ignition; Diesel = turbocharged compression ignition;
HEV = hybrid-electric vehicle with NA SI engine; PHEV = plug-in hybrid-electric vehicle with NA SI engine;
FCV = hydrogen fuel cell vehicle; BEV = battery electric vehicle. All future options assume a streamlined, 20%
mass-reduced vehicle platform. Costs (retain-price equivalent) and full vehicle+fuel lifecycle GHG reductions
(metric tonnes) are shown relative to a 2006 midsize car (origin of axes).
EFFICIENCY IN THE CONTEXT OF OTHER OPTIONS
While clearly important, auto efficiency represents an incomplete focus for addressing energy
and climate issues. Automobiles are but one mode of transportation, which is in turn but one
sector of the economy. Efficiency is but one factor that determines oil demand and GHG
emissions, others being travel demand and the fuel supply system. Most analyses include
automobile efficiency improvement as one part of a broader set of opportunities to be pursued
(Greene & Shafer 2003; Cambridge Systematics 2009). Particularly for climate protection, it is
important to address regulations and other measures that target vehicle efficiency within a policy
framework capable of linking vehicle efficiency needs to overall GHG limitation goals while
balancing its benefits and costs against those of the other factors that determine emissions
(DeCicco 2010).
In terms of the vehicle-fuel system, reducing the net carbon impact of fuel supplied is crucial.
Biofuels encompass many options, but just what their net benefits are and even how to properly
evaluate them in light of globally coupled energy and terrestrial systems remain open questions.
Some analysts advocate all-electric drive, which is also seen as a basis for "reinventing" the car
(Sperling 1996; Mitchell et al. 2010). Although expensive because of inherently high materials
costs for batteries and other components, electrification improves end-use efficiency relative to
current vehicles because thermodynamic losses are either shifted to the electric supply system
(for grid-connected electric vehicles) or avoided (for fuel cell vehicles, though other losses
occur). Such "carbon free" energy carriers are now more carbon intensive than petroleum-based
3fuels per unit of energy supplied. For current vehicles the efficiency of electric drive more than
compensates. However, this advantage greatly narrows if internal combustion engine vehicles --
including grid-free hybrids -- see their efficiency greatly improve, as seen above in Figure 4 and
further elaborated in this report.
Vehicle-fuel systems are commonly analyzed on a "well-to-wheels" basis, reflecting the effects
of both vehicle efficiency and fuel carbon (GHG) intensity. For gasoline, a typical "well-to-tank"
carbon intensity is 94 gCO2eq/MJ, reflecting the 70% + 20% tailpipe + upstream portion of the
breakdown shown in Figure 3. For electricity, the emissions all occur upstream during power
distribution and generation. U.S. electricity remains half based on coal, resulting in a current
average carbon intensity of 177 gCO2eq/MJ (2010 extrapolation based on data from eGrid and
Electric Power Annual [EPA 2010b; EIA 2010]). Although electricity is now nearly twice as
carbon intensive as gasoline per unit of energy supplied, its GHG emissions intensity has been
trending downward as generation efficiency improves and coal's share slowly declines. In
contrast, the GHG emissions for gasoline production are creeping upward as supply turns to
heavy crudes, oil sands and other unconventional resources (Brandt & Farrell 2007).
The MIT (2008) analysis applies assumptions for fuel cycle GHG emissions that are cautious and
consistent across sectors, using EIA (2007) reference-case projections for electricity generation
mix and natural-gas-based hydrogen production over the next 30 years. Over this horizon, MIT
analysts see the potential for substantial (yet non-breakthrough-dependent) progress in gasoline
internal combustion vehicles (including grid-free hybridization). Figure 4 plots the resulting
estimates of incremental vehicle costs against lifetime reductions in GHG emissions. The point
of reference (origin of graph) is a 2006 midsize car rated at 26.4 mpg (8.9 L/100km unadjusted;
3.6 kJ/m on-road) having lifetime GHG emissions of 69 tonnes (metric) and a retail price of
$20,500 (2010$). Thus, the hybrid-electric vehicle (HEV) estimate, for example, is that a lifetime
reduction of 42 tonnes (61%) would be achieved at an added vehicle cost of $4,700.
The shaded band in the lower portion of the graph highlights an evolutionary pathway that does
not require major investments in fuel supply and distribution infrastructure. MIT's "apples-to-
apples" comparison finds that improving efficiency is the least costly way to cut transportation
GHG emissions for the foreseeable future. As seen in Figure 4, BEVs and FCVs offer no
advantage over optimized grid-free HEVs as long as both the liquid and electric energy supply
systems remain largely based on unmitigated use of fossil fuels. These results buttress this
paper's focus on vehicle efficiency while leaving for other discussions the many issues
surrounding alternatives (such as electricity, hydrogen and biofuels), which their proponents
believe are essential for the future even if more costly at present.
OVERVIEW OF REPORT
The report provides context for the issue by reviewing past trends in fuel economy and related
attributes. The achieved level of fleetwide efficiency results as much from design choices made
about how to harness innovation as it is about technology innovation itself. Progress in
automotive engineering is ongoing but often used to offer features other than higher fuel
economy. This realization suggests a broader way to view options for improving efficiency. The
concept of "efficiency compatible" solutions is introduced to complement the evaluation of
technical solutions, emphasizing the perspective fact that vehicle efficiency improvement is as
much a matter of design priority as it is of technology adoption.
4With this perspective in mind, the report turns to a synthesis of previously published technology
assessments in order to project a long-term (2035) efficiency horizon. The discussion
distinguishes incremental versus fundamental approaches to analysis, relying on the latter to
identify a large potential for efficiency gain through evolutionary technology change with a
proviso that further gains in fleet-average performance are foregone. The analysis then examines
rates of technology adoption, finding that the rate of hybridization likely to be needed is
comparable to the rates at which some major technology changes occurred in the past. Although
high utilization of hybrid drive is a part of the efficiency horizon "existence proof," the
interpretation given here is technology neutral. While many studies identify specific technology
"pathways," this study emphasizes that the technology mix should not be taken literally and that
automotive engineering offers a range of solutions for realizing fundamental efficiency gain.
Turning to cost issues, the report draws on recent studies that reflect the reductions in cost
available through evolutionary strategies. In keeping with the fundamental, technologically
agnostic engineering assessment, costs are treated at a highly aggregate level using quadratic cost
curves. Such curves fit previously published detailed cost estimates reasonably well while
reflecting an assumption that marginal costs grow linearly as each next step of energy intensity
reduction is sought. Technology costs are compared to benefits based on fuel savings evaluated
over the lifetime of the new fleet. Although the lifetime benefits exceed costs, the fact that costs
grow steadily raises questions regarding the extent to which automakers can recoup the upfront
costs of technology improvement. A final section examines the sensitivity of the results to
differing assumptions.
Compared to the prior literature on automotive efficiency, this report presents three new ways of
thinking about the issue. One is highlighting the primacy of design priority in shaping the future
of the fleet. If high priority is given to efficiency improvement, then efficiency-compatible
product planning strategies should be considered in addition to the technology strategies usually
analyzed, and high fuel efficiency levels identified by fundamental engineering analysis can be
realized. Another contribution is applying logistic curves based on fits to historical technology
change in order to develop ambitious but plausible rates of adoption for hybrid drive. A third
new approach is modeling fleetwide costs using quadratic functions of energy savings that shift
through time. The development of these curves is detailed in the report's Appendix.
Past Efficiency-Related Trends
It is now well appreciated that until very recently, most of the past two decades' advances in
automotive engineering went toward delivering faster performance, greater carrying capacity and
numerous amenities in addition to lower tailpipe emissions of non-GHG pollutants and better
crashworthiness. EPA's Fuel Economy Trends reports (EPA 2009 and earlier editions) document
how car and light truck fleet characteristics evolved with increasing horsepower while new fleet
fuel economy slowly declined from its 1987 peak until recent improvements started in 2005.
Historical U.S. new fleet fuel economy was shown in Figure 1; more detailed charts of the trends
are published by EPA (2009) and so are not repeated here.
5STEADY GAINS IN TECHNICAL Figure 5. PSFI for new cars and light trucks,
EFFICIENCY 1977-2005
This report uses fuel efficiency 170
synonymously with fuel economy. The CARS
150 y = 3.557x - 6960
term technical efficiency is used here to
PSFI (hp/lb)·size·mpg
2
r = 0.992
denote the broader notion of how
efficiently a vehicle provides other 130
amenities such as carrying capacity and
110
acceleration performance. While fuel
efficiency did not improve for many years, 90
technical efficiency did improve and
historical data reveal that such LIGHT TRUCKS
70 y = 2.028x - 3949
improvements have been quite steady. To 2
r = 0.974
measure technical efficiency gains, An & 50
DeCicco (2007) developed a Performance- 1975 1980 1985 1990 1995 2000 2005
Size-Fuel-economy Index (PSFI), which
provided a strong linear correlation to Source: An & DeCicco (2007); PSFI = Performance - Size -
Fuel Economy Index, with size measured as interior volume
historical data for these variables. for cars and wheelbase for light trucks.
Figure 5 shows PSFI results for the new
car and new light truck fleets. Relative to a 1977 base year, the index shows average rates of
increase of 5.3% per year for cars and 3.1% per year for light trucks. These estimates average out
to a historical technical efficiency gain of 4.2% per year for the light duty fleet as a whole.
The PSFI trends can be interpreted as revealing an intrinsic rate of technological progress on
vehicle energy efficiency. Automakers appear to adopt efficiency-related technology at a steady
rate whether or not that progress is used to achieve net gains in fuel economy. Such findings are
in line with other analyses that examine the trade-offs between reducing fuel consumption and
increasing other vehicle attributes such as weight and performance (Cheah et al. 2008).
EPA (2009) documents an ongoing gain in a weight-fuel economy metric (ton miles per gallon)
and also examines the effects of weight, performance and vehicle size mix on potential fuel
economy. For example, using 1981 weight and performance distributions, EPA calculated that
2005 cars and light trucks would have had fuel economy levels 26% and 34% higher,
respectively, than actual 2005 values. Examining changes in new fleet mix, size, performance
and weight, Greene & Fan (1994) found nearly linear technological progress equivalent to 0.6
mpg per year for cars, corresponding to a 3.8% per year rate of technical efficiency gain relative
to a 1975 base. Referenced to 1980 levels and controlling for horsepower, torque and weight,
Knittel (2009) estimated that light vehicle fuel economy could have been 50% higher in 2006
than it actually was.
These overall technical efficiency trends correspond to observed gains in engineering figures of
merit. A key metric is engine specific power, or peak power per unit of engine displacement as
measured in kilowatts per liter (kW/L), for example. It also exhibits a strikingly linear trend (see
Figure 6 later in this report), with estimated rates of gain of 5.5% per year for cars and 4.3% per
year for light trucks (An & DeCicco 2007). Lutsey & Sperling (2005) identified steady trends in
progress for other efficiency-related engineering metrics, including aerodynamic drag and rolling
resistance as well as engine performance.
6An & DeCicco (2007) concluded that one implication of a linear PSFI trend is that higher levels
of performance and size imply a lower level of potential fuel economy gain, at least as long as
the intrinsic rate of progress is maintained at the historically observed rate. Mathematically,
letting P = performance, S = size, F = fuel economy, and t = time, a linear PSFI trend can be
represented as
PSFI(t) = P(t)·S(t)·F(t) = αt + β
where α and β are the slope and intercept of the trend line. Partial differentiation then yields
∂F/∂t = α/(P·S)
which implies that the rate of trend-consistent progress on fuel economy is inversely proportional
to achieved levels of performance and size. In other words, ongoing gains in performance and
size "use up" technical progress on vehicle efficiency, and so a significant portion of the intrinsic
potential for improving fuel economy is lost.
PERFORMANCE'S EFFICIENCY PENALTY
The foregoing analysis underscores the efficiency-performance trade-off likely to be faced in the
years ahead. For example, although the potential for fuel economy gain at constant size and
performance was 4.2% per year relative to the 1977 new fleet, it falls to 2% per year relative to
2005 fleet levels of size and performance (based on An & DeCicco 2007, Table A1).
This effect is dominated by acceleration performance. Either technological progress more rapid
than historically observed or a relaxation of fleet average performance levels is needed to realize
fuel economy gains at rates similar to those based on past trends. Increasing the rate of
technological progress suggests increasing costs, an inference borne out later in this report by the
rising costs projected for advancing the fleet toward the efficiency horizon identified.
Conversely, cost impacts would be moderated if performance expectations are moderated.
Rising acceleration performance penalizes potential fuel efficiency gain because it prevents
advances in powertrain engineering from being utilized in ways that significantly improve the
part-load efficiency of the engine-transmission system. Hybrid drive mitigates this trade-off, but
also comes at a greater price than conventional powertrain refinements. Thus, speeding up the
rate of fleetwide fuel economy gain through hybridization is consistent with the cost implications
just noted.
The performance penalty can be seen in the lack of progress in automobile tractive efficiency,
which is the fraction of fuel energy ultimately delivered to the wheels for overcoming the basic
forces of vehicle motion. These forces -- in energy terms called tractive loads -- are aerodynamic
drag, tire rolling resistance and the dissipation of kinetic energy through braking. The tractive
efficiency of a typical late-model U.S. passenger car is only about 16% (for a 2006 midsize
sedan; MIT 2008). A similar value of 17% is obtained for a late-model midsize SUV (derived
from graphic in Ponticel 2010). These recent estimates match the 17% estimate made for an
average car of the early 1990s (DeCicco & Ross 1994). As the EPA data show, the 1990-2006
period saw little gain in average fuel economy but a 35% increase in average power-to-weight
ratio. Tractive efficiency had increased significantly in earlier years; it was estimated at 12% for
7an average 1980 car (Gray and von Hippel 1981). From 1980-1990, average new car fuel
economy increased 18% and average power-to-weight ratio increased 25%.
A point of comparison is the brake efficiency of an engine, referring to the energy available at
the engine's output shaft (input to the transmission) relative to the energy in the fuel. It reflects
thermodynamic losses and other heat losses. Peak brake efficiency is attained at an engine's ideal
operating conditions of wide-open throttle and relatively low RPM. For current gasoline engines
peak efficiency is around 35%, or about double the average tractive load efficiency. If engine
efficiency is improved through engineering refinements that reduce frictional losses under part-
load conditions but performance continues to grow, the engine still largely operates at points
well away from peak efficiency and little progress is made on tractive efficiency. That has been
the situation since new fleet fuel economy peaked in 1987. Unless ongoing performance gains
are moderated it will be difficult to increase fuel economy without either incurring much higher
technology costs or making other trade-offs (such as a smaller vehicle mix).
Hybrid drive enables an advance in tractive efficiency by using the electric drive system to
handle a much greater fraction of part-load operation, reserving the combustion engine for
operating conditions closer to its peak efficiency. As MIT researchers point out,
The difference in relative fuel consumption benefit from hybridization between
different vehicles depends mainly on how efficiently the original engine was
operating. A vehicle with a lower average engine load in its non-hybrid version
will have lower average engine efficiency and will thus benefit more from using a
hybrid powertrain. (Kasseris & Heywood 2007: 11)
Higher performance vehicles operate at lower average engine loads in ordinary driving. Kasseris
& Heywood found that hybrid drive reduced fuel consumption by nearly 60% for a higher
performance sedan versus 50% for a lower performance sedan.
Hybrid drive also enables recovering kinetic energy through regenerative braking. Therefore a
more basic measure of tractive efficiency might count only the inherently dissipative forces of
aerodynamic drag and rolling resistance. With such a convention, end-use efficiency would
appear even lower; for example, only 9% of the fuel energy ultimately gets applied to overcome
those two tractive loads for a current average car. Without delving further into possible
definitions of vehicle energy efficiency, suffice it to say that the tractive efficiency metric noted
above suggests ample opportunity for improvement, and that minimizing increases in power
performance is likely to help minimize the costs for making such improvements.
Efficiency Opportunities
The basic principles for improving internal combustion engine vehicle fuel economy have been
analyzed extensively since the issue was elevated by the 1970s oil crises. It comes down to
minimizing the energy loads that must be met while maximizing the efficiency with which the
powertrain (engine-transmission system) converts fuel energy into useful work for meeting the
loads. Even as technology has been expended to improve technical efficiency as seen above,
innovation yields new options to address the same basic challenges of decreasing vehicle loads
and increasing powertrain efficiency.
8Table 2. Design strategies for automotive energy efficiency
COMPATIBLE TECHNICAL
• Creative downsizing and styling • Load reduction
• Intelligent systems content • Engine improvements
• Performance matching • Transmission improvements
• Interior packaging efficiency • Hybrid drive
The main development of significance in recent years is hybrid drive. While long known as an
R&D opportunity, Toyota's 1997 introduction of the Prius placed hybrid drive squarely on the
list of solutions available for evolutionary improvement of vehicle fuel efficiency. However,
technology for efficiency -- which hybridization has come to epitomize -- cannot be evaluated in
isolation from the market and design context that determines not only which technologies are
used but also what benefits they deliver.
COMPATIBLE AS WELL AS TECHNICAL SOLUTIONS
Table 2 offers a holistic look at the ways that automotive product planners can address vehicle
efficiency, identifying what are termed efficiency-compatible design strategies in addition to the
technical strategies commonly analyzed.
Technical strategies entail engineering modifications that raise fuel efficiency while preserving
other vehicle attributes. Compatible strategies involve rethinking design goals for both individual
vehicles and the product mix while exploiting features to enhance customer value in ways that
are less inherently fuel consumptive. Through product planning choices that avoid conflict with
fuel efficiency, or facilitate the ability to apply engineering progress to efficiency rather than
performance, compatible strategies can help automakers minimize the difficult-to-recover costs
of adding technology to improve fuel efficiency beyond the levels that customers might choose
on their own.
Most fuel economy assessments focus on technical options and assume that other vehicle
attributes are constant. However, attributes have not been constant. Indeed, many years of
changes in capacity and performance have been incompatible with fuel economy improvement.
Such attribute changes increase energy loads or prevent powertrain refinements from closing the
gap between peak and part-load engine efficiency. If improving efficiency becomes a priority --
expressed as a shared sense of direction among consumers, automakers and policymakers -- then
all strategies are implicitly on the table even if there are ample technical opportunities to increase
fuel economy without changing other attributes. While the fuel efficiency analysis horizon
developed in this report adheres to the constant performance convention, this discussion
highlights these issues in recognition of the challenges involved and just how much of a
departure from past patterns it would be to redirect technological progress toward raising fuel
efficiency instead of any further increase in fleet average performance.
9Although his subject is very small vehicles, designer Robert Q. Riley offers a useful insight
when he states that developing new paradigms through innovative design is "closer to the grasp
of available technique than the technical solutions needed to double or triple the fuel economy of
conventional vehicles" (Riley 1994: 356). Approaches that fight less against fuel efficiency are
not just a matter of technological feasibility, but also of affordability. Large fuel efficiency gains
in line with the need to limit GHG emissions will be less costly to achieve if the mix of vehicles
sold is less massive than what resulted from design priorities that gave little importance to
reducing consumption-related impacts. A resurgence in small car classes, the relative success of
products such as the Mini Cooper (perhaps anticipated a decade ago by the Chrysler PT Cruiser,
which sold even when gas prices were low and large SUVs were still on the upswing), and the
proliferation of segment-defying designs on compact and midsize platforms: such trends
illustrate the roles that creative downsizing and styling can play in product strategies compatible
with the need to improve fuel efficiency.
Toward Virtual Performance
From a business perspective, degrading customer appeal is of course counterproductive. The
challenge is finding ways to emphasize features, such information technology (IT) and styling,
that might appeal to buyers with less recourse to design requirements that degrade fuel
efficiency. The fact that IT is an ever-expanding area of opportunity for automobiles (as
throughout the economy) opens up numerous possibilities for options compatible with greater
fuel efficiency. What can be termed "virtual performance," measured by the types and quality of
IT features as well as by technical metrics such as memory capacity and bandwidth, is beginning
to compete for consumer dollars with traditional physical power metrics such as horsepower and
engine displacement.
This trend will accelerate as demographics shift toward millenials ("Gen Y") and successive
cohorts. Millenials now exceed one-quarter of the U.S. driving population and "have an
insatiable appetite for digital technology," according to Ford President of the Americas Mark
Fields (2008). Automakers are pursuing these opportunities as customers show an increasing
willingness to pay. The average transaction price of the new Ford Focus, for example, was
increased by $750 through optional purchase of the Sync® IT package, which was approaching
50% take rate (Fields 2008).
While caution is needed to avoid compromising safety when adding IT features, the category
also includes driving and safety enhancements such as adaptive cruise control, stability control,
parking assist, rear-view cameras and emerging crash-avoidance technologies. These virtual
performance features help drivers deal with everyday road conditions better than performance
capabilities than can often only be exercised on a race track. Such IT options are migrating from
luxury segments into mainstream cars (Kranz 2006), providing automakers with opportunities to
offer customer value in ways that displace strategies based on size and horsepower.
The Challenge of Performance Expectations
As new, efficiency-compatible content expands, automakers may have a chance to put traditional
performance metrics into better balance with the concerns that motivate policy. In Table 2,
performance matching refers to a pragmatic approach on power instead of ongoing power gains.
Such a shift is yet to be seen statistically; at least for now, customers seem to value more of both
virtual and physical performance. The view in automotive circles is that the horsepower war is
10far from over and that the market will see trade-offs in other attributes, such as size, before
relinquishing further performance enhancement (Winter 2009a).
These sentiments underpin the prevailing approach on engine sizing as new, high-specific output
options, such as turbocharged direct-injection gasoline engines, are scaled to exceed the power
performance requirements of larger engines they replace. In the impressionistic world of car
sales, automakers see enough challenge in convincing consumers that they will get good
performance with, say, a 6- rather than 8-cylinder engine, let alone trying to convince them that
they can have a great driving experience without a high power-to-weight ratio.
At least to some extent, the horsepower war is a cultural phenomenon, an interplay between car
journalists and other market intermediaries attuned to subtleties of performance and handling.
This dynamic promotes products that advance such metrics each year and at least implicitly pans
products that lag in performance, even if this year's laggards perform at levels that would have
earned them high marks in previous years. Praiseworthy performance gets benchmarked, for
example, in a recent review of the Land Rover LR4 luxury SUV, which with its 5.0L, 375 hp V8
and 5,700 pound curb weight delivers "smooth and effortless acceleration" and "towed our
5,000-pound test trailer to 60 mph in an excellent 12.8 seconds" (Consumer Reports, April 2010:
55). A 12.8 second zero-to-sixty (Z60) time was the estimated average for all light duty vehicles
-- unladen and trailerless -- in 1988, when average curb weight was under 3,000 pounds, gasoline
was 91¢/gal ($1.66 in 2010$), sales were a robust 15 million units and the market was widely
seen as having recovered from the detuned doldrums of the post-oil-shock early 1980s.
The customer experience of good performance is immediate and even visceral. This is in contrast
to the benefits of fuel efficiency which -- unless fuel prices are high and awareness of higher fuel
prices is strong -- are either unseen and societal (e.g., lower environment impacts) or take the
form of deferred gratification through fuel savings experienced periodically when refueling and
with marginally lower expenses over the period of ownership. The generally tepid interest in fuel
economy in spite of the cumulative savings it offers can be explained by consumers' loss
aversion and the perceived uncertainty of the fuel-saving benefits (Greene et al. 2009). Thus, it is
no surprise that under most conditions to date, performance has trumped efficiency. While there
are signs that fuel efficiency is becoming more of a selling point, how strong and durable that
trend will be is yet to be seen.
In contrast, promotion of class-leading performance can be found in any market segment and
featuring it is a time-honored automotive marketing and journalism idiom. Those attempting to
advance green technologies, for example, electric cars such as the Tesla Roadster or promised
Fisker Karma, feel compelled to market high performance and prove that their products are not
underpowered "golf carts." The estimated new fleet average Z60 time has fallen to 9.5 seconds
(EPA 2009) but exotic sports cars now clock in at under 4 seconds, indicating that the limit of
fleetwide performance remains a long way off. Pursuing an efficiency-compatible performance
matching product strategies would be a profound paradigm shift. However, failing to rethink the
extent of design priority placed on performance enhancement may consign the industry to slower
and more costly progress on higher fuel efficiency than might otherwise be necessary.
The last compatible strategy listed in Table 2 is packaging, which involves designing vehicle
interiors to provide a given amount of usable, comfortable space within a given size overall
structure. It is often mentioned among the technical options for mass reduction (as by Duleep
11You can also read