SIMPLE NOT EASY OPPORTUNITIES IN ACTIVE NET ZERO - INDUSTRY BACKGROUND FROM LONGSPUR RESEARCH - The Energyst
←
→
Page content transcription
If your browser does not render page correctly, please read the page content below

SIMPLE NOT EASY
OPPORTUNITIES IN ACTIVE NET ZERO
 INDUSTRY BACKGROUND FROM LONGSPUR RESEARCH

                                        18 February 2021
                                            Adam Forsyth
                                adam.forsyth@longspur.com
                                     +44 (0) 131 357 6770
SIMPLE NOT EASY

 Industry background research available to all professional investors under MiFID II as a minor non-monetary benefit

 Selected Companies
 Bioenergy and CCS
                                            SIMPLE NOT EASY
                                            Achieving global net zero emissions is simple in concept but not easy in
 Drax Group (DRX LN)*
                                            practice. Simple in concept because pathways have already been evaluated
 Velocys (VLS LN)*                          and solutions identified. Not easy because there are challenges in executing
 SIMEC Atlantis (SAE LN)*                   these solutions. Fortunately, the problems can be resolved and this in turn
 Efficiency                                 creates additional opportunities for investors. These active net zero
                                            opportunities are in renewables, storage, hydrogen, efficiency and BECCS.
 Swedish Stirling (STRLNG SS)*
                                            Our market size estimates of these show demand above expectations.
 SIT (SIT IM)*
 eEnergy Group (EAAS LN)                    Solutions to achieving net zero
 SDCL En’gy Efficiency (SEIT LN)            Cutting emissions simply requires renewables for stationary energy demand, batteries
 SMS (SMS LN)                               for transport and hydrogen for industry. Beyond that, efficiency, carbon capture and
 Triple Point (TEEC LN)
                                            storage (CCS), and land use change can get us to net zero. Unfortunately it is not that
                                            easy. Renewables bring problems of market integration. This can be solved, with storage
 Hydrogen
                                            being key and we think demand for storage is underestimated. We forecast 10TWh of
 Powerhouse Energy (PHE LN)*                energy storage demand by 2050, 14% above other key forecasts in the market.
 ITM Power (ITM LN)
 AFC Energy (AFC LN)                       Hydrogen is a major solution
 Ceres Power (CWR LN)                      Renewables also have issues of timing and in particular do not provide much needed
                                           system inertia. This can also be solved, with hydrogen gas turbines, nuclear power and
 Advent Technologies (ADN US)*
                                           biomass being the key options. Nuclear power can create further demand for hydrogen.
 Renewables
                                           Batteries for transport also have limitations especially over range. Again, these can be
 SIMEC Atlantis (SAE LN)*                  overcome by hydrogen solutions in most cases, and biofuels in areas such as long-haul
 Next Energy Solar (NESF LN)*              aviation. We forecast 781Mtpa of hydrogen demand by 2050, 12% above other forecasts.
 JLEN Envir’l Assets (JLEN LN)
 Active Energy Group (AEG LN)              Demand for hydrogen increases demand for renewables
                                           Hydrogen can be “blue” or “green” and green will need additional renewables. So we
 EQTEC (EQT LN)
                                           think demand for renewables will be greater than market expectations. We forecast
 Good Energy (GOOD LN)                     22.5TW of renewable energy capacity by 2050, 11% above other forecasts. Electrification
 Verditek (VDTK LN)                        alone will not get us to net zero and efficiency and negative emission technologies
 Storage                                   (NETs), principally bioenergy carbon capture and storage (BECCS), will be needed to
 Talga Group (TLG AU)*
                                           bridge the gap. We forecast 800GW of BECCS being required.
 Gore St Storage (GSF LN)*
                                           Demand is not the same as value
 Gresham Hs St’ge (GRID LN)
                                           Demand is strong but investors need to factor in risk. Our risk framework for clean
 Invinity Energy (IES LN)                  energy is based on three key risks; technology, competition and policy. Innovators are
 CAP-XX (CPS LN)                           cleantech companies where technology risk is key. Manufacturers make proven low
 Ilika (IKA LN)                            carbon technologies and deal with market risk, especially competition. Finally,
                                           developer/operators face policy risk either directly or through market structure. All can
 Engie EPS (EPS FP)
                                           offer attractive investment opportunities provided these risks can be mitigated.

 *Longspur Research client                 Industry background from Longspur Research
                                           This is one in a series of industry research notes provided by Longspur Research as
                                           background to our issuer-sponsored research service and contains no investment
                                           recommendations. For companies, we offer specialist investment research in new
                                           energy and clean technology, available to all professional investors under MiFID II and
                                           widely distributed to the most appropriate investors. Visit www.longspurresearch.com.

                                                                                                                                  18 February 2021
                                                                                                                                    Adam Forsyth
                                                                                                                     adam.forsyth@longspur.com
                                                                                                                          +44 (0) 131 357 6770
This is a marketing communication. It has not been prepared in accordance with legal requirements designed to promote the independence of
investment research and is not subject to any prohibition of dealing ahead of the dissemination of investment research. However, Longspur Research
has put in place procedures and controls designed to prevent dealing ahead of marketing communications. For institutional clients use only. Please see
important regulatory disclaimers and disclosures at the end of this note.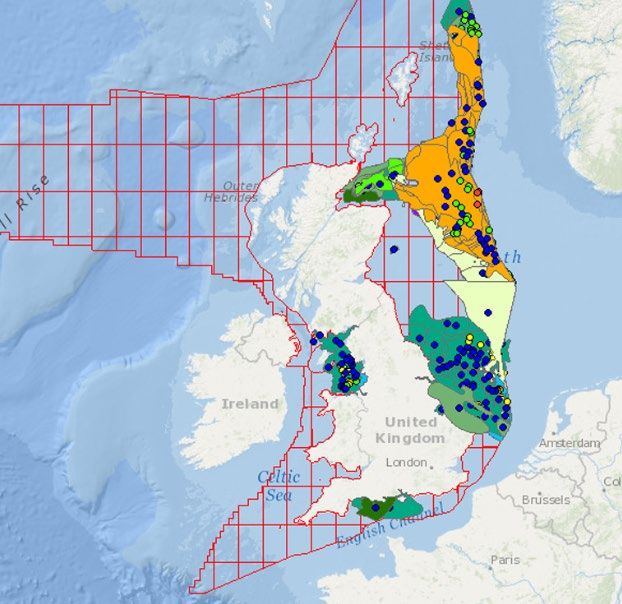
SIMPLE NOT EASY LONGSPUR RESEARCH 18 FEBRUARY 2021

                         CONTENTS
                         Executive Summary                         3

                         Global Net Zero                          8

                         Issues for Renewables                    22

                         Storage Solves Market Structure Issues   25

                         An Issue of Timing                       32

                         H2GTs, Nuclear, Biomass Solve Inertia    39

                         Hydrogen for Transport and Much More     50

                         Bioenergy Opens Up CCS – BECCS           57

                         A Clean Energy Segregation               71

                         Active Net Zero Companies                78

                                                                       2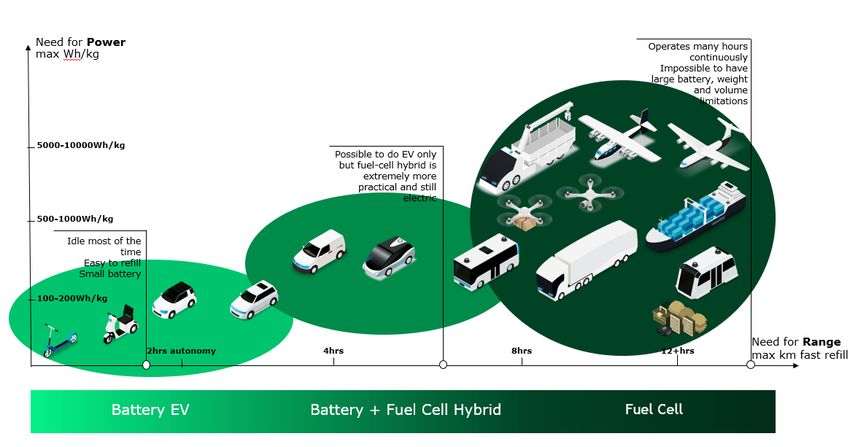
SIMPLE NOT EASY LONGSPUR RESEARCH 18 FEBRUARY 2021

SIMPLE NOT EASY - EXECUTIVE SUMMARY
The IPCC Special Report on Global Warming of 1.5°C requires the world to eliminate net
greenhouse gas emissions by 2050 if it is to keep global warming to within 1.5oC of pre-
industrial levels and avoid the worst impacts of climate change. Pursuing this target is
consistent with the Paris Agreement and countries representing 48% of global emissions
have already announced net zero targets including the EU, China, Canada, Japan and South
Korea.

US change of policy brings a major shift in support for net zero

All the G7 countries except Italy and the USA have announced net zero targets. With Joe
Biden now in the White House, a US commitment to net zero appears likely and the country
has already begun the process of rejoining the Paris Climate Agreement.

The IPCC report shows that anything less than net zero will leave the world and its
economies exposed to severe risk. We believe investors who want the environment to be
considered in their investment strategies will want those investments to be consistent with
a net zero approach.

ACTIVE NET ZERO

The Institutional Investors Group on Climate Change (IIGCC) represents over 70 members
with over US$16tr of assets. It sees two dimensions for investors to be considered in
alignment with the temperature goals of the Paris Agrement.

Two dimensions for investors

                Decarbonising investment portfolios in a way that is consistent with
                achieving this net zero goal

                Increasing investment in ‘climate solutions’ required to meet that goal,
                such as renewable energy, low carbon buildings, and energy efficient
                technologies

Source: IIGCC

We describe companies in the second dimension as Active Net Zero companies. Active net
zero companies are those companies actively working to deliver a net zero solution. This
report identifies the key activities which define active net zero companies.

TARGETING EMISSION REDUCTIONS

The IPCC 1.5°C report studied 90 pathways to achieve a net zero solution. We have taken
the median outcome of this work as a guide to where investment opportunities in this area
are likely to be found.

If we look at where emissions are generated we can see that roughly a quarter are from
electricity and heating, a quarter from agriculture, forestry and other land use (AFOLU), a
fifth from industry, a seventh from transport and the rest from other industry and
buildings.

                                                                                           3
SIMPLE NOT EASY LONGSPUR RESEARCH 18 FEBRUARY 2021

                         Global GHG emissions by sector (2015)

                         Source: IPCC

                         HOW WE CAN REDUCE EMISSIONS

                         Electrification through renewables is key

                         Electricity and heating emissions can be eliminated largely through the use of renewable
                         electricity. Heating has certain challenges but a number of options exist and most are a
                         form of electrificiation; heat pumps, infrared and green hydrogen, can all be driven by
                         renewable electricity. Blue hydrogen is the only major solution not to rely on electricity.

                         Renewables have issues of place, price and timing

                         Despite strong progress, it is not easy to replace fossil fuelled electricity with renewables.
                         While locational changes to the electricity system can be met by investment in power grids,
                         market structure issues are more problematic. The near zero marginal cost attributes of
                         renewables can result in “missing money” leading to lack of investment. There are solutions
                         to this, the most obvious of which is to combine renewables with storage increaseing
                         demand for storage.

                         Renewables also reduce the ability of networks to maintain a set frequency. Deviation from
                         this can lead to system failure and damage connected equipment. Generation which
                         provides spinning reserve is the key solution here and includes nuclear, hydrogen gas
                         turbines and biomass. Nuclear’s inflexibility can itself be solved by matching it with
                         hydrogen electrolysers. Overall these lead to increased demand for hydrogen and biomass.

                         Storage enables transport solutions but again there are issues

                         Transport emissions can be eliminated though electrification which means battery electric
                         vehicles for light duty and medium range applications including the bulk of passenger cars.
                         This will drive demand for lithium ion batteries. However, lithium ion and other battery
                         technologies do not scale well with range and hydrogen fuel cells are more appropriate for
                         heavier duty applications. This extends to short haul aviation where hydrogen solutions are
                         making progress using existing airframes. For longer haul aviation biofuels are the key
                         solution.

                                                                                                                     4
SIMPLE NOT EASY LONGSPUR RESEARCH 18 FEBRUARY 2021

Industry and land use have solutions but we will need NETs

Industrial emissions can be replaced by some electricity. Efficiency is also a major driver
here but hydrogen is perhaps the biggest opportunity. Land use change is the final
opportunity for a significant decarbonisation of emissions. Beyond this we need to rely on
negative emission technologies (NETs) of which the key are in biomass energy and carbon
capture and storage (BECCS).

Putting this together and comparing with existing emissions shows where the solutions lie,
broadly matched with the specific emission problems they solve.

Global Emissions and Solutions

Source: IPCC, Longspur Research

We translate this energy demand into capacity needs on a 2050 timeframe. We can
compare these forecasts to a number of others in the market with those from BNEF and
IRENA being perhaps the most comprehensive. We are ahead of almost all of these.

Implied 2050 capacity for global net zero
                                               Longspur           BNEF              IRENA

Renewable Energy (GW)                             22,486         20,301             18,377

Storage EV (BEVs, m units)                         1,090            414              1,109

Storage ESS (GWh)                                 10,304          5,827              9,000

Hydrogen production (Mt)                             781            697                240

Green hydrogen (GW)                                4,957                             1,700

BECCS (GW)                                           807

Nuclear (GW)                                         864

Biofuels (TWh)                                     5,864

Efficiency (TWh)                                  35,897

Land use change (TWh)                             39,536

Source: Longspur Research, BNEF, IRENA

                                                                                         5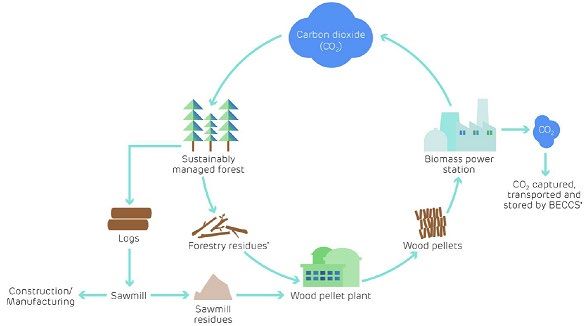
SIMPLE NOT EASY LONGSPUR RESEARCH 18 FEBRUARY 2021

                         INVESTING IN ACTIVE NET ZERO SOLUTIONS

                         Demand is therefore strong but investors need to understand risk as well. We present a risk
                         framework for clean energy companies based around three key risks of technology,
                         competition and policy.

                         Longspur clean energy value chain

                          Technology                 High                   Medium                      Low

                          risk              Unproven technology        Substitution risk             Diversified

                          Policy                    Medium                    Low                       High

                          risk              Needs policy support   Diversified from individual Revenue is policy driven
                                                                             policies

                          Market                     Low                     High                     Medium

                          risk               Unique product/IP        Competitive market         Limited competition

                         Source:Longspur Research

                         Innovators are classic clean tech companies where technology risk is key. Manufacturers
                         provide proven low carbon technologies and principally deal with market risk, especially
                         competition. Finally, developers mainly face policy risk. All three groupings can offer
                         attractive investment opportunities provided these risks can be mitigated. We show below
                         examples of companies within this framework.

                         Example Active Net Zero companies
                                                 Innovator              Manufacturer           Developer/Operator

                         Renewables PV          Midsummer                  First Solar                  NESF

                         Renewables Wind      Windar Photonics              Vestas                     Orsted

                         Renewables Other            AEG                SIMEC Atlantis            SIMEC Atlantis

                         Storage li-ion          Nano One                Talga Group                Gore Street

                         Storage other              Invinity                Cap-XX                  Drax Group

                         Hydrogen           Advent Technologies               ITM                     Everfuel

                         BECCS/CCS                  Velocys                Occidental               Drax Group

                         Efficiency           Swedish Stirling                SIT             Smart Metering Systems

                         Source:Longspur Research (Longspur Research Clients shown in bold)

                                                                                                                       6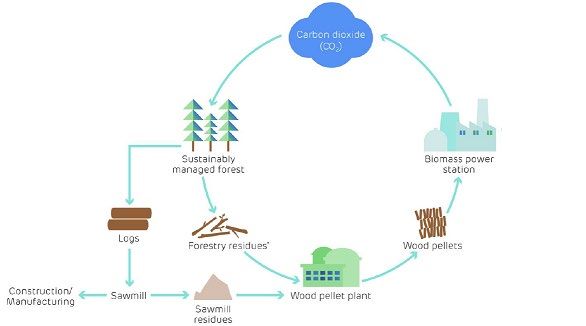
SIMPLE NOT EASY LONGSPUR RESEARCH 18 FEBRUARY 2021

HAVE CLEAN ENERGY COMPANIES BECOME OVERVALUED?

Valuation across the clean energy space is complicated by the fact that many companies are
early stage and are either unprofitable or are still pre-revenue. Less than half of 128 pan-
European active net zero companies have a consensus revenue forecast on Bloomberg.

The Wilder Hill New Energy Global Innovation Index shows growth of 141% in the past
twelve months. However, of 134 pan-European active net zero companies, only 25 have met
or beaten this performance, almost half have not beaten the MSCI World Index
performance of 16% and 42 have seen their share prices fall.

Share price preformance over 1 year
Total active net zero companies                                         134               100%

Number outperforming NEX                                                   25              19%

Number underperforming MXWO                                                61              46%

Number with SP return
SIMPLE NOT EASY LONGSPUR RESEARCH 18 FEBRUARY 2021

                         GLOBAL NET ZERO
                         Net zero is consistent with the Paris agreement which saw 195 nations agree to strengthen
                         the global response to the threat of climate change by:

                          ‘holding the increase in the global average temperature to well below 2°C above pre-
                         industrial levels and pursuing efforts to limit the temperature increase to 1.5°C above pre-
                         industrial levels’.

                         The UN Intergovernmental Panel on Climate Change (IPCC) produced its Special Report
                         on Global Warming of 1.5oC in 2018. As with most IPCC reports this is essentially a
                         summary of recent research with over 6,000 scientific references and 91 expert authors.
                         The 1.5oC level is seen as a level consistent with still being able to achieve goals such as the
                         UN Sustainable Development Agenda. Taking temperatures above this level is seen as
                         leading to irreversible loss of the most fragile ecosystems and create crises for the most
                         vulnerable people and societies.

                         To limit warming to 1.5oC, CO2 in the atmosphere needs to be limited to 430ppm. Because
                         CO2 persists in the atmosphere and we are still emitting it, hitting this level means we need
                         to effectively stop adding CO2 competely by 2050 with a reduction of c.45% from 2010
                         levels by 2030. This is why net zero must result in no net emissions of CO2 being emitted
                         into the atmosphere. If they are, an equivalent amount must be removed. Even with rapid
                         development of negative emission technologies at scale, this still means that most source
                         of emissions must be replaced with zero or very low carbon alternatives.

                         UK per capita emissions compatible with the Paris temperature goal
                                                                                         Well below 2°C        1.5°C

                          Global 2050 GHG emissions per person (tCO2e/year)                 0.8 - 3.2           -2.1

                          Equivalent reduction in total UK GHG emissions from 1990 for
                          same per capita emissions - the UK should go beyond the
                          global average                                                   72% - 93%       85% - 104%

                         Source: Committee on Climate Change (UK)

                                                                                                                       8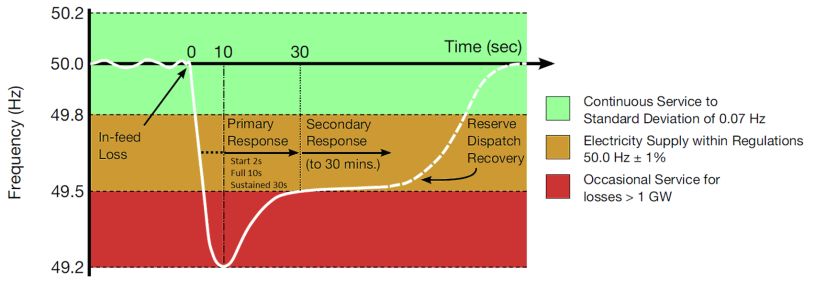
SIMPLE NOT EASY LONGSPUR RESEARCH 18 FEBRUARY 2021

THIS TIME IT’S DIFFERENT

Those with long enough memories will remember a number of share price bubbles in clean
tech names. The Wilder Hill New Energy Global Innovation index (NEX) shows the last
two of these in 2000 and 2007 and we are now seeing share prices on the move again.

Wilder Hill New Energy Global Innovation Index

Source: Bloomberg

The 2000 bubble was largely part of the wider technology boom of the time and suffered
along with other tech stocks when the market recognised that valuations had been
stretched. There then followed another growth period driven in part by optimism that the
new Obama presidency in the USA would strongly support cleantech. While some policies
did help, the administration’s other priority, healthcare reform, meant progress was slow
with the Waxman-Markey Bill failing and the industry was not strong enough to mitigate
the impact of the financial crisis of 2008. Since then progress has been slow but recent
moves have started to drive another wave of optimism.

WHAT HAS CHANGED

The Paris Agreement heralded significant changes, most notably a country by country
approach to decarbonisation. This has allowed leading nations to move ahead with quite
ambitious legislation. In our view it is this legal approach that makes the current
environment more sustainable than previous periods.

Added to this has been a shift in public sentiment towards action. In the middle of the
COVID 19 pandemic polling by the Pew Center shows that in eight out of fourteen major
economies climate change is seen as a greater threat than the spread of infectious disease.

                                                                                         9
SIMPLE NOT EASY LONGSPUR RESEARCH 18 FEBRUARY 2021
% who say ___ is a major threat to their country
Source: Pew Research Center Summer 2020 Global Attitudes Survey. Q13a, d.
A MOVE FROM WHAT WE EXPECT TO WHAT WE NEED
We see the new environment as representing a move towards a more normative outlook.
The frontispiece of the IPCC’s 1.5° report has the following quote from Antoine de Saint
Exupéry’s 1948 book, Citadelle; “Pour ce qui est de l’avenir, il ne s’agit pas de le prévoir,
mais de le rendre possible.” (As for the future, your task is not to foresee it, but to enable
it.) In other words policy makers are now attempting to shape the future than ride with it.
The EU occupational pensions directive IORP II in Article 21 requires pension schemes to
have a proportionate, effective system of governance in place which includes consideration
of environmental, social and governance factors (ESG) in investment decisions. In the UK
this has been reflected in the Occupational Pensions Schemes (Governance) (Amendment)
Regulations 2018 and this is likley to remain post Brexit. The regulations require that
trustees of every pension fund consider ESG in their formal statement of investment
principles. This puts pressure on fund managers and in turn drive demand for ESG positive
investments.
Additionally, we are seeing direct policy support for decarbonisation. In the UK the Climate
Change Act 2008 (2050 Target Amendment) Order 2019 and the Climate Change
(Emissions Reduction Targets) (Scotland) Bill 2019 have set net zero targets for the UK. In
continental Europe, the European Commission Action Plan on Sustainable Finance and the
New Green Deal pave the way for member states to adopt net zero targets. France and
Germany have already passed net zero laws.
10SIMPLE NOT EASY LONGSPUR RESEARCH 18 FEBRUARY 2021
The re-election of Justin Trudeau in Canada saw a policy commitment to net zero and
Japan, South Africa and South Korea have made similar moves. Most significantly the
world’s largest emitter of greenhouse gases, China, now aims to have CO2 emissions peak
before 2030 and achieve carbon neutrality before 2060. In total, countries representing
almost half of global emissions have made some kind of commitment to a net zero position.
The recent election of Joe Biden in the USA has already seen the US initiate steps to rejoin
the Paris agreement. The Biden Plan for a Clean Energy Revolution and Environmental
Justice commits the current administration to net zero emission no later than 2050. While
Congress is somewhat balanced in both the Senate and the House, Democrats have a
majority in both and there should be sufficient billateral support to ensure that a proper
net zero policy can be enacted. This would increase the global commitment to net zero to
countries representing over 60% of CO2 emissions.
In addition to policies supporting a net zero outcome, one of the other main policies driving
decarbonisation is the phase out of vehicles powered by internal combustion engines
(ICEs). Seventeen governments have now set ICE vehicle phase out targets. Even China is
researching a timetable for phase out.
Years remaining until ICE phase out
Source: Bloomberg New Energy Finance
11SIMPLE NOT EASY LONGSPUR RESEARCH 18 FEBRUARY 2021
Countries with some form of net zero committment
Target date Status CO2 2018 GHG 2015
Austria 2040 Policy position 0.19% 0.18%
Bhutan Now Pledged towards Paris Agreement 0.00% 0.00%
California 2045 Executive order 0.93% 0.90%
Canada 2050 Policy position 1.57% 1.59%
Chile 2050 Policy position 0.24% 0.24%
China 2060 Statement of intent 29.71% 26.61%
Costa Rica 2050 Submission to UN 0.02% 0.03%
Denmark 2050 In law 0.09% 0.10%
EU 2050 Submission to UN 9.13% 9.16%
Fiji 2050 Submission to UN 0.00% 0.01%
Finland 2035 Coalition agreement 0.13% 0.16%
France 2050 In law 0.85% 0.92%
Germany 2050 In law to "pursue" 1.99% 1.89%
Hungary 2050 In law 0.14% 0.14%
Iceland 2040 Policy position 0.01% 0.01%
Ireland 2050 Coalition agreement 0.10% 0.13%
Japan 2050 Statement of intent 3.16% 2.77%
Marshall Is. 2050 Pledged towards Paris Agreement 0.00% 0.00%
New Zealand 2050 In law 0.10% 0.17%
Norway 2030/2050 Policy position 0.13% 0.15%
Portugal 2050 Policy position 0.14% 0.14%
Singapore 2nd half of century Submission to UN 0.15% 0.12%
Slovakia 2050 Policy position 0.10% 0.09%
South Africa 2050 Policy position 1.26% 1.18%
South Korea 2050 Policy position 1.84% 1.43%
Spain 2050 Draft law 0.73% 0.71%
Sweden 2045 In law 0.12% 0.14%
Switzerland 2050 Policy position 0.11% 0.11%
UK 2050 In law 0.98% 1.14%
Uruguay 2030 Contribution towards Paris Agreement 0.02% 0.08%
Total (EU net) 48.38% 44.56%
USA 2050 Policy of incoming administration 13.92% 13.12%
New total 61.37% 56.78%
Source: Longspur Research
12SIMPLE NOT EASY LONGSPUR RESEARCH 18 FEBRUARY 2021
ACHIEVING GLOBAL NET ZERO
If we look at where emissions are generated we can see that roughly a quarter are from
electricity and heating, a quarter from agriculture, forestry and other land use (AFOLU), a
fifth from industry, a seventh from transport and the rest from other industry and
buildings.
Global GHG emissions by sector (2015)
Source: IPCC
If we are to hit the 1.5 degree target then all of these emissions have to either be eliminated
or offset. This is an enormous task but we believe that there are solutions either currently
available or very close to being available to meet these needs.
WHERE EMISSION REDUCTIONS CAN COME FROM
We have taken the IPCC 1.5 degree report as our basis for analysis. This assessed over 6,000
recent accademic papers including 90 mitigation pathways, developed with integrated
assessment models, and consistent with delivering a 1.5 degree temperature rise by 2050.
The more recent World Energy Outlook 2020 from the International Energy Agency (IEA)
also undertakes a comprehensive energy scenario based on hitting net zero emissions by
2050. There are some key differences between the two with the IEA broadly assuming more
energy demand growth and, at least to 2030, more renewables and less nuclear, fossil fuel
or CCS. Overall we see the IPCC median outcome as possibly a harsher reality and as such
a better base to build our assumptions from.
13SIMPLE NOT EASY LONGSPUR RESEARCH 18 FEBRUARY 2021
IPCC and WEO near term assumptions compared
IPCC 1.5 IEA WEO 2020
Population and economic growth Less More
Primary energy demand Less More
Nuclear power growth More Less
Share of renewables Less More
Fossil fuel use More Less
CCUS and BECCS More Less
Source: IPCC Special Report; Global Warming of 1.5oC, IEA World Energy Outlook 2020
These 90 pathways in the IPCC report include 53 model pathways with no or limited
temperature overshoot and 37 scenarios that have a higher overshoot. A low overshoot
where the target is initially missed (the overshoot) but brought back in line over time. The
scenarios for higher overshoots essentially require more carbon removal solutions such as
BECCS to be adopted.
We have used the median low overshoot data as we see this as more useful in identifying
active net zero investment opportunities and representing the likely thrust of policy and
rewards over the next ten years. If it becomes apparent that we are heading for a high
overshoot, we do not see policy changing other than creating additional incentives for
carbon removal.
The median energy breakdown for these scenarios across the key energy sectors is shown
in table 2.6 of the IPCC report.
Median primary energy supply forSIMPLE NOT EASY LONGSPUR RESEARCH 18 FEBRUARY 2021 Table 2.7 gives additional data on electricity supply and we have used this to provide additional granularity to our analysis. Median primary electricity supply for
SIMPLE NOT EASY LONGSPUR RESEARCH 18 FEBRUARY 2021

                         Transport Emissions and Solutions

                                                            Share of each mode (%)       Reduction from 2014 (%)

                                                Energy           Biofuel         CO2          Energy            CO2

                          LDV                        36              17            30              51             81

                          HDV                        33              35            36               8             56

                          Rail                        6               0             -1           -136            107

                          Aviation                   12              28            14              14             56

                          Shipping                   17              21            21              26             29

                         Source: IPCC

                         Because the biofuel component and energy components are not equal, we have reallocated
                         some of the biofuel to hydrogen in the mix. We have assumed that the biofuel content for
                         non-LDV transport is supplied by hydrogen rather than biofuel. This suggests total
                         hydrogen fuelled energy equal to 110EJ. Checking against other forecasts in the market
                         with the Hydrogen Council at 78EJ and BNEF at 99EJ, this seems reasonable for a full net
                         zero solution. As we shall show later in this note, hydrogen is also a strong solution for
                         inertia and balancing nuclear we think our higher end forecast is valid.

                         Hydrogen demand in 2050

                         Source: IRENA, Hydrogen Council, BNEF

                         Waste to energy

                         A major component of biomass generation may be in the form of waste to energy which can
                         typicaly have a biogenic content of 50%. As this also acheives a solution to the other major
                         sustainablity problem of plastic waste, we see this as being a major component of bio enegy.
                         It is also a potential source of negative emissions if combined with CCS.

                                                                                                                  16
SIMPLE NOT EASY LONGSPUR RESEARCH 18 FEBRUARY 2021
Bioenergy with Carbon Capture and Storage (BECCS)
This is the major solution to negative emissions and in high overshoot scenarios is likely to
play a major role. Even in low overshoot scenarios it is significant. We have assumed that
all biomass electricity generation indentified in table 2.7 will be BECCS. This is a low
estimate with the 20EJ of energy on which it is based within the range of what can be
achieved with sustainably available forestry. In fact this represents a point of high
agreement in the accademic literature on what is sustainably available. As stated above we
also assume that this category includes waste to energy with CCS.
Renewables for power and heat (with storage)
We have assumed all the non-biomass renewables presented by the IPCC scenarios. With
mainstream wind and solar technologies now the cheapest forms of power generation in
most geographies, we think this is a reasonable assumption. This is the key solution for
power and heat but also a major component in transport as the charging source for BEVs.
As we will describe, we see a number of problems with intermittent renewable energy. We
see storage, both short and long duration, as largely overcoming these problems and
creating substantial demand for stationary enegy storage systems (ESSs). Renewables and
storage are also the combined solution behind BEVs with the storage in the vehicle itself.
As a result we combine renewables and storage as a single solution.
Renewables for transport and industry using hydrogen
Hydrogen production from the electrolysis of water using renewable electricity further
increases demand for renewables. Above all we see this as driving demand for renewables
beyond current expectations. We have split out this “green hydrogen” as a separate solution
based on our hydrogen assumptions above. Blue hydrogen using steam methane or
autothermal reforming and combined with CCS is another route to creating low carbon
hydrogen although there is much debate here. We have used the Hydrogen Councils broad
60/40 split between green and blue and separated out a blue hydrogen solution.
Efficiency
The IPCC figures show a reduction in primary energy demand between 2020 and 2050
which must be delivered by efficiency. However, to estimate the scale of for efficiency as a
solution, we need to consider what primary energy demand would be under a business as
usual outcome. We have assumed that the underlying growth in energy demand is based
on the increase in electricity generation forecast by the IPCC and then added the reduction
in primary energy assumed by the IPCC above. This should give us a reasonable estimate
of the contribution to the total from energy efficiency measures.
Land use change and carbon capture and storage
The IPCC assumes a fairly significant 184EJ residual fossil fuel component in the energy
mix. This must be balanced off by either carbon capture and storage or land use change.
We assume most large scale biomass combustion plants will adopt CCS post capture
technology (or possibly oxy combustion in some cases). We also assume that aviation
biofuel will be produced using CCS technologies (we think HDFC bsaed biofuels will not
find enough feestock for this purpose). These are included in our BECCS and biofuels
solutions but as they are negative emisison solutions we also include the CCS element as a
separate solution. Blue hydrogen uses CCS to reduce its emissions burden so we do not
separate it.
17SIMPLE NOT EASY LONGSPUR RESEARCH 18 FEBRUARY 2021
This gives a CCS figure of 41EJ. We deduct this from the fossil fuel residual and assume
that the gap is covered by land use change. This suggests that land use change accounts for
22% of emission reductions. The IPCC’s work on land use change gives quite a range for
emisison reductions with a maximum of 40%. Against this, 22% seems reasonable.
The final outcome is as follows.
A net zero energy mix
EJ TWh %
Nuclear 25 6,808 4%
BECCS 20 5,653 3%
Renewables & Storage 146 40,619 23%
Biofuels 21 5,864 3%
Renewables & Hydrogen 67 18,473 10%
Blue Hydrogen 44 12,315 7%
Efficiency 129 35,897 20%
CCS 41 11,517 7%
Land use change 142 39,536 22%
Total 636 176,683 100%
Source: Longspur Research
We can show this against the relative emission sources which helps to show which solution
fits which source.
Global Emissions and Solutions
Source: IPCC, Longspur Research
18SIMPLE NOT EASY LONGSPUR RESEARCH 18 FEBRUARY 2021
HOW MUCH CAPACITY DOES THIS ENTAIL?
Each solution is different but we can make an estimate of the capacity is required for each
one. In some cases the solution can be quantified in terms of the energy in EJ or TWh. Most
require a calculation to determine the amount of capacity required to deliver this energy.
Renewables will depend on the load factor of the technology. Generation is not always
available to meet demand and there can be curtailment of excess energy. If curtailed energy
can be stored, this problem is partly overcome increasing utilisation. We use an overall 30%
utilisation factor for renewables being used to replace fossil fuelled electricity and heating
demand. This is well ahead of the 23% implied in BNEF forecasts and reflects a mix of low
PV and higher wind including offshore. This gives 22.5TW of capacity. This is higher than
forecasts from IRENA at 18.4TW and BNEF at 20.3TW.
For energy storage systems we have assumed that 50% of renewable capacity used for
heating and electricity is matched by a minimum of 1 hour and 20 minutes of storage based
on an hour of trading and 20 minutes of response services. Later on in this note we show
that up to 50% of capacity could be economically matched with storage. This represents
capacity of 10.3TWh. This is 14% ahead of IRENA’s forecast 9TWh and broadly confirms
the figure given by Tesla at their Battery Day 2020. Nuclear utilisation is simply assumed
at 90% in line with its baseload characteristics to give 864GW of capacity.
Storage for EV requires assumptions to be made about the number of EVs on the road that
will utilise this energy. We have assumed 23.3 cycles per annum based on a typical EV range
of 300km, average annual milage of 8,761km and a seven-year average vehicle life. This
gives us a battery demand of 32.2TWh. We think average battery sizes will reduce and using
a battery size of 50kWh battery this gives us a BEV fleet estimate of 1,090m units. This
compares with an IRENA estimate of 1,109m units. The current passenger car global fleet
is at 1.4bn.
Green hydrogen production is based on an electrolyser efficiency of 50kWh/kg and a 54%
utilisation factor. This gives a capacity figure of 5.0TW of electrolyser capacity well ahead
of the 1.7TW forecast from IRENA. BECCS is based on a utilisation figure of 80% to get a
capacity of 807GW. Finally, non-BECCS CCS and efficiency are just taken at their energy
levels of 32.0TWh and 35.9TWh respectively.
The outcomes are shown below against estimates from Bloomberg New Energy Finance
(BNEF) and the International Renewable Energy Agency (IRENA). This suggests our
estimates are at the top end of, or slightly above, current expectations.
19SIMPLE NOT EASY LONGSPUR RESEARCH 18 FEBRUARY 2021
Implied 2050 capacity for global net zero
Longspur BNEF IRENA
Renewable Energy (GW) 22,486 20,301 18,377
Storage EV (BEVs, m units) 1,090 414 1,109
Storage ESS (GWh) 10,304 5,827 9,000
Hydrogen production (Mt) 781 697 240
Green hydrogen (GW) 4,957 1,700
BECCS (GW) 807
Nuclear (GW) 864
Biofuels (TWh) 5,864
Efficiency (TWh) 35,897
Land use change (TWh) 39,536
Source: Longspur Research, BNEF, IRENA
HOW MUCH WILL THIS COST?
The cost of these pathways has been set out in the IPCC report in figure 2.27 and shows an
average annual investment expenditure of US$3.1tr per annum to reach a net zero outcome
over the period 2016-2050. However this needs to be compared against existing energy
expenditure. The exploitation of fossil fuels requires continued exploration and
development, which will include items such as the sunk cost of dry wells. The IPCC report
puts a baseline expenditure at US$2.3tr so the net incremental expenditure to reach net
zero is US$0.8tr per annum.
This is pretty much the same figure identified by IRENA, in their paper Global Energy
Transformation: A Roadmap to 2050, who see an additional investment requirement of
US$27tr between 2015 and 2050 which also gives US$0.8tr per annum.
However, these estimates only consider investment. Against this it should be remembered
that opex for new energy solutions is broadly lower than for the fossil fuel based baseline
as there are no fuel costs for renewable energy. In fact, a key issue with the energy transition
is that we are moving towards solutions which are capital heavy but opex light. Ongoing
production costs for renewable energy, green hydrogen and energy efficiency are all
extremely low when compared with the fossil fuel alternatives. With no fuel to purchase,
opex is limited to O&M costs and ground rent.
Using the global consumption figures in the BP statistical review for oil, gas and coal,
together with current spot commodity prices we estimate a total fuel cost under a business
as usual scenario as US$2.8tr. These costs will not all be removed in a net zero world as
there will still be an element of fossil fuel production under the IPCC median outcomes.
Taking the proportional energy derived from these sources, the fuel opex cost drops to
US$1.0tr.
20SIMPLE NOT EASY LONGSPUR RESEARCH 18 FEBRUARY 2021
Incremental investment and opex to reach net zero
US$tr Baseline 1.5 degrees Incremental
Investment 2.3 3.1 0.8
Fuel opex 2.8 1.0 -1.8
Other opex (est. for equivalence) n.a. 1.0 1.0
Total 5.1 5.1 0.0
Source: Longspur Research, IPCC, BP Statistical Review of World Energy 2020, Bloomberg
Taken against the incremental investment expenditure required to hit net zero of US$0.8tr
this means our renewable and other solutions would need to spend $1tr on O&M for a net
zero solution to cost more than the baseline case. With typical O&M costs for wind being
3% of capex and 1% for PV this figure at 30% of the total investment figure seems unlikely,
suggesting that a net zero solution could actually be cheaper than the baseline, even before
the consideration of the negative costs of climate change.
While this seems all positive for low carbon solutions, the near zero marginal cost
characteristics of these technologies creates problems for market structure which we will
discuss later in this note.
DEMAND IS IMMENSE
From our analysis it can be seen that renewable electricity is going to become the main
source fuel for LDVs, domestic heating and industry in addition to all the areas we already
use electricity for. To hit net zero, all current electricity demand needs to be low carbon but
additional demand is created by the need to charge EVs and to generate hydrogen for long
haul transport and industry. As a result, we believe that most current forecasts of demand
for renewable capacity are understated if we are to achieve 1.5 degrees.
We also think that much renewable capacity will need to be complemented by storage.
While lithium ion can provide much of this, it becomes less efficient where longer storage
durations are required and we see a major role for other technologies including pumped
hydro, hydrogen storage, flow batteries, compressed air and gravity systems.
Hydrogen becomes a key solution for longer distance and heavy duty travel and also for a
number of key industrial solutions. Beyond this, key opportunities lie in efficiency and in
carbon capture and storage.
However there are a number of challenges notably for renewables and lithium ion based
transport.
Issues for renewables
While renewable energy can decarbonise electricity and heat, problems of place, time and
price create new problems which require solutions with storage, nuclear, hydrogen and
biomass being the main sources.
Issues for storage
EVs are a solution for much of transport, but problems of range, infrastructure and supply
chain mean that other solutions are needed to reach net zero, notably hydrogen for longer
range applications.
21SIMPLE NOT EASY LONGSPUR RESEARCH 18 FEBRUARY 2021
ISSUES FOR RENEWABLES
The energy required for electricity and to an extent heating can be provided by renewable
energy. Nuclear, hydrogen and biomass, especially with carbon capture and storage also
have a role here as we shall explain.
Renewables are already the go to solution with levelized costs now below fossil fuel
generation in many geographies. Costs for both wind and PV have dropped dramatically
over the past ten years. As a result, renewables are now often the cheapest form of power
generation, a fact noted by the IEA in their recent Renewables 2020 report.
Levelised costs of energy (2019 real)
Source: BNEF
Renewables are the go to solution but they do face number of challenges. There are major
changes in the location of supply and demand as renewables replace large scale fossil fuel
power plants and also as EV charging creates new sources of demand. We also note market
structure issues which impact the pricing of renewables. Finally, there are major timing
issues created by intermittent supply and also at a micro scale from the inability of most
renewables to provide system inertia. Put simply they suffer from being in the wrong place,
at the wrong price and at the wrong time.
22SIMPLE NOT EASY LONGSPUR RESEARCH 18 FEBRUARY 2021
Levelised costs of energy (unsubsidised)
Source: Lazard
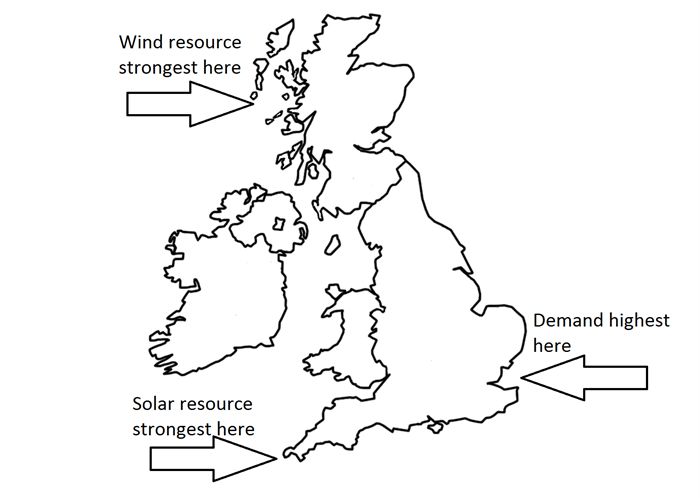
LOCATIONAL CONSIDERATIONS
Because much of the growth in renewables is being driven by socket parity, it is by necessity
decentralised generation, sited at the extremes of the power grid rather than the centre. In
many countries including the UK the strongest renewable resources have been at the
extreme ends of the grid (sun in Cornwall, wind in Scotland and Wales). Most power grids
have been designed for centralised generation. These grids are now being disrupted by the
growth in distributed and remote generation and are finding increased demand for related
reinforcement of transmission and distribution capacity.
Simple View of UK Renewable Resources and Demand
Source: Longspur Research
23SIMPLE NOT EASY LONGSPUR RESEARCH 18 FEBRUARY 2021
Simple View of French Renewable Resources and Demand
Demand highest
here
Wind resource
strongest here
Solar resource
strongest here
Source: Longspur Research
This problem has an obvious solution in the form of additional expenditure on transmission
and distribution grids. This creates opportunities for grid and distribution companies,
although most of these companies are fully regulated and returns may be limited.
More efficient solutions such as smart grids including smart metering also help to solve
these locational issues and there are major investment opporutnities in this area.
The additional needs of EV charging in creating a mobile demand load with additional
prediction issues creates further problems. Again this creates opportunities for solutions
including smart charging and vehicle to grid.
EFFICIENCY AS A LOCATIONAL SOLUTION
While efficiency can be simply driven by non-locational issues a lot is very site specific and
can include a changing interaction with the grid. On site efficiency can often includes
solutions which relate to local grid connections and can include the ability to provide
demand side response as a service back to the grid.
24SIMPLE NOT EASY LONGSPUR RESEARCH 18 FEBRUARY 2021
STORAGE SOLVES MARKET STRUCTURE ISSUES
Liberalised electricity markets normally work on some kind of bidding arrangements where
marginal costs are a key determinant of who will win bids. Most renewable energy
technologies are characterised by high capital costs but low operating costs. This is the
benefit of not requiring any fuel so that the only significant cash cost item is maintenance
costs. As a result, marginal cost per unit can be very low compared with other generation
technologies. This is often compounded by support policies. Where there is a feed-in-tariff
or green certificate scheme, these can be seen as negative costs that effectively put the
marginal cost into negative territory. In other words, renewable generators will be prepared
to bid a negative price in order to receive at least some of their policy support. This has
resulted in negative pricing events in some markets and this is likley to grow with renewable
penetration.
UK Balancing Market Negative Pricing Events
Source: Elexon
When enough low marginal cost assets are present in a market, low or negative prices result
in uneconomic returns (missing money) for generators. As a result, this puts pressure on
incumbent generators who suffer from low prices. It is also likely to lead to low investment,
exacerbating security of supply issues in the medium and longer terms. Most markets have
been designed to reward integrated players on a marginal basis. The changing nature of
power markets is resulting in a “missing money” problem. While some attempts are being
made to address this through capacity markets, these are not necessarily sufficient to
forestall many of the problems.
MISSING MONEY
Bloomberg New Energy Finance has been particularly focused on this issue with its H1 UK
energy outlook forecasts showing the phenomenon leading to a lowering of average
electricity prices with the wholesale price (time weighted annual average) droping form
£57/MWh in 2018 to £30/MWh in 2030 and then to £20/MWh by 2043 before recovering
slightly to £27/MWh in 2050.
25SIMPLE NOT EASY LONGSPUR RESEARCH 18 FEBRUARY 2021
BNEF H1 UK Power Market Outlook Power Price Forecast
Source: BNEF
Aurora Consulting has countered this argument by suggesting that new investment in
intermittent generation will cease if the returns are too low. This is a valid point except that
participants have a better option than simply not to build new capacity.
A better market solution is for renewable generators to insulate themselves from the
problem by either investing in storage or by integrating downstream with retail businesses.
These moves can be done physically or virtually through contract structures. In many ways
the surge in private PPAs reflects a contractual insulation from downstream integration.
Global corporate PPA volumes
Source: BNEF
26SIMPLE NOT EASY LONGSPUR RESEARCH 18 FEBRUARY 2021
However, most contracts are of fixed duration and we see integration with storage as a more
reliable and logical response to what are actual market needs. In many ways this reflects
the physical picture where it can just as readily be seen that storage is needed to make
renewables work.
STORAGE AS A SOLUTION TO MISSING MONEY
In the past, chemical energy storage was always a major part of the energy mix,
representing 76% of UK capacity in 1999. This was energy storage chemically contained in
the coal stocks and gasometers and line stack of natural gas. However, the coal is all going
and it is likely that gas will follow if we are to hit net zero emissions. If we look at the total
energy market, a move to net zero will entail the loss of 352TWh of mainly chemical energy
storage in the UK market alone.
Energy Storage in the UK, 2015
h
h
h
h
h
0. W H
TW
h
h
H
TW
TW
TW
TW
TW
TW
TW
T
03
15
5
15
2
50
47
0.
91
0.
7
14
In vehicle
fuel
storage
Petrol stocks Pumped storage
hydro
Natural Gas stocks Thermal storage
Diesel stocks
Non-pumped
Crude Oil storage hydro
Coal stocks
Source: Simon Gill, University of Strathclyde, 2015
The lithium ion revolution
As a result of dramatically reducing costs, lithium ion has emerged as a solution to at least
some of these storage needs.
27SIMPLE NOT EASY LONGSPUR RESEARCH 18 FEBRUARY 2021
Lithium ion battery pack prices
Source: BNEF
Lithium ion has been the big story in energy storage but storage is not a single market. To
date, storage in the UK electricity market has been dominated by pumped hydro. However,
lithium ion is now cheaper than pumped storage provided the storage duration is not too
great. Essentially lithium ion has emerged as an economic solution at shorter durations of
up to four hours and, if anything, is displacing open cycle gas turbines and gas or diesel
reciprocating engines. But it is not scalable with duration and beyond about 4 hours current
lithium ion technology is uneconomic compared with pumped storage and newer
technologies such as flow batteries, compressed air storage and liquified air storage.
Levelised cost of storage against duration
Source: Longspur Research
28SIMPLE NOT EASY LONGSPUR RESEARCH 18 FEBRUARY 2021
THE WHOLESALE MARKET OPPORTUNITY FOR STORAGE
Taking the UK (GB) wholesale electricity market as an example we can show supply and
demand for this market in a traditional supply and demand graph. Because of the
instantaneous nature of the market with demand changing every 20 ms (in a 50Hz system)
we really need to show two demand curves, one with the peak demand in the year and one
with the minimum demand. Also, because intermittent renewable supply varies, we think
it helpful to show the limit points in two supply curves, one with all renewable capacity
available and one with no renewable capacity available.
Prices across the year should all fall in the shaded area between the curves.
GB electricity market supply and demand
Source: Longspur Research, BNEF, National Grid FES
The average price for the year will be roughly in the middle of this area. It can be estimated
using assumptions of average demand and supply. Full forecasts are available using Monte
Carlo simulation techniques to capture the varation in demand and weather related supply
to pinpoint the exact point in the middle of this area. However this is data and calculation
heavy with one consultant reporting a ten hour run time to to prepare a forecast.
The low supply curve includes renewables with negative short run marginal costs. This is a
result of subsidy programmes. The generators only get the subsidy when they run so should
be prepared to bid negatively down to the level of subsidy. This may be rare but does happen
and is on the increase as more renewables are added to the system.
Adding storage
Storage is both a source of demand and supply. When storage charges it is demand and
when it discharges it is supply. Charging will ideally take place when supply is at a
maximum and demand at a minimum. With negative pricing, batteries could be paid to
charge, although in practice we think the actual low charging point will be zero.
Discharging will try to take place when demand is at a maximum and supply at a minimum.
While storage will also sell services to the ancillary markets and the capacity market, it can
make money from trading the difference between the high demand/low supply periods and
the low demand/high supply periods. If we add storage capacity two things happen. The
capacity moves the low period demand curve to the right to represent the additional
demand caused by charging.
29SIMPLE NOT EASY LONGSPUR RESEARCH 18 FEBRUARY 2021
Impact of 10GW of storage charging
Source: Longsur Research
Then the high period supply curve is moved to the right (new supply is added), representing
discharging.
Impact of 10GW of storage discharging
Source: Longspur Reseach
Looking at these graphs we can see that we can add over 30GW of new storage before the
charging cost rises materially above zero and before the discharge price falls below
£50/MWh. We would caution that this is the extreme range available but it does give a
useful illustration of the fact that trading spreads can remain attractive even with a lot of
new storage capacity in the market.
30GW represents c.50% of the peak demand in the market. This is a significant opportunity
and if this opporunity presents itself in other similar markets, we are underestimating the
opportunity for stationary energy storage systems.
30SIMPLE NOT EASY LONGSPUR RESEARCH 18 FEBRUARY 2021
POLICY SOLUTIONS TO MARKET STRUCTURE ISSUES
The missing money problem is really a problem of market structure. Most markets are
established and regulated on the assumption that there is demand for electricity. In fact
there is very little demand for electricty, most demand is for reliable electricity. If we ignore
this we end up with sub optimal solutions of which missing money is one.
One risk area around market structure is that, if renewable energy providers are unable to
address the missing money issue by contracting or using storage, new entry may dry up
before the demands of a net zero solution can be met. This may push policy makers to adopt
more regulated market solutions. We are a little concerned by the experience in Ontario
where almost 70% of the wholesale market is now effectively regulated through the Global
Adjustment (GA) surcharge which has led to reduced competition and distorted price
signals. This has led to high prices for consumers with retail prices increasing 71% between
2008 and 2016 and consumers now paying an average of 22% more than other Canadians.
We see this as a danger signal that policy moves to support renewables can go wrong, with
renewable developers likely to be most affected.
Ontario electricy commodity price breakdown
Source: LAS
31SIMPLE NOT EASY LONGSPUR RESEARCH 18 FEBRUARY 2021
AN ISSUE OF TIMING
Wind generation only generates power when the wind blows and the wind does not blow
all the time (except possibly in Shetland). Solar obviously does not generate power at night
but also sees output vary with cloud cover. These variations in output are referred to as
intermittency. The problem of intermittency is exacerbated by difficulties in predicting the
timing of that intermittency. While there are now better forecasting techniques available,
they do not remove all of the uncertainty in output from these types of generation. This is
true of both wind where wind speeds can vary continuously and solar where unpredictable
cloud cover can reduce output by as much as 90%.
Timing Impact of Intermittency
Source: IEA
The renewables industry usually counters criticism of intermittency with the proposition
that intermittency is reduced or even eliminated by the geographical diversification that
comes with large portfolios of projects at different locations. However, the most recent
academic work suggests that this effect is overplayed and that grid scale fluctuations in
output are correlated between projects.
Even if output is assumed to be completely predictable, the timing of solar in particular can
create significant problems for girds.
The Duck Curve
One impact of increased renewable energy capacity and in particular solar is the creation
of a “Duck Curve” in the daily demand profile. The potential impact of significant solar
capacity on demand was first raised by the California Independent System Operator
(“CAISO”). California used to see energy demand on the grid rise in the middle of the day
and be fairly flat across the afternoon before rising to a peak in the early evening. Solar is
recognised as negative demand because of its distributed nature. With considerable solar
on the Californian system, demand now begins to fall from 11am as this capacity kicks in.
Then in the late afternoon, as the sun wanes and solar starts to come off, demand rises very
steeply into the early evening peak. This can be represented on a demand graph showing
how demand is expected to behave as even more planned solar capacity is added out to
2020. The shape is said to resemble something that quacks.
32SIMPLE NOT EASY LONGSPUR RESEARCH 18 FEBRUARY 2021
Duck Curve
Source: National Grid
The key message of the duck curve is that the grid used to have to deal with a small ramp
up in demand in the later afternoon or early evening but now has to deal with a much more
marked ramp up. This puts pressure on the system and increases demand for flexible and
responsive capacity.
However, the biggest timing issue is at a more micro scale and involves keeping the
frequency of the AC current stable.
33SIMPLE NOT EASY LONGSPUR RESEARCH 18 FEBRUARY 2021
THE PROBLEM OF INERTIA
Electricity systems need to stay in balance in real time. This balancing is a large part of the
job of system operators (“SO’s”) such as the UK’s National Grid ESO. If there is imbalance
the system frequency moves away from its nominal level. If it moves too far it will create
serious problems for the grid. Major moves away from the nominal frequency will impact
the whole grid and can trigger cascading failure resulting in partial or total system
blackouts.
In the UK, as in other markets, there is a statutory requirement for National Grid ESO to
keep the frequency of the electricity system within a narrowly defined range. The nominal
frequency is set at 50Hz and the SO must keep actual frequency to +/- 1% of the 50Hz
standard.
Frequency trigger points
Source: National Grid
ESO will also be fined if frequency moves outside the 1% band. In order to avoid these fines,
and to prevent blackouts and system damage, ESO uses a number of services to maintain
frequency. Key is the use of synchronised generation. Essentially this is the traditional
steam driven generators of the large coal, gas and nuclear power stations. The inertia
represented by their spinning generators damps down any frequency interruptions.
34SIMPLE NOT EASY LONGSPUR RESEARCH 18 FEBRUARY 2021
Synchronous Generation Creates Inertia
Source: National Grid
This worked reasonably well when most of the system’s generators were synchronous.
Unfortunately the main forms of renewable generation, wind and solar PV, do not provide
inertia to the system. Their generation output varies continuously as wind rises and falls
and as cloud cover materialises and disperses. Because renewable generation varies
continuously it cannot have a synchronous connection with the grid and so does not provide
inertia.
Generator with synchronous coupling
Source: National Grid
Generator with non-synchronous coupling
Source: National Grid
35SIMPLE NOT EASY LONGSPUR RESEARCH 18 FEBRUARY 2021
Intermittency and volatility
The intermittency problems created by renewable generation are well known in terms of
the longer duration issues of day time versus night time for solar and windy days and calm
days for wind. However, short term volatility is less generally understood outside the
industry. In terms of value it is potentially as large an issue. Output from renewables is
constantly varying and, despite sophisticated inverters and other controls, this puts
pressure on system frequency. So in addition to displacing the synchronous generation
which minimises frequency imbalance, renewable generation makes it worse by sending
out a volatile supply to the grid.
Volatility in the system
Source: Faraday Grid
WHY STORAGE IS NOT A SOLUTION TO THE PROBLEM OF VOLATILITY
While battery based energy storage is a solution to the problems of intermittent renewables,
it does not really solve the volatility issue. Standard energy management systems used with
battery storage can only respond in the micro second range with the Master Controller or
Energy Management System of a typical battery storage installation reacting on average
between 200 and 400ms. However, a frequency drop causing an outage can occur in less
than 40ms, although large drops will normally take longer. Technically, response needs to
occur within one wavelength. For a 50Hz system this is 1/50 = 0.02s or 20ms. This means
that battery systems are only useful as a response to frequency issues rather than instantly
damping them.
Frequency response – a matter of timing
Source: National Grid
36You can also read


