P LAN N: FR - City of Fort Collins
←
→
Page content transcription
If your browser does not render page correctly, please read the page content below

2015

                                        P LAN
                                            N:   FR
                                                  RAME
                                                     EWOR
                                                        RK

CLIMA
    ATE ACTION PLAN
                  N FRAMEWORK – March 2015                   1
Fortt Collins
2015 Climate e Action Plan
Fram
   mewo  ork

March 20115

City of Fortt Collins
PO Box 5880
Fort Collinss, CO 80522

fcgov.com//climateprotecttion

fcgov.com//utilities

fcgov.com//enviro

ACKNOWLEDGEMENTS                              City Manager
                                              Darin Atteberry
Fort Collins City Council
                                              Deputy City Manager
Karen Weitkunat, Mayor
Gerry Horak, Mayor Pro-tem, District 6        Jeff Mihelich
Bob Overbeck, District 1
Lisa Poppaw, District 2                       Project Management Team
Gino Campana, District 3
Wade Troxell, District 4                      Bruce Hendee, Chief Sustainability Officer
Ross Cunniff, District 5
                                              Sustainability Services
                                              Lucinda Smith, Project Manager
Climate Citizen Advisory Committee            Bonnie Pierce
                                              Emily Wilmsen
Bill DeMarco                                  Josh Birks
Bryan Watkins                                 Melissa Hovey
Chadrick Martinez
Dana Villeneuve                               Fort Collins Utilities
Dianne Ewing                                  Steve Catanach
Eric Levine                                   John Phelan
Glen Colton                                   Lance Smith
Greg Rittner                                  Lisa Rosintoski
Harry Edwards                                 Travis Paige
Holly Wright
John Holcombe                                 Planning, Development and Transportation
Kellie Falbo                                  Paul Sizemore
Marge Moore
Mark Easter                                   Numerous other staff contributed to the
Mike Freeman                                  development of this CAP Framework.
Olivia Stowell
Rich Fisher                                   Consultants / Resources
Sara Frazier
Scott Denning                                 The Brendle Group
Stacey Clark                                  Rocky Mountain Institute
Suraj Renganathan                             Platte River Power Authority
Tom Ghidossi
Yvonne Myers

Participating Climate Committee Alternates:

Chris O’Dell
Hunter Buffington
John Shenot
Kelly Giddens
Lisa Rephlo
Stacey Baumgarn
Shawn Tierney

CLIMATE ACTION PLAN FRAMEWORK – March 2015                                                 i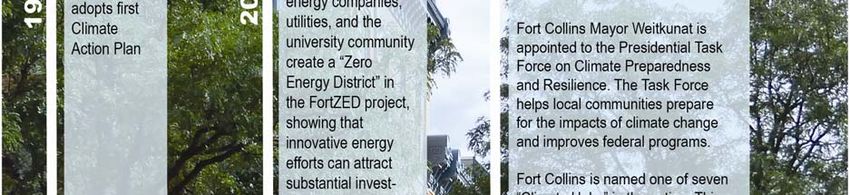
TABLE OF CONTENTS                                                                  Chapter 3 - Emissions
                                                                                   Reduction Strategies ............ 17
Executive Summary ................ 1                                               BUILDINGS: BOOSTING EFFICIENCY,
                                                                                       COMFORT AND HEALTH.................................... 18
EMISSIONS TRENDS AND
                                                                                   ADVANCED MOBILITY: MAKING
    PREVIOUS TARGETS ........................................... 1
                                                                                       TRANSPORT FASTER, MORE
SETTING NEW GOALS.................................................. 2
                                                                                       CONVENIENT AND CLEANER ........................... 22
2015 CLIMATE ACTION PLAN FRAMEWORK.............. 3
                                                                                   ENERGY SUPPLY AND DELIVERY: THE SHIFT TO
ESTIMATED EMISSIONS REDUCTIONS
                                                                                       RENEWABLE ENERGY RESOURCES ............... 27
    BY STRATEGY ....................................................... 4
                                                                                   WASTE REDUCTION /
FROM PLANNING TO ACTION ..................................... 5
                                                                                       MATERIALS REGENERATION ........................... 32
A ROLE FOR EVERYONE ............................................. 5

Chapter 1 - Need for                                                               Chapter 4 - Triple Bottom
Climate Action ......................... 6                                         Line Considerations ............. 38
                                                                                   PRELIMINARY COSTS AND
WHY CLIMATE CHANGE MATTERS
                                                                                       SAVINGS ESTIMATES ........................................ 38
    IN FORT COLLINS ................................................. 6
                                                                                   FINANCING OPPORTUNITIES ................................... 39
MULTIPLE CO-BENEFITS OF
                                                                                   INCREASED RESILIENCY .......................................... 42
    CLIMATE ACTION .................................................. 7
                                                                                   TRIPLE BOTTOM LINE IMPACTS .............................. 43
ROLE OF CITIES............................................................ 8
                                                                                   SUPPORT FOR CITY
FORT COLLINS’ CLIMATE COMMITMENT................... 8
                                                                                       CITY STRATEGIC PLAN OBJECTIVES .............. 44
WHY ACCELERATE FORT COLLINS’
    CLIMATE ACTION GOALS .................................. 10
THE RISKS ................................................................... 10
                                                                                   Chapter 5 - What does this
WHY FORT COLLINS CAN SUCCEED ....................... 11                            mean for the Community? ... 46
                                                                                   HOUSEHOLDS ............................................................ 46
Chapter 2 -                                                                        BUSINESSES .............................................................. 46
Framework for Action ........... 13                                                CITY OF FORT COLLINS GOVERNMENT ................. 47
THE PROCESS ............................................................ 13
WHERE ARE WE STARTING? .................................... 13
                                                                                   Chapter 6 - Actions for
PROJECTED FUTURE EMISSIONS............................ 14                          2015 and 2016 ....................... 48
                                                                                   PLANNED ACTIONS ................................................... 48
                                                                                   RECOMMENDED NEW ACTIONS .............................. 49

                                                                                   Chapter 7- Accountability:
                                                                                   Plan, Do, Check, Act ............. 50
                                                                                   ANNUAL REPORT ....................................................... 50
                                                                                   METRICS ..................................................................... 50
                                                                                   PERIODIC CAP UPDATE ............................................ 50
                                                                                   GLOSSARY OF TERMS .............................................. 51

ii                                                                                          CLIMATE ACTION PLAN FRAMEWORK – March 2015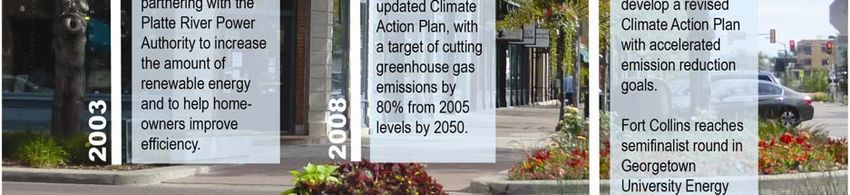
Executive Summary The science is clear - climate change is already occurring and is no longer a distant threat. And the cost of inaction is unacceptable. Globally, the rise in temperatures has profound implications for natural resources, economic prosperity, health and human development. Fort Collins has long committed to reduce community greenhouse gas (GHG) emissions and to increasingly monitor local vulnerability to higher temperatures and actively explore ways to adapt and become more resilient. Since 1999 Fort Collins has pursued deliberate actions to reduce community GHG emission and make a difference within our community that has global benefits. To date, Fort Collins has reduced its greenhouse gas emissions five % below 2005 by partnering, educating and inspiring the community. Now , pursuant to City Council Resolution 2014-028, this Climate Action Plan (CAP) Framework has been developed to explore what it would take to achieve reductions in community GHG emissions of: 20 percent below 2005 by 2020, 80 percent below 2005 by 2030, and carbon neutrality by 2050. EMISSIONS TRENDS AND PREVIOUS TARGETS Fort Collins has calculated and reported its community GHG emissions since 1999 and focused its GHG reduction efforts on its largest emissions sources: electricity, natural gas, ground travel, and solid waste. Overall emissions are down 5% since the baseline year 2005, with the largest improvement seen in reducing emissions from community-generated solid waste. It is significant that these decreases occurred over a period of sizeable growth in population (16%) and economic prosperity (22% as measured by sales and use tax collections). FIGURE 1. FORT COLLINS COMMUNITY GREENHOUSE GAS EMISSIONS * Airline travel has been removed from the community greenhouse gas inventory. CLIMATE ACTION PLAN FRAMEWORK – March 2015 1
2. FORT COLLINS GREENHOUSE GAS EMISSIONS, SALES & USE TAX* AND POPULATION
*Does not include the Keep Fort Collins Great tax collections.
25%
GREENHOUSE GAS EMISSIONS
20% POPULATION
FORT COLLINS SALES & USE TAX
*
15%
% CHANGE FROM 2005
10%
5%
0%
-5%
-10%
-15%
From 2008 through 2014, Fort Collins City Council targeted community GHG reductions at 20% below 2005
levels by 2020 and at 80% below 2005 by 2050. Our recent experience suggests that reaching an additional
15% carbon reduction in five years remains a challenge unless we rethink our approach. While no single step
can reverse climate change effects, Fort Collins can pursue more reduction strategies, take advantage of leading
edge technologies, and engage more citizens across our community in this effort to reduce carbon pollution.
SETTING NEW GOALS
Comparing the trend in community GHG emissions to the 2008 goals, it has become increasingly clear that
additional strategies are needed to spur additional action. Fortunately, targeting higher GHG reductions and
accelerating our actions to achieve these reductions provides a range of benefits that can appeal to all segments
of the community. Many residents choose to live in Fort Collins because of its natural beauty and their enjoyment
of an active outdoor lifestyle, and therefore will continue to support increased pedestrian and bicycling
transportation options and access. Businesses are attracted to the local innovative, entrepreneurial spirit and are
willing to embrace new technologies that help reduce use of energy and other resources. Citizens of all ages
want to see increased local job opportunities arise out of greening our buildings, generating energy from
renewable sources, and creating transportation systems that serve more while using fewer fossil fuels. Many
may enjoy opportunities to improve the comfort of their homes while reducing utility usage and costs through
their retirement years.
In 2014 City Council demonstrated a willingness to consider more aspirational GHG reduction goals of:
20% below 2005 levels by 2020
80% below 2005 levels by 2030
100% below 2005 levels by 2050 (carbon neutral)
2 CLIMATE ACTION PLAN FRAMEWORK – March 2015
City Council then acted by authorizing formation of a citizen advisory committee to explore what it would take to
meet these objectives, and directing staff to conduct analyses of the steps necessary to meet these GHG
reduction objectives.

The value of goal setting cannot be underestimated. By setting a goal that makes Fort Collins a leader in the
transition to a clean energy economy, the City may stimulate local innovation and entrepreneurial activity, attract
new partners and outside capital, and encourage funding for cutting edge research and development.
Community-wide goals provide a framework for public and private stakeholders to collaborate, and also
encourage coordinated actions that simultaneously boost the community’s engagement, competitive spirit, and
sense of pride.

2015 CLIMATE ACTION PLAN FRAMEWORK
This document provides a framework for climate action planning to guide implementation of a new set of
strategies that strive for more dramatic GHG reductions in Fort Collins. It is the result of a 9-month planning
effort that engaged a core analytical team, a Citizen Advisory Committee, and input from experts across the
nation to investigate state-of-the-art reduction tactics, and existing and best practices. The research and
preliminary numerical modeling that was conducted to investigate strategy interrelationships and community
impacts provides an initial understanding of what is possible. More detailed planning for implementation will be
required for each strategy that incorporates emerging technologies, pricing and market information, and
available financing tools. We will also learn through piloting new programs and projects. Each implementation
step will build upon previous steps and incorporate lessons learned.

Of course, there are associated costs and risks tied to both pursuing aggressive climate action and to not taking
these actions or delaying them. We must be mindful to not deploy technologies before they are fully developed
or have become cost effective, and deliberate about ensuring the reliability of our electric supply. Investments
into the solutions will be required. We have a responsibility to manage initial costs to lessen upfront impacts and
avoid inequities. But doing nothing or delaying accelerated reduction scenarios runs the risk of continued fossil
fuel dependence, with its impending carbon regulations. At the same time, inaction can lead to even greater
traffic congestion and worsening air quality.

The City’s communications strategy is vital to the success of these planning efforts. We need to continue the
steady, responsible actions already underway to reduce GHG emissions while engaging even more residents
and businesses in Fort Collins. The new strategies described in this framework plan will bring more choices to
more people, and these opportunities should be communicated broadly to Fort Collins' citizens to ensure
successful adoption.

CLIMATE ACTION PLAN FRAMEWORK – March 2015                                                                            3

ESTIMATED EMISSIONS REDUCTIONS BY STRATEGY
The estimated total carbon reductions for the suite of strategies and tactics described in this framework plan
come within 10 to 15% of City planning objectives to reduce emissions 20% below 2005 levels by 2020, 80%
below 2005 levels by 2030 , and achieve carbon neutrality by 2050.

FIGURE 3. ESTIMATED PERECENT OF TOTAL EMISSIONS REDUCTIONS FROM CAP FRAMEWORK
STRATEGIES BELOW ADJUSTED BUSINES AS USUAL FORECAST
                                                                     2020            2030           2050
 Buildings: Boosting Efficiency, Comfort and
 Health
 Build in Efficiency From the Start                                  3%              2%             3%
 Make Existing Homes More Efficient                                  20%             15%            21%
 Increase Energy Efficiency in the Institutional,
 Commercial, and Industrial Sectors
                                                                     27%             18%            21%
 `Advanced Mobility: Making Transport Faster,
 More Convenient and Cleaner
 Shift Land Use Patterns to Shorten Trips and Reduce
 the Need to Drive                                                    7%              4%             5%
 Drive Adoption of Multimodal Transport                               3%              3%             3%
 Accelerate Adoption of Fuel Efficient and Electric
 Vehicles                                                             2%              2%             6%
 Energy Supply and Delivery: The Shift to
 Renewable Energy Resources
 Advance Utility-Scale Renewable Energy Supply                       0%              30%            11%
 Advance Residential and Commercial Solar Adoption                   18%             14%            10%
 Shift Heating Loads to Biofuels, Geothermal, and
 Electrification                                                      3%              4%            12%
 Waste Reduction and Materials Regeneration
 Road to Zero Waste /Carbon Sequestration                            17%             7%             9%
 Carbon Sequestration
FROM PLANNING TO ACTION
An appropriate next step will be to compile a 2020 Climate Action Implementation Plan that outline actions
required to meet community GHG goal for 2020 and put Fort Collins on a trajectory to meet an aspirational 2030
GHG reduction objective. Detailed steps that lay out schedules, milestones, resources, and metrics will be
developed to ensure proper sequencing and integration of strategies. Determining critical timing and funding
strategies for key strategies must be coordinated across City departments and support must be sought from
community businesses and leaders. And perhaps most importantly, community awareness raising and
engagement must be successful in order to put the Implementation Plan into motion.

A ROLE FOR EVERYONE
Every community member has a stake in this effort. We all can play a role – be it small or large – to building a
new pathway towards a more sustainable future. It could be a simple as installing a smarter and simpler-to-use
programmable thermostat that cuts your energy use, or riding the bus or your bike more often. Others might
consider investing in an electric vehicle (EV) or residential rooftop solar. Businesses might invest in rooftop solar
or offer their employees new opportunities that address carbon reduction, ranging from EV charging stations and
ride share programs to make it easier to commute while reducing the number of miles driven. We have
individual opportunities to seek solutions to this community issue and invest in those solutions, we can all derive
multiple benefits socially, economically, and for our environment now and into the future.

CLIMATE ACTION PLAN FRAMEWORK – March 2015                                                                          5

CHAPTER 1 Need for Climate Action Widespread consensus exists that human-caused emissions of greenhouse gases (GHG) are impacting Earth’s climate system, causing the potential for unprecedented, large-scale, adverse health, social, economic, financial, security, and ecological effects. The risks associated with climate change have prompted many cities to plan differently for the future, Fort Collins among them. The time to act is now The Intergovernmental Panel on Climate Change (IPCC) released a final summary report in Copenhagen in November 2014. This report underscores three major facts about climate change: Climate change is human-caused and is already having dangerous impacts across the world; If the world community acts now, warming can still be kept below the politically agreed upon "safe" limit of two degrees Celsius; The ability to secure a safe climate future is not only possible but also economically viable. The summary report also recognizes that “Mitigation can be more cost-effective if using an integrated approach that combines measures to reduce energy use and the greenhouse gas intensity of end-use sectors, decarbonize energy supply, reduce net emissions and enhance carbon sinks in land-based sectors.” This is the premise upon which Fort Collins’ Climate Action Plan Framework is built. WHY CLIMATE CHANGE MATTERS IN FORT COLLINS Here’s what the Fort Collins region can expect from climate change unless greenhouse gas emissions are dramatically reduced: Soaring summer temperatures. Days in which the thermometer climbs past 90 degrees F, once rare, will become commonplace. Climate models, down-scaled for our region, predict it is highly likely our summers will be up to 6OF higher by 2040.1 Increased heat can exacerbate ground level ozone and smog, worsen visibility and affect citizens’ health. Longer and more intense droughts. These will have cascading negative effects on all environmental fronts, from native trout viability to urban and national forest productivity. Less snowpack, with earlier snowmelt runoff. This means reduced stream flows and soil moisture in summer months, so that water may not be available when it is most needed. Despite the increasing frequency of drought conditions, the rainfall that does come may be more concentrated in heavy downpours, increasing the risks of flooding. Higher temperatures and lower soil moisture will increase the threats to forests from fire, insects, and disease, affecting recreation, the timber industry, and air and water quality. More severe heat waves and storms will threaten human health, perhaps even human lives. The Fort Collins “Extreme Heat” report documents the occurrence of more hot days and heat waves this century than in earlier decades.2 With continued climate change, the forecast is for much more extreme heat, especially if future emissions of heat-trapping pollution are high. 1Climate Change Primer for Fort Collins, 2013. (http://www.fcgov.com/climateprotection/pdf/fortcollinsclimatechangeprimer2013.pdf) 6 CLIMATE ACTION PLAN FRAMEWORK – March 2015
Fort Collins and the State of Colorado have already caught possible glimpses of the disasters that may come without quicker action to cut emissions. The 2012 High Park and Waldo Canyon wildfires, and the 2013 Black Forest fire, were the most destructive in the state’s history, destroying hundreds of homes. The September 2013 flood swept away roads, bridges and homes along the Big Thompson River and other areas, and caused more than $2 billion in regional damage. The August 2013 heat wave forced the community’s schools to close. And the mountain pine beetle, unleashed by milder winters, has decimated more than 4 million acres of forest across the state. These predicted and actual impacts illustrate what Fort Collins has at stake as humans change the climate and why reducing climate-changing pollution matters.2 MULTIPLE CO-BENEFITS OF CLIMATE ACTION Studies continue to illustrate that taking action to address climate change can be beneficial. In 2013, the Carbon Disclosure Project, along with the C40 Cities Climate Leadership Group, found that, of the 110 global cities reporting, 91% say that tackling climate change presents economic opportunities. Sixty-two percent of the reported reduction activities being undertaken by cities have the potential to make cities more attractive to businesses, with the largest attractors being energy efficiency actions and development of infrastructure for non- motorized transport.3 The Fort Collins community could realize significant ancillary economic, environmental and social benefits by undertaking responsible steps to combat climate change. Support local businesses and stimulate economic development Provide economic stimulation of research and development activities Reduce home and business energy costs for heating, cooling and lighting Reduce home and business motor vehicle fuel costs Reduce dependence on foreign fuel sources Reduce vulnerability to energy price increases and volatility Reduce peak energy demand and improve utilization of the electricity system Diversify energy supply and reduce loads on transmission system Reduce air pollution emissions including ozone precursors and fine particles Improve public health Improve local visibility Reduce waste and increase landfill diversion rates Reduce vehicle miles of travel and road congestion Reduce water consumption in the community Increase Fort Collins’ ability to adapt to a changing climate Provide opportunities for regional, state and national leadership and recognition Local governments have strong financial incentives to address climate change. Reducing local carbon emissions means pursuing a variety of programs and practices that are energy prudent, and thus ultimately fiscally responsible. 2“Extreme Heat in Fort Collins”, 2014 (http://www.fcgov.com/climateprotection/pdf/heat-report-jan-2014.pdf) 3 https://www.cdp.net/CDPResults/CDP-Cities-2013-Global-Report.pdf CLIMATE ACTION PLAN FRAMEWORK – March 2015 7
ROLE OF CITIES
With more than 80% of Americans living in urban areas,
cities play a pivotal role in addressing climate change.
The design of cities—what we consume, how we design
our buildings, how we develop our land, how we get
around, and how we deal with our waste—significantly
determines the amount of energy we use, the greenhouse
gas emissions we produce, and the risks of disruption
from climate-related weather events.

While Fort Collins’ impact on global greenhouse gas
emission is very small, leadership action is a powerful
force that can be multiplied many times over. This
capacity to inspire change is further complemented by the
City’s control of local electricity and water utility
operations. Cities like Fort Collins, and other leading
cities, have the opportunity to demonstrate to the nation
and the world that it is possible to dramatically reduce
greenhouse gas emissions, while maintaining and
enhancing its position as a healthy, prosperous and
resilient place to live, work, and play.

Cities and communities are today at the forefront of
practical, meaningful climate action. Many cities and
some states are taking action. In a recent survey of 288
major cities, more than half (53%) had committed to
reducing greenhouse gas emissions4. National and
international networks of cities, including 100 Resilient
Cities, International Council for Local Environmental
Initiatives, C40 Cities, and many others are sharing best practices and comparing results.

Local planning enables communities to craft policies that are best adapted to local values, opportunities,
constraints, and economic considerations. Communities and states that have been proactive in formulating
policies to address climate change, like Fort Collins and the State of Colorado, will be better prepared to meet
the EPA’s proposed carbon emissions regulations under Section 111(d) of the Clean Air Act.

FORT COLLINS’ CLIMATE COMMITMENT
Fort Collins has been a leader in climate protection for almost two decades, starting with the first “Local Action
Plan to Reduce Greenhouse Gas Emission” adopted in 1999. Through leadership and involvement by many,
emissions are below 2005’s baseline, at the same time that population and economy have grown. This CAP
framework is the latest in a series of progressive actions that the Fort Collins community has taken over the past
two decades to respond to increasing concerns about climate change and its global and local impacts. The goals
in this framework plan are among the most ambitious in the nation.

http://usmayors.org/pressreleases/uploads/2014/0422-report-climatesurvey.pdf
4

8                                                                   CLIMATE ACTION PLAN FRAMEWORK – March 2015
FIGURE 3. FORT COLLINS’ CLIMATE COMMITMENT

CLIMATE ACTION PLAN FRAMEWORK – March 2015   9
WHY ACCELERATE FORT COLLINS’ CLIMATE ACTION GOALS In April 2014, Fort Collins City Council passed Resolution 2014-028, calling for an ad hoc citizen advisory committee to develop, for City Council’s consideration, an updated Climate Action Plan that described the steps our community will need to take to achieve community-wide GHG reduction goals of: 20% below 2005 levels by 2020 80% below 2005 levels by 2030 100% below 2005 levels by 2050 (carbon neutral) Why? Because: Fort Collins is especially vulnerable to the effects of climate change, so enhanced actions to reduce emissions and prepare for climate change are needed. New opportunities have emerged to reduce local emissions since the 2008 Climate Action Plan was adopted. Fort Collins is uniquely positioned to demonstrate to other communities how deep reductions in GHG emissions can be made while remaining economically vibrant. Most countries have acknowledged the threat of climate change and are making commitments, or issuing rules and regulations, to reduce emissions. Some community climate action plans, such as Fort Collins’ 2008 plan, call for an 80% reduction in carbon emissions by 2050 in an effort to limit global warming to two degrees centigrade (3.6 degrees F). However, many scientists believe that this goal is simply not aggressive enough, calling a 2-degree global warming limit a “prescription for disaster.” A clear, long-term goal allows Fort Collins to determine in advance the major efforts and initiatives it must undertake as a community over the next two to three decades, and to identify and prioritize near term actions. By setting a goal that makes Fort Collins a leader in the transition to a clean energy economy, the City has the potential to stimulate local innovation and entrepreneurial activity, attract new partners and outside capital, and encourage funding for cutting edge research and development. Such an aspirational goal may drive more action to reduce emissions than would occur without a goal and plan and could boost the community’s engagement, competitive spirit, and sense of pride. United action could bring many benefits to Fort Collins—and make a compelling case for other communities to quickly follow suit. The benefits of a long-term aspirational goal and a Climate Action Plan framework include: opportunity to analyze options and prioritize actions establish a process for tracking, evaluating, and recalibrating provide clarity and inspiration to the community and other potential partners/allies align and combine the strengths of the private/public sectors THE RISKS Accelerating the City’s emissions reductions targets is not without cost or risk. At the same time, the risks of not taking aggressive action against climate change are significant. Fort Collins is now largely dependent on coal and natural gas to generate electricity and heat for homes, and on oil to fuel vehicles. Simply maintaining the current electricity grid, local residential/commercial building stocks and transportation system to 2030 and 2050 is expensive. Delaying implementation strategies may not be fiscally prudent. As the U.S. and other countries move towards mandatory curbs on greenhouse gas emissions, the costs associated with carbon-generating activities will increase. Some of the risks are outlined below. 10 CLIMATE ACTION PLAN FRAMEWORK – March 2015
FIGURE 4. TO ACT OR NOT TO ACT - BOTH CHOICES HAVE RISKS AND COSTS
Risks of inaction (business as usual) Risks of accelerated climate action
Significant opportunity cost: Investing too early:
Fort Collins loses its position as a leader in the clean Technologies may not yet be fully developed or cost-
tech market and misses out on opportunities to attract effective.
funding, investor capital and innovative businesses.
Inequitable impacts:
Greater congestion and worsening air quality:
Costs may not be borne equally across the
Failure to significantly reduce onsite combustion from community, leading to inequities.
transportation reduces Fort Collins’ quality of life and
attractiveness as a community.
Less reliable electricity:
Adding lots of renewable electricity to the grid could
Carbon regulation (and costs) imposed on Fort
result in instability if not properly managed.
Collins:
New national rules could impact citizens and
Higher costs:
businesses by applying a cost to carbon emitting
activities. Steps to boost efficiency and add renewable power
will require increased upfront investment by the City
and its businesses and taxpayers. (
Continued fossil fuel dependence:
Fossil fuel price spikes and fuel supply shocks may
hurt the local economy.
Care must be taken to manage the risks outlined above. Risks of accelerated action must be managed through
careful program design, pilot testing and refinement where appropriate, and vetting with the community and
stakeholder groups.
WHY FORT COLLINS CAN SUCCEED
Achieving aspirational, long term greenhouse gas reduction goals will not be easy. It will require community
involvement and ownership in seeking and implementing solutions. It will require finding new and innovative
ways to finance upfront costs. However, Fort Collins is well positioned to be among the leaders in advancing
greenhouse gas reduction at the community level for several reasons, outlined below:
A strong foundation of existing community, City and utility programs ,such as an award-winning Utility that
consistently provides highly reliable power, the recent successful Renewable and Distributed System
Integration (RDSI) project, Advanced Metering Fort Collins (AMFC) rollout, existing extensive pedestrian- and
bicycle-friendly infrastructure and a transit oriented development/land use code. The City offers a
comprehensive portfolio of efficiency programs garnering savings that are amongst the best in the country
and regularly enhances programs to enable additional community participation.
A highly engaged and collaborative business community. Numerous local businesses already have
voluntarily committed to reduce GHG emissions through City programs. Among them are several prominent
leaders whose standing in the community and focus on sustainable initiatives make them effective drivers of
change. The business sector leads the way in annual efficiency savings, with over 40% of community
businesses participating in programs and services provided by Fort Collins Utilities.
CLIMATE ACTION PLAN FRAMEWORK – March 2015 11 Owning an electric utility with a collaborative regional power supply partner. Municipal ownership brings
greater control of energy decisions, access to low-cost capital and flexible financing, and potential for
collaboration with other communities. The City of Fort Collins has ownership in Platte River Power Authority
(Platte River), along with three neighboring communities (Longmont, Estes Park, and Loveland), which further
provides benefits in regional decision-making that guides generation production, as detailed in Fort Collins
Utilities Energy Policy.
A partnership with Colorado State
University. As a leader in climate
change research and education,
CSU can help Fort Collins shape and
implement its energy transformation.
The University has its own
aggressive goals to achieve carbon
neutrality (and alone accounts for
about a fifth of Fort Collins’
population).
A Platinum Bike Friendly
Community. Bicycling has become a
primary means of transportation for
many, a major form of recreation for
most, and a significant factor in
Colorado State University – Energy Institute
attracting new businesses and new
residents to Fort Collins. The 2014
Bicycle Master plan sets a vision for the year 2020, whereby one in five people will ride a bike, and bicycle-
related crashes will be fewer than today.
Citizen surveys show interest in taking action to address climate change .The 2011 Fort Collins Air
Quality/Recycling survey indicates that a resounding 86% of citizen agree or strongly agree that “governments
should offer voluntary programs that enable citizens and businesses to reduce climate change”. Another 74%
agree or strongly agree that “governments should enact legislation and regulations intended to reduce climate
change”.
Continued support from philanthropy and other levels of government. Foundations like the New Belgium
Family Foundation and the Argosy Foundation have already begun to invest in strategies described in the
CAP framework in anticipation of significant future social and economic benefits to the community.
Tangible experience being on the innovation edge of climate action. The City has launched landmark
local initiatives like the FortZED zero energy district and the plan for Zero Waste by 2030. It has also
contributed to national programs like the USDA’s Climate Hubs program and the Presidential Task Force on
Climate Preparedness and Resilience, in which the mayor was an active participant. Fort Collins was a
founding member of the Colorado Clean Energy Cluster and the Water Innovation Cluster, whose initiatives
are advancing innovative climate solutions locally.
12 CLIMATE ACTION PLAN FRAMEWORK – March 2015CHAPTER 2 Framework for Action THE PROCESS This Climate Action Plan framework has been developed in response to Resolution 2014-028. The City first established a 23-member Citizens Advisory Committee and assembled a team of expert analysts and advisors, including members of City staff and outside consultants. The Committee and the experts then assessed how the City could achieve the ambitious goals, and also estimated the costs and benefits to the community of doing so. Key elements for developing the framework included:: A core analytical team, led by the City and supported by Brendle Group and Rocky Mountain Institute (RMI), assessed the implications of using different strategies to achieve the goals. In addition, Platte River has analyzed scenarios indicating changes in power production required to meet the City’s electricity supply needs in support of an updated CAP. A Citizens Advisory Committee (CAC), comprised of members from many different parts of the Fort Collins community, met nine times to provide ideas, input and guidance. Ideas for strategies and tactics to achieve climate action goals were generated from the CAC, the core team, and interviews with more than 40 leading experts and specialists from Fort Collins and around the nation. A preliminary triple bottom line evaluation was applied to assess potential aspects of the framework plan’s economic, environmental and social implications. The journey toward a2030 goal of reducing emissions by 80%, and a 2050 goal for carbon neutrality is a long one, which will require adjustments over time. Strategies and tactics will inevitably shift and evolve, even as the long-term target remains the same. A key element of this plan, therefore, is to provide a framework to periodically reevaluate—and alter as needed— actions that the City is taking. WHERE ARE WE STARTING? Currently, 97% of GHG emissions are generated by burning coal, oil and natural gas (Figure 5). Natural gas accounts for 20% of emissions, almost all of it from the gas used to heat our buildings, cook our food and power industrial processes. Meanwhile, the petroleum that fuels our cars, buses, trucks and other vehicles is responsible for another25% of total emissions. Fort Collins’ community GHG accounting follows standardized accounting protocols for communities, which is “production based”, focusing on fossil fuel combustion directly associated with community activities. Although it does not incorporate the life-cycle emission embodied in all the products and materials we use in our daily lives (“consumption-based” accounting), information about the carbon footprint of products is important to share with citizens, further empowering their choices to reduce their carbon footprint. CLIMATE ACTION PLAN FRAMEWORK – March 2015 13
FIGURE 5. FORT COLLINS COMMUNITY 2013 GREENHOUSE GAS EMISSIONS BY SOURCE*
*Airline travel excluded.

Fort Collins emits about 14.7 metric tons of CO2equivalent per capita annually, down from 18.0.tons per capita in
2005. Fort Collins’ emissions are lower than national averages for the U.S. as a whole and for Colorado, thanks
in part to deliberate efforts undertaken in recent years to reduce emissions. But our dependence on fossil fuels
remains high, and our overall emissions exceed those of a majority of the world’s population on a per capita
basis, including some cities with significantly higher per capita gross domestic product (GDP) than Fort Collins.

PROJECTED FUTURE EMISSIONS
Fort Collins’ community total GHG emissions are projected to increase 16% by 2030 and 39% by 2050, above
2005 levels, in the absences of additional actions to curb them. This projection is referred to as the ”Business
As Usual” forecast.

Fortunately, some actions are anticipated that will lower emissions as a result of actions that are outside the
direct control of the Fort Collins community or City government. Increased federal standards for vehicle fuel
efficiency (Corporate Average Fuel Efficiency, or CAFE) are expected to lower emissions in the Fort Collins
community by 12% by 2050. Greenhouse gas emissions from Fort Collins’ electric supply could drop if Platte
River decides to proceed toward the guidelines established by the Platte River board in 2013. These guidelines
were established for a study of options that could: (1) reduce emissions 20% below 2005 levels by 2020 and
80% by 2050, (2) achieve 20% energy supply from renewable sources by 2020 (not including existing
hydropower), (3) maintaining reliability through minimum 15% reserve margin, and (4) remaining the lowest cost
wholesale electric supplier located in Colorado. Since 2013, Platte River has already added 60 MW of new wind
generation and the Board has approved installation of up to 30 MW of solar generation at the Rawhide site.
Additional changes may be considered over time based on Platte River’s ongoing resource planning efforts.

14                                                                  CLIMATE ACTION PLAN FRAMEWORK – March 2015
Subtracting the anticipated benefits of the CAFE vehicles standards and assuming CO2 reductions associated
with Platte River’s study guidelines are implemented, total Fort Collins projected emissions could drop. This is
referred to as the “Adjusted Business As Usual” scenario. Note that no changes to electric supply from Platte
River have been approved, but are assumed to have been implemented in this Adjusted Business As Usual
scenario. The strategies identified in this CAP framework strive to fill in the gap between the “Adjusted Business
As Usual” emissions level and what would be needed to accomplish emissions reductions of 20% by 2020, 80%
by 2030, and carbon neutrality by 2050.

FIGURE 6. FORT COLLINS GHG EMISISONS FORECAST AND REDUCTONS NEEDED (MTCO2E)
                                              2005           2020            2030             2050
 Business As Usual Forecast
 Emissions (with projected heat
 increase)                                   2,343,000      2,433,000       2,711,000         3,265,000
 Adjusted Business As Usual
 Reductions
 - federal vehicles fuel efficiency
    standards
 - Platte River Power Authority
    2013 study guidelines                                 - 567,000      - 951,000           -1,739,000
 Adjusted Business As Usual (ABAU)
 Forecast Emissions                                        1,866,000     1,760,000          1,526,000
 Target % (below 2005)                                           20%             80%               100%
 Target Emissions                                           1,874,000         469,000                  0
 Needed Reductions from ABAU                                   -8,000       1,291,000          1,526,000

CLIMATE ACTION PLAN FRAMEWORK – March 2015                                                                      15
16 CLIMATE ACTION PLAN FRAMEWORK – March 2015
CHAPTER 3
Emissions Reduction Strategies
This chapter describes a framework of actions the community can take to substantially meet accelerated
greenhouse gas reduction goals. The selection of strategies and tactics included in this framework plan is based
on research and analysis covering all emissions categories. More than 100 individual tactics were evaluated,
from City-led efficiency programs to entrepreneurial mobile applications and services. They were based on
interviews with more than 40 local, regional and national experts and analysis by independent consultants.
The strategies and tactics described here are grouped in four major sectors:
reduce energy use in buildings
reduce energy use in transportation
reduce emissions from electricity
reduce waste and eliminate landfill emissions by recycling or composting
FIGURE 7. ESTIMATED PERECENT OF TOTAL EMISSIONS REDUCTIONS FROM CAP FRAMEWORK
STRATEGIES BELOW ADJUSTED BUSINES AS USUAL FORECAST
2020 2030 2050
Buildings: Boosting Efficiency, Comfort and Health
Build in Efficiency From the Start 3% 2% 3%
Make Existing Homes More Efficient 20% 15% 21%
Increase Energy Efficiency in the Institutional, Commercial, and
Industrial Sectors
27% 18% 21%
`Advanced Mobility: Making Transport Faster, More
Convenient and Cleaner
Shift Land Use Patterns to Shorten Trips and Reduce the Need
to Drive 7% 4% 5%
Drive Adoption of Multimodal Transport 3% 3% 3%
Accelerate Adoption of Fuel Efficient and Electric Vehicles
2% 2% 6%
Energy Supply and Delivery: The Shift to Renewable Energy
Resources
Advance Utility-Scale Renewable Energy Supply 0% 30% 11%
Advance Residential and Commercial Solar Adoption 18% 14% 10%
Shift Heating Loads to Biofuels, Geothermal, and Electrification 3% 4% 12%
Waste Reduction and Materials Regeneration
Road to Zero Waste /Carbon Sequestration 17% 7% 9%
Carbon SequestrationBUILDINGS: BOOSTING EFFICIENCY, COMFORT AND HEALTH The building sector is the Fort Collins community’s top energy consumer and its number one contributor to greenhouse gas emissions. While Fort Collins’ current retail electricity and natural gas prices are low compared to national averages, most efficiency measures may be even cheaper to employ. This section describes strategies to reduce energy use in existing buildings and reduce energy use in new buildings. Although energy efficiency alone will not enable Fort Collins to reach an 80% reduction in GHG emissions by 2030, efficiency and conservation measures are typically the most cost-effective approach to reduce emissions and represent the best place to start and/or expand programs. By reducing the overall demand for energy, building efficiency also makes it more feasible to transition to a carbon-neutral energy system. BENEFITS OF GREEN BUILDINGS Research on the benefits of increasing building energy efficiency (incorporating green building concepts into our new and existing homes and businesses) shows tremendous social and economic benefits. When green built schools provide more daylight for the learning environment, children progressed through school curricula 20 to 26% faster5; the net economic and health benefits of green schools has been reported to be $63/square feet.6 Retail stores that installed skylights have reported 40% increases in gross sales.15 Increased worker productivity has been well documented for LEED- certified, ENERGY STAR, and other high performance green commercial and industrial buildings. Studies have demonstrated that green buildings provide up to 18% lower employee turnover, 21% higher employee morale, 22% easier recruiting of employees, and 23% more effective client meetings.7 The benefits derived from higher ventilation rates promoted in green buildings are especially important in high density buildings such as hospitals, nursing homes, and childcare facilities and can account for 50% to 370% reductions in rates of respiratory illnesses.8 Two studies documented a 7.1% rental premium for LEED-certified retrofit buildings9 and a 16% rental premium for new LEED-certified buildings.10 Challenges to accelerated action in the building sector include developing financing programs and business models that enable more cost-effective and broader uptake of efficiency measures without impacting affordability in Fort Collins, addressing issues unique to rental properties, finding solutions to address the unique 5Heschong, Lisa. HeschongMahone Group. “Daylight and Retail Sales.” California Energy Commission: Pacific Gas and Electric Company. Fair Oaks, California, 2003: http://www.terrapinbrightgreen.com/reports/the- economics-of-biophilia/#footnote-22. 6Greening America’s Schools, Cost and Benefits, Gregory Kats, October 2006. 7CBRE and USD Survey Data 2009; U.S. Bureau of Labor and Statistics 2008; Occupational Employment Statistics, 2009 - Miller N.G., Dave Pogue, Quiana D. Gough, and Susan M. Davis; Green Buildings and Productivity (Vol. 1, No. 1-2009, Journal of Sustainable Real Estate). 8Elzeyadi, I. “Daylighting-Bias and Biophilia: Quantifying the Impacts of Daylight on Occupants Health”, Thought and Leadership in Green Buildings Research;Greenbuild 2011, Proceedings, Washington, DC: USGBC Press. 2011 (http://www.terrapinbrightgreen.com/reports/the-economics-of-biophilia/#footnote-22). 9Kok, N., Miller, Norman G., and Morris, Peter, 2012, The Economics of Green Retrofits, Journal of Sustainable Real Estate. 10Eichholtz, Piet M.A., N. Kok, and J.M. Quigley. Doing Well by Doing Good: Green Building Attributes. Building and Environment, 45:11, 2553-2561 as cited in Kok, N., Miller, Norman G., and Morris, Peter., 2012, The Economics of Green Retrofits, Journal of Sustainable Real Estate. 18 CLIMATE ACTION PLAN FRAMEWORK – March 2015
needs of commercial and industrial facilities, and successfully raising awareness and motivating citizens and
business to understand the benefits of energy efficiency and invest in those solutions.
2030 Buildings Vision
Annual reductions in buildings’ energy use reaches 3% percent per year by 2030.
Existing homes and businesses will use 36% less energy than today.
New construction will use ~30% less energy than under today’s code.
FIGURE 8. SUMMARY OF ESTIMATED GHG BENEFIT OF BUILDINGS STRATEGIES (MTCO2E)
2020 2030 2050
Buildings: Boosting Efficiency, Comfort
and Health
Build in Efficiency From the Start 8,000 24,000 34,000
Make Existing Homes More Efficient 55,000 165,000 247,000
Increase Energy Efficiency in the
Institutional, Commercial, and Industrial
Sectors 73,000 207,000 252,000
Strategy: Build in Efficiency from the Start
Fort Collins’ many historic structures show that buildings can have useful lives for scores or even hundreds of
years. That longevity emphasizes the importance of designing new construction to be as energy efficient as
possible. Building it right the first time locks in energy savings and that brings benefits for decades to come. By
2030, the following actions could reduce energy consumption in this new construction by 30% compared to
business as usual.
This framework plan builds on the City’s longstanding green building efforts by continually raising the bar for high
performing buildings while supporting and rewarding beyond-compliance efforts. Tactics under consideration
include:
Increase energy efficiency in new construction
Continue to adopt the latest energy codes for new residential and commercial buildings along with specific
local requirements to exceed minimum standards.
Engage local builders to determine best practices for meeting and exceeding code requirements, and connect
contractors with the training and resources needed to deliver efficiency savings at the scale required to meet
the goals.
Ensure new buildings meet codes to realize the expected savings.
Reward builders who go beyond the efficiency codes with incentives programs.
Encourage “demand-response” for new residential construction
Consider incentives or requirements for demand-response, which calls for home energy management
systems to be built into all new residential construction. Combined with `smart’ appliances, demand-
CLIMATE ACTION PLAN FRAMEWORK – March 2015 19response enables voluntary or programmed pauses in appliance use during peak times, and helps
encourage residents to re-schedule tasks for periods of low demand.
Consider establishing variable energy pricing, so the price of energy rises and falls depending on demand.
This provides an incentive for homeowners to adjust their energy use help and lower the peak demand in
the community. It also gives homeowners the chance to save substantial amounts of money—and to benefit
the entire system—by moving tasks, such as washing clothes, to periods of lower demand and thus of
cheaper electricity.
Strategy: Make Existing Homes More Efficient
The majority of homes in 2030 and 2050 will be buildings that already standing today, so it is crucial to boost the
energy performance of today’s existing homes. Fort Collins’ citizens will reap additional benefits of efficient
homes, such as improved comfort and indoor environmental quality. A two-pronged approach to reducing energy
use in existing homes will be most effective; first by retrofitting homes to be more energy efficient, and secondly
by conducting educational campaigns to help residents learn to live more efficiently in their homes.
Boost energy efficiency in existing homes
Continuously improve efficiency programs to be more effective, and ensure adequate funding to meet interest
from customers.
Develop new service and product models that enable homeowners to participate in energy efficiency
improvements without upfront costs, by allowing improvements to be paid back over time in utility bills.
Promote new technologies for efficient consumer products and smart homes.
Consider requirements for rating and communicating the efficiency of homes for sale and for rent.
Provide tools and resources to help households manage their energy use.
Build on Fort Collins’ strong sense of community with a public awareness and educational campaign that
helps citizens take action.
Strategy: Increase Energy Efficiency in the Institutional,
Commercial, and Industrial Sectors
Boosting efficiency of commercial buildings requires a more tailored approach, compared to residential homes,
because the uses and requirements of businesses vary so widely. Tactics for non-residential buildings include
policy mechanisms, innovative business models, and a range of potential programs that target small and mid-
sized businesses as well as the largest commercial property owners and the highest energy users in industry.
Lead by doing. By setting a goal of cutting the energy use in municipal government buildings by upwards of
30 percent by 2030, the City will set an example to the rest of the community. The City can test efficiency
approaches and funding models applicable to commercial buildings in the private sector.
Collect and publicize data on energy use. Explore requirements for the annual energy consumption of
large public, commercial and multi-family properties to be reported and made available to the public. A
number of cities, including New York and Seattle, already require public disclosure of energy use.
Raise standards. Buildings can be assessed and compared by their annual energy use per square foot, a
measure called Energy Use Intensity (EUI). The City should ensure that each of its municipal buildings in a
particular category achieve a reasonable level of EUI.
20 CLIMATE ACTION PLAN FRAMEWORK – March 2015 Create innovative new approaches to provide energy efficiency programs to customers. Business models being considered streamline the process for individuals to sign up, and cut down on costs, from initial contracting, to installation, to periodic measurement and verification. Provide expert advice. The City can work with the largest industrial facilities in Fort Collins to identify and engineer changes that significantly reduce buildings’ energy use. Implement new rules. The City could look at a variety of new building construction codes, including: installation of efficient lights in non-residential spaces; ensure the energy use of individual tenants in commercial and retail buildings is metered and billed to the tenants; require that buildings be re- commissioned once every decade to ensure that basic systems are operating at optimal performance levels; and, require commercial customers to participate in demand-response programs. Training and required certification of building operators. Making sure that building operators have the necessary technical expertise to help keep systems running at maximum efficiency. Build awareness. An educational campaign focused on businesses can help incentivize and motivate the private sector to take a significant role in the community-wide effort to cut greenhouse gas emissions. Continually Improving. Business savings from efficiency have led the way for community savings since 2004. Continue to improve the programs for assessments, incentives and technical assistance to reach all types of businesses. CLIMATE ACTION PLAN FRAMEWORK – March 2015 21
ADVANCED MOBILITY: MAKING TRANSPORT FASTER, MORE
CONVENIENT AND CLEANER
Fort Collins consumed 62 million gallons of gasoline and
diesel in 2013 as people drive to work and school, deliver
products and services, run errands, and perform the daily
tasks required to keep commerce and life running smoothly.
Fort Collins’ street system, buses, and pedestrian and bicycle
infrastructure are designed and maintained to meet the
highest standards. But in addition to the many benefits it
provides, Fort Collins’ transportation system also comes with
significant costs. All told, transportation accounts for 25% of
Fort Collins’ total greenhouse gas emissions, and is
responsible for significant financial, as well as health and
societal, impacts.

In addition to generating GHGs, burning gasoline and diesel to
fuel vehicles is also the major source of local “criteria” air
pollutants like NOx, SO2, and particulate matter. Air pollution
contributes to asthma and other illnesses in Fort Collins,
where one in four residents have respiratory problems.11 In
addition, transportation energy is an expensive drain on the
local economy.12The infrastructure necessary to support
combustible fuels will continue to be capital-intensive, and
future fuel costs will continue to be volatile. In contrast to
buying homegrown products and services, money spent on gasoline and diesel flows out of the community to
refineries and producers elsewhere in the country or the world, contributing to global political and security risks
from importing oil.

The good news is that the transportation sector is already on a path to reduce GHG emissions and other
pollutants because of aggressive new national fuel economy standards set in 2012, which require 54 MPG
average gas mileage for new vehicles by 2025. In order to meet these targets, all cars and trucks will be
required to be more aerodynamic, and lighter, with improved engine technology. Increases in electric vehicle
adoption are also anticipated.

This framework plan includes strategies that have the potential to reduce Fort Collins’ transportation energy use
even further. Strategies in the plan put more dollars back in people’s pockets in saved fuel costs, while also
providing greater transport options, ease, and convenience to the community. As described in Fort Collins’ 2011
Transportation Master Plan,13 the City is already pursuing a number of interventions to capture these benefits.

Accelerating these activities and adopting more aggressive community-wide goals will reduce transportation
emissions of GHGs even further and result in a net savings in fuel costs and avoided vehicle maintenance for

11 Reference: Breathe Wheezy, Scientific American, Jan 9 2013, http://www.scientificamerican.com/article/traffic-
pollution-and-asthma/ .
12The costs of congestion and air pollution alone, aside from the other external costs of motor vehicle traffic, are

estimated at $260,000 each year in Fort Collins, according to Victoria Transportation Institute, Evaluating Public
Transit Benefits (2014), http://www.vtpi.org/tranben.pdf, .
13“Fort Collins Transportation Master Plan,” City of Fort Collins, 2/14/11.

http://www.fcgov.com/PlanFortCollins/pdf/tmp.pdf

22                                                                    CLIMATE ACTION PLAN FRAMEWORK – March 2015
the community. Transitioning to a more advanced, low carbon transport system will also reduce significant
additional external costs the community pays for transport today, which include the cost of accidents, parking,
congestion, road facilities, roadway land value, traffic service, air pollution, noise, water pollution, and other
resource externalities which can add $0.202/passenger mile.14

Challenges to accelerated action in this area include continuing to raise awareness and build community support
for increased infill densities, addressing barriers associated with infill development, informing consumers about
the life-cycle costs of transportation choices, and funding infrastructure needs associated with transit expansion.

FIGURE 9. SUMMARY OF ESTIMATED GHG BENEFIT OF TRANSPORTATION STRATEGIES (MTCO2E)
                                                                       2020            2030          2050
 Advanced Mobility: Making Transport Faster, More
 Convenient and Cleaner
 Shift Land Use Patterns to Shorten Trips and Reduce
 the Need to Drive                                                      19,000         45,000        54,000
 Drive Adoption of Multimodal Transport                                  9,000         31,000        38,000
 Accelerate Adoption of Fuel Efficient and Electric
 Vehicles                                                                5,000         21,000        71,000

BENEFITS OF ACCELERATED TRANSPORTATION ENERGY SAVINGS
The benefits of accelerating Fort Collins’ transportation energy savings extend beyond costs savings.
With enhanced urban planning and smart growth, people can get places faster and more conveniently.
The strength of Fort Collins’ biking network will continue to be a boon not only to its bikers, but to
residential property values in the city.15 Increased retail spending per month has been shown to increase
when customers travel by bike ($75.66) rather than by car ($61.03)28. The demand for transit has been
growing in Fort Collins as evidenced by 70% growth between 2000 and 2014, and 14% growth between
2013 and 2014. Less driving means less congestion, and consequently, improved local air quality.
Cumulative vehicle miles traveled (VMT) savings of over 158 million from several transportation
strategies in this plan translates into a total health cost savings of over $17 million from reduced air
pollution for Fort Collins’ citizens in the 16-year period between 2014 and 203016. Continuing the work
the City has already started will also continue to build on one of the community’s greatest strengths—
being a bike-able, walkable city. There’s even a potential benefit for the electricity sector from greater
adoption of electric vehicles.

14Litman,   Todd, Aug 31, 2014. Evaluating Public Transit Benefits and Costs, Best Practices Guidebook.

15People  for Bikes and the Alliance for Biking and Walking, Protected Bike Lanes Mean Business, pp10,
https://www.sfbike.org/wp-content/uploads/2014/04/Protected_Bike_Lanes_Mean_Business.pdf
16 Transportation Cost and Benefit Analysis II – Air Pollution Costs, Mar 16, 2011, Victoria Transport Policy

Institute

CLIMATE ACTION PLAN FRAMEWORK – March 2015                                                                           23
You can also read