Yukon state of the environment interim report 2019 - A report on environmental indicators
←
→
Page content transcription
If your browser does not render page correctly, please read the page content below
Yukon state of the environment
interim report 2019
A report on environmental indicators
Keno.

Acknowledgements
Reviewers and contributors                                   All photos © Government of Yukon, unless otherwise
                                                             noted.
Government of Yukon:
                                                             Published April 2019
Department of Energy, Mines and Resources: Jim Bell
(Land Planning), Michelle Sicotte (Forest Management)        ISBN: 978-1-55362-833-0

Department of Environment: Tyler Williams, Kirsten
Burrows, Janine Kostelnik, Jennifer Smith, Kelsey Russell,   On the cover: The Hart River in winter
Piia Kukka, Meghan Larivee. Oliver Barker, Bruce
Bennett, Jessica Elliot, Amy Law
Executive Council Office: Gary Brown
Others:
City of Whitehorse: Bryna Cable
Environment and Climate Change Canada: Ellen
Sedlack, Margaret Campbell
Yukon Land Use Planning Council: Nick Gryzbowski
Gamberg Consulting: Mary Gamberg
Fisheries and Oceans Canada: Nathan Millar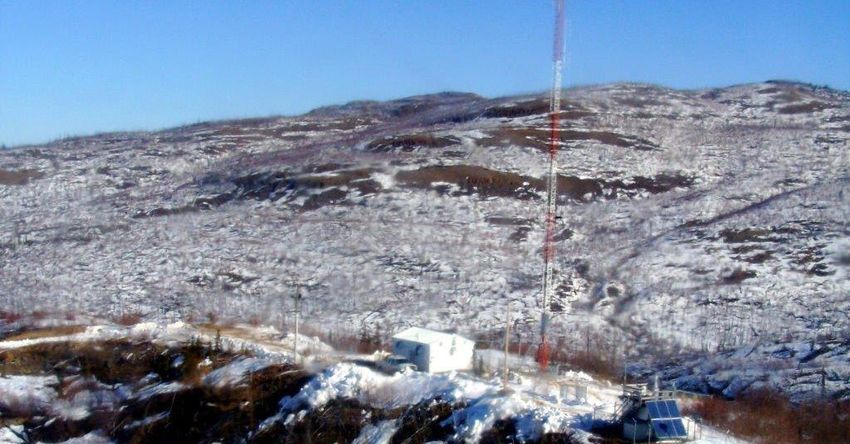
Table of contents

Highlights...........................................................................2     Land
Introduction........................................................................ 5     Population of Yukon...................................................... 29

Climate Change                                                                             Community and local area planning........................ 33

Trends in Yukon greenhouse                                                                 Status of parks and protected areas....................... 35
gas levels............................................................................ 6
                                                                                           Number, type and location of environmental and
Arctic sea ice extent and volume.................................9                         socio-economic assessments.................................... 38

Long-term precipitation variation............................. 10                          Recreational land use................................................... 39

                                                                                           Waste handled at the Whitehorse Waste
Long-term temperature variation............................. 12                            Management Facility.................................................... 40

                                                                                           Forest health................................................................... 42
Air
                                                                                           Wetlands.......................................................................... 50
Levels of particulate matter....................................... 15

                                                                                           Presence of alien and introduced species............. 52
Organic pollutants in air.............................................. 18

Water                                                                                      Fish and wildlife
                                                                                           Species management plans....................................... 55
Snow accumulation...................................................... 23
                                                                                           Community-based fish and wildlife work plans.. 57
Extreme high and low water in lakes and rivers.. 25
                                                                                           Caribou population and distribution........................ 60
Yukon River ice break-up at Dawson City............. 28
                                                                                           Caribou mercury levels................................................ 62

                                                                                           Density of snowshoe hares........................................ 64

                                                                                           Winter tick surveillance............................................... 66

                                                                                           Sustainability of lake trout fisheries......................... 67

                                                                                           Number of spawning Chinook salmon................... 69

                                                                                           Trumpeter swan population monitoring................. 71

                                                                                           Monitoring breeding waterfowl................................ 73

                                                                                           Monitoring wild sheep and goat health.................. 75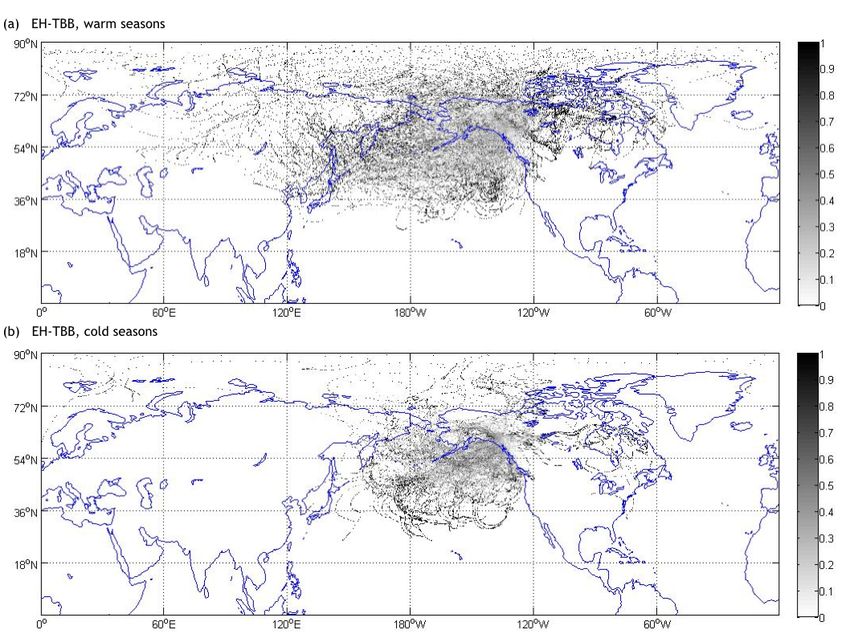
Highlights

Climate Change                                             Yukon River ice break-up at Dawson City
                                                           Ice break-up on the Yukon River at Dawson City now
Trends in greenhouse gas levels                            occurs more than seven days earlier on average than in
2016 emissions were up 2.6 per cent since 2009.            1896. Eight of the 10 earliest recorded break-up events
However, from a peak in 2011, emissions were lower in      at Dawson City have occurred in the past 30 years.
2016 by 13 per cent. Transportation accounted for 62
per cent of Yukon’s greenhouse gas (GHG) emissions in      Land
2016. Yukon’s total GHG emissions were 0.08 per cent
of the national total in 2016.
                                                           Population of Yukon
Arctic sea ice extent and volume                           In 2016, there were 0.1 people per square kilometer in
Approximately 300 km3 of sea ice is lost every year.       Yukon. From June 2017 to June 2018, the total Yukon
Remaining sea ice is becoming younger and thinner.         population increased by 816 people, or 2.1 per cent.

Long-term temperature variation                            Community and local area planning
Over the past 50 years, winters have warmed by an          All eight Yukon municipalities have official community
average of 4ºC. Yukon’s annual average temperature has     plans. In 2018, eight local area plans were in place.
increased by 2ºC, twice the global rate.                   Local area planning processes are currently underway
                                                           for Marsh Lake, Fox Lake, Tagish, Alaska Highway West,
                                                           and Fish Lake.
Air
                                                           Recreational land use
Levels of particulate matter                               Between 2015 and 2016, 82 new Government of
In 2016, Whitehorse had the lowest concentrations of       Yukon campsites were added across the territory.
fine particulate matter in urban areas across Canada.      These include additional campsites at the Marsh Lake,
                                                           Wolf Creek, Twin Lakes and Tombstone Mountain
Organic pollutants in air                                  campgrounds, and Conrad Campground on Tagish Lake.
Air concentrations of two pesticides,                      This has resulted in a 20 per cent increase in the number
hexachlorocyclohexane and endosulfan, are decreasing       of campsites within 200 km of Whitehorse.
at Little Fox Lake.
                                                           Waste handled at the Whitehorse Waste
Ten new flame retardants that are not regulated in         Management Facility
Canada were detected in air at Little Fox Lake. Air
samples from 2015 to 2018 are currently undergoing         In 2017, Whitehorse residents sent an average of
chemical analysis.                                         710 kg of waste to the landfill. This is an increase
                                                           from 610 kg in 2016. The increase mainly came from
                                                           construction and demolition waste like the demolition
Water                                                      of FH Collins. Twenty-seven per cent of waste was
                                                           diverted from the Whitehorse landfill through recycling
Snow accumulation                                          and composting in 2017.
The amount of water in snowpacks has increased an
average of three per cent per decade at 14 long-term
snow survey stations. 2016 and 2017 experienced
below-average snow throughout Yukon.

Extreme high and low water in lakes and
rivers
Most river stations measured significant increased water
flows in the winter months, when water is usually lower.

2   Yukon state of the environment interim report 2019
Fish and wildlife
Species management plans
The Government of Yukon and the Yukon Fish and
Wildlife Management Board have developed a draft
conservation plan for grizzly bears in the territory.
The draft plan presents a 25-year vision for grizzly bears
in Yukon, and provides guidance to achieve this vision.

Density of snowshoe hares
2006 and 2017 were the last peaks in the snowshoe
hare cycle. Currently, the hare population cycle is in a
decline phase. The peak population of the snowshoe
hare cycle has been declining in the Kluane area since
1973.

Number of spawning Chinook salmon
In 2017, the spawning conservation target for Yukon
River Chinook was met for the sixth time in the last
10 years.

Monitoring wild sheep and goat health
M. ovipneumoniae (m. ovi) testing has been completed
for 244 thinhorn sheep and one mountain goat between
2015 and 2018. The m. ovi bacterium was not detected
in any of these tested animals.

                                                             A report on environmental indicators   3
Mount Decoeli.

4   Yukon state of the environment interim report 2019
Introduction

The Yukon state of the environment report reflects           Environment Act: State of Environment Report
on the status of the environment and helps guide             47. (1) The Government of Yukon shall report publicly on
future decision-making. This interim report presents                   the state of the environment pursuant to this Act.
information on climate change, air, water, land, and fish
and wildlife.                                                    (2) The purpose of this report under subsection (1)
                                                                      is:
This report includes information available at the end of
the 2018 calendar year. The base year for comparing                 a. to provide early warning and analysis of
trend data in this report is 2016, because several                      potential problems for the environment;
agencies require up to 24 months to complete data                   b. to allow the public to monitor the progress
collection, compilation, analysis and reporting to the                  toward the achievement of the objectives of
Government of Yukon.                                                    this Act; and
This report tracks environmental indicators, which                  c. to provide baseline information for
are key measurements used to monitor, describe                          environmental planning, assessment and
and interpret change. Indicators cannot provide all                     regulation.
of the information on a particular topic, but they give      48. (1) The Minister shall prepare and submit to the
indications of how aspects of the environment are                      Legislative Assembly a Yukon State of the
doing. The indicators featured in this report are based                Environment Report within three years of the
on criteria including data availability, data reliability,             date this section comes into force and thereafter
usefulness and ease of understanding. Indicators                       within three years of the date of the previous
are used to evaluate and demonstrate whether                           report.
environmental conditions are improving, remaining
stable or declining.                                         50. (1)Commencing from the date of the first Yukon
                                                                      State of the Environment Report, for every
This report represents a collective effort from scientific            period of twelve consecutive months in which
experts, government agencies, and non-governmental                    a Yukon State of the Environment Report is not
organizations that have provided information, data and                made, the Minister shall prepare an interim report
advice.                                                               and submit it to the Legislative Assembly.
                                                                 (2) An interim report under subsection (1) shall
                                                                      comment on matters contained in the previous
                                                                      Yukon State of the Environment Report.

                                                                               A report on environmental indicators     5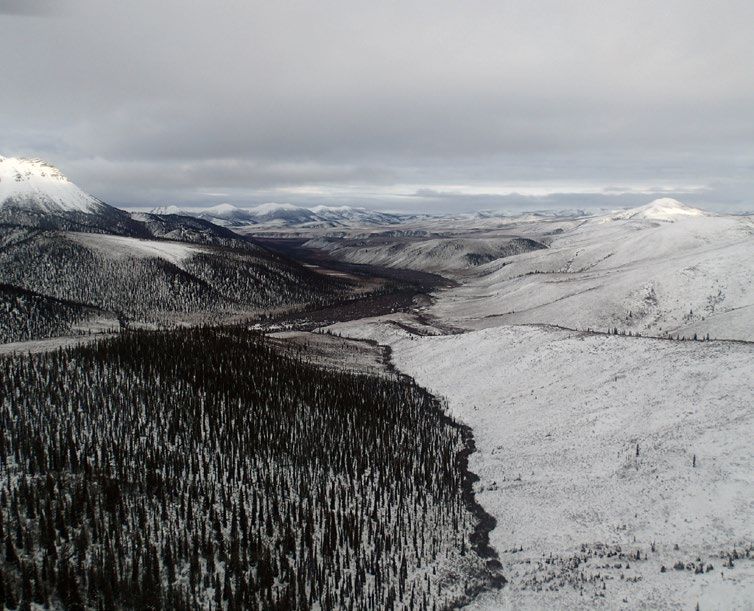
Climate Change

                                                                              Yukon River Valley, Whitehorse. Photo: R. Cherepak.

Trends in Yukon greenhouse                                     Yukon into consideration, including long distances from
                                                               production centres, high demand for heat during cold
gas levels                                                     winters and an isolated electricity grid.

Significance                                                   What is happening?
Greenhouse gases (GHGs) trap heat in the atmosphere,
                                                               Yukon’s emissions
keeping the Earth’s surface warmer than it would be in
their absence. This process is essential for sustaining life   The Government of Yukon is working with local and
on the planet, but burning fossil fuels has increased the      federal partners to achieve an accurate and consistent
amount of GHGs in the atmosphere, which enhances               emissions profile for Yukon. This profile is necessary to
the warming effect. Global GHG levels are now at their         support the effective policy development for minimizing
highest in the last 800,000 years (IPCC 2014) because          growth in Yukon’s overall GHG emissions. To date, two
of human activity, resulting in climate change.                data sets are available to support an understanding of
                                                               Yukon’s overall GHG emissions:
GHG emissions include carbon dioxide, methane,
and nitrous oxide among others. Carbon dioxide is                ¡¡ Emissions estimates by Environment and Climate
the principal contributor to human-caused increased                 Change Canada for Yukon found in the National
atmospheric levels of GHGs; therefore, it is used as a              Inventory Report 1990-2016: Greenhouse Gas
basis to compare all greenhouse gases.                              Sources and Sinks in Canada. See: canada.ca/en/
Carbon dioxide equivalent (CO₂e) is the measure                     environment-climate-change/services/climate-
most often used to compare emissions from various                   change/greenhouse-gas-emissions/inventory.html.
GHGs based on their potential to contribute to global
                                                                 ¡¡ The Yukon GHG Inventory 2009-2016, developed
warming. Tracking GHG emissions (in units of kilotonnes
                                                                    in partnership between the Yukon Bureau of
of CO₂e) allows tracking of Yukon’s emissions across
                                                                    Statistics and the Department of Environment,
time, identifying the major sources of emissions and
                                                                    with support from the Department of Energy,
opportunities for reductions, as well as tracking Yukon’s
                                                                    Mines and Resources. This data is based on
contributions to national and global emission levels.
                                                                    reliable fuel tax data collected under the Fuel
The observed and predicted rate and magnitude of                    Oil Tax Act and held by the Government of
temperature change in Yukon are among the largest in                Yukon’s Department of Finance. See: Yukon.ca/
Canada. The Government of Yukon is taking action to                 greenhouse-gas-emissions-yukon.
limit GHG emissions produced from its operations and
those from key sectors. The Government of Yukon is also
working on climate change adaptation in the short and
long term. These measures take the unique challenges in

6   Yukon State of the Environment Interim Report 2019
Climate Change

                                                      800
     Kilotonnes carbon dioxide equivalent (ktCO 2e)

                                                      700

                                                      600

                                                      500

                                                      400

                                                      300

                                                      200

                                                      100

                                                        0
                                                                  2009           2010           2011            2012           2013            2014           2015           2016

                                                                                       Re-calculated emissions                 NIR data (2018)

                                                            Figure 1: Yukon greenhouse gas emissions reported by Environment and Climate Change Canada and by the Yukon Bureau of Statistics.

The Government of Yukon is continuing its work with                                                                        ¡¡ After transportation, space heating from fuel oil
the federal departments of Environment and Climate                                                                            and propane is the next highest source of GHG
Change Canada as well as Statistics Canada to improve                                                                         emissions in Yukon at 18 per cent. Electricity
accuracy in federal data collection and reporting.                                                                            generation accounts for three per cent of Yukon’s
Until federal data better reflects Yukon’s overall GHG                                                                        emissions.
emissions, the Government of Yukon considers fuel
tax data from the Yukon Bureau of Statistics and                                                                        National comparison
Department of Finance as the most accurate.                                                                                ¡¡ Canada is ranked among the highest of all
Summary points from the Yukon GHG Inventory 2009-                                                                             countries in the world in terms of per capita GHG
2016 data include:                                                                                                            emissions. Canadians produced 704 megatonnes
                                                                                                                              (704,000 kilotonnes) of CO₂e in 2016, about 17
 ¡                                   Emissions were up by 2.6 per cent since 2009.                                            per cent above 1990 levels (Environment and
                                     However, from a peak of 680 kilotonnes of CO₂e                                           Climate Change Canada 2018).
                                     in 2011, emissions were lower in 2016 by 13 per
                                     cent.                                                                                 ¡¡ Per capita emissions in Yukon in 2016 were 16.4
                                                                                                                              tonnes per person. Compared to the per capita
 ¡¡ Yukon’s total GHG emissions for 2016 were 590                                                                             emissions of the 12 other provinces and territories
    kilotonnes of CO₂e.                                                                                                       as reported in the National Inventory Report (NIR),
 ¡¡ Transportation accounts for the largest share of                                                                          Yukon’s per capita emissions rank eight out of 13.
    greenhouse gas emissions in Yukon: 62 per cent of                                                                      ¡¡ Yukon’s total GHG emissions contributed 0.08 per
    the total in 2016.                                                                                                        cent towards the national total in 2016.
                                                  • This means that passenger vehicles are a
                                                    significant source of emissions in the territory.

                                                                                                                                              A report on environmental indicators         7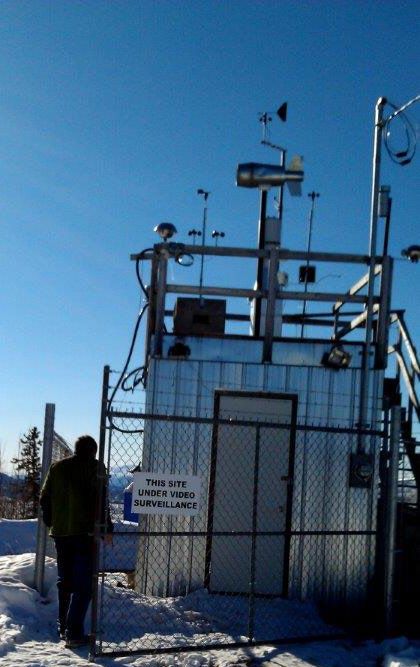
Climate Change
                                                               The Government of Yukon is developing a new strategy
                                                               that combines climate change, energy and green
                                                               economy to enhance Yukon’s capacity to thrive in a
                                                               rapidly changing climate. It is anticipated for release in
                                                               late 2019.
                                                               Climate change, energy and economy are
                                                               interconnected. By addressing all three together, Yukon
                                                               can plan for its future more effectively. We are working
                                                               in close collaboration with Yukon and transboundary
                                                               First Nations, the Inuvialuit, and Yukon municipalities to
                                                               ensure the new strategy reflects the needs and priorities
                                                               of all Yukoners.

                                                               Data quality
                                                               Previously, the GHG emissions indicator was based on
                                                               data provided by the federal department of Environment
                                                               and Climate Change Canada via the National Inventory
                                                               Report (NIR), which presents GHG information annually
                                                               for Yukon in kilotonnes of CO₂e by sector (Energy,
                                                               Industrial Processes and Product Use, Agriculture and
                                                               Waste). All national inventory reports are accessible
                                                               online at: canada.ca/en/environment-climate-change/
                                                               services/climate-change/greenhouse-gas-emissions/
                                                               inventory.html.
                                                               The Government of Yukon considers the Yukon GHG
                                                               Inventory 2009-2016, based on tax and finance data
                                                               provided by Yukon Bureau of Statistics and Department
                                     Klondike Highway South.   of Finance, as the most accurate data for Yukon-wide
                                                               emissions. The Government of Yukon will continue to
Taking action                                                  work with the federal departments of Environment and
The Government of Yukon partnered with the Northern            Climate Change Canada as well as Statistics Canada to
Climate ExChange at Yukon College on developing a              improve data accuracy, and in the meantime, will access
Yukon Climate Change Indicators and Key Findings               and report Yukon data from local sources to inform our
report. This cross-sector, structured, evidence-based          understanding of Yukon GHG emissions.
assessment of Yukon climate change knowledge
                                                               References
synthesizes our current understanding, providing
researchers, decision-makers and the general public            Environment and Climate Change Canada. 2018
with an objective overview of the climate system and           National Inventory Report 1990-2016: Greenhouse Gas
any potential changes.                                         Sources and Sinks in Canada. Pt. 3, p.40. Environment
                                                               Canada, Gatineau, Quebec, Canada.
The Government of Yukon released its first climate
change action plan in 2009. We have balanced                   Government of Yukon. 2018. Greenhouse gas emissions
monitoring and progress reporting of existing                  in Yukon. Available from: Yukon.ca/en/greenhouse-gas-
commitments, with development of new actions to                emissions-yukon.
ensure work is relevant and up-to-date. Progress               Intergovernmental Panel on Climate Change (IPCC).
reports in 2012 and 2015 included new climate                  2014. Climate Change 2014 Synthesis Report. IPCC,
change action commitments, and a 2018 update gave              Geneva, Switzerland. Available from: ar5-syr.ipcc.ch.
a snapshot of progress on previous commitments and
summarized work underway.

8   Yukon State of the Environment Interim Report 2019
Climate Change
Arctic sea ice extent and volume
Significance
Sea ice melt is one of the most visually striking global
indicators of climate change, and is especially relevant
for the circumpolar North. As ice melts over the Arctic
Ocean, there is a significant shift in the energy balance
between ocean, ice, and the atmosphere. A dark-
coloured ocean surface absorbs more energy and
allows it to be redistributed throughout Arctic systems,
whereas light-coloured ice reflects energy back into
space.
Arctic sea ice is melting as indicated by changes in the Beaufort Sea, ice along Herschel Island shoreline.
extent and volume of ice across Arctic and northern
oceans. Less and less ice is remaining from one year to
the next, and the ice that lasts more than one season is
thinning significantly.
10
The net result, if this trend continues, is that summer sea
8
ice will be nearly nonexistent across the Arctic by the
Sea ice extent (millions square kilometers)
end of the century. This has wide-ranging implications
for the Arctic and the globe, including increased coastal 6
erosion, changes to atmospheric circulation in distant
locations, damage to human infrastructure and negative 4
impacts on species that depend on sea ice.
2
What is happening? 0
1975 1980 1985 1990 1995 2000 2005 2010 2015 2020
¡¡ Arctic sea ice is melting, reducing both the
Year
minimum annual sea ice area and its overall Figure 1: Arctic September sea ice extent.
Source: National Snow and Ice Data Centre.
volume.
¡¡ Sea ice melt appears to be accelerating, with most
20
of the melt occurring in the past decade.
¡¡ Figure 1 shows the annual extent (area) in
Sea ice volume (thousands cubic kilometers)
15
September (in millions of square kilometres)
of Arctic sea ice with at least 15 per cent ice
concentration. 10
¡¡ Figure 2 shows the annual Arctic September sea
ice volume (in thousands of cubic kilometres).
5
¡¡ September sea ice loss averages 90,000 km2 per
year, although there is significant variability from
one year to the next and more recent losses have 0
exceeded earlier losses. 1975 1980 1985 1990 1995
Year
2000 2005 2010 2015 2020
¡¡ Approximately 300 km3 of sea ice volume is lost Figure 2: Arctic September sea ice volume.
Source: Polar Science Centre.
per year. Remaining sea ice is becoming younger
and thinner.
A report on environmental indicators 9Climate Change
References
National Snow and Ice Data Center. 2015. Sea Ice Index,
Version 1. University of Colorado, Boulder, Colorado,
USA. Available from: nsidc.org/data/g02135.html.
Osborne E., J. Richter-Menge and M. Jeffries, eds. 2018.
Arctic Report Card 2018. Available from: arctic.noaa.
gov/report-card/report-card.
Polar Science Center, Applied Physics Laboratory. 1979-
2019. PIOMAS Daily Ice Volume Data, 1979-present
[cited 2019 Jan 4]. University of Washington, Seattle,
Washington, USA. Available from: psc.apl.uw.edu/
research/projects/arctic-sea-ice-volume-anomaly/data.
Streicker J. 2016. Yukon Climate Change Indicators
and Key Findings 2015. Northern Climate ExChange,
Yukon Research Centre, Yukon College, Whitehorse,
Yukon, Canada. Available from: yukoncollege.yk.ca/sites/
default/files/inline-files/Indicator_Report_Final_web.
pdf.
Beaufort Sea, ice along Herschel Island shoreline
Taking action
Long-term precipitation variation
The Government of Yukon partnered with the Northern Significance
Climate ExChange at Yukon College on developing a
Temperature and precipitation are the two most
Yukon Climate Change Indicators and Key Findings
commonly used variables to demonstrate changes in
report. This cross-sector, structured, evidence-based
climate.
assessment of Yukon climate change knowledge
synthesizes our current understanding, providing Monitoring the difference in annual precipitation
researchers, decision makers and the general public with from the average of the past 30 years helps us to
an objective overview of the climate system and any understand the rate and extent of changes occurring
potential changes. Sea ice extent and volume are two in Yukon. Beyond the historic and projected trends for
indicators presented in this report. increasing precipitation, the variability of our climate is
also expected to increase. This will mean an increase
Reducing GHG emissions in Yukon will help to reduce
in extreme weather events (like storms) and greater
the long-term negative impacts of the trends presented
fluctuations in precipitation (rain and snow).
in this indicator.
Changes have started and are expected to continue to
Data quality impact the distribution and abundance of vegetation,
fish and wildlife in Yukon. Climate change is also
¡¡ The National Snow and Ice Data Centre gather
expected to affect Yukon infrastructure, economy and
satellite data to make calculations for sea ice
communities, with water levels and extreme events
extent. You can find this data at: nsidc.org/data/
playing a large part in this.
g02135.
¡¡ For sea ice volume, the University of Washington
Pan-Arctic Ice-Ocean Modeling and Assimilation
System (PIOMAS) makes data available at: psc.
apl.uw.edu/research/projects/arctic-sea-ice-
volume-anomaly/data.
10 Yukon State of the Environment Interim Report 2019Climate Change
What is happening? ¡¡ The three different lines in Figure 2 represent
three potential precipitation futures based
Annual precipitation on emissions scenarios developed by the
Intergovernmental Panel on Climate Change.
¡¡ Precipitation variability is measured by the
departure from a baseline – the 30-year average ¡¡ All scenarios show an increase in precipitation and
from 1961 to 1990. Precipitation departures are its variability.
given as a percentage change from this average
(Figure 1).
¡¡ Precipitation has increased by about six per cent
over the past 50 years.
¡¡ The largest increase in precipitation occurred in
summers.
¡¡ There is variability in terms of where precipitation
occurs in the territory, and what time of year it
occurs.
1000.0
900.0
800.0
Precipitation (mm)
Fog at Samuel Glacier. Photo: Cathie Archbould.
700.0
600.0
1000.0
500.0 900.0
400.0 800.0
Precipitation (mm)
1990 2000 2010 2020 2030 2040 2050 2060 2070 2080 2090 2100 2110
Year
700.0
Figure 1: Yukon annual precipitation variability, 1950-2016.
Source: Environment and Climate Change Canada, Climate Research
Branch (2016) Climate Trends and Variations Bulletins. 600.0
500.0
Projected precipitation
400.0
¡¡ Global studies, including the 2014 1990 2000 2010 2020 2030 2040 2050 2060 2070 2080 2090 2100 2110
Intergovernmental Panel on Climate Change Fifth Year
Assessment Report, show that climate scenarios Figure 2: Yukon projected annual precipitation anomalies (A2, A1B, B1)*.
project a significant increase in precipitation over Source: Environment and Climate Change Canada, Climate Research
the next 50 years (Figure 2). Branch (2016) Climate Trends and Variations Bulletins.
* A2, A1B and B1 are different future emission scenarios that have been
developed by the Intergovernmental Panel on Climate Change. Further detail on
those scenarios can be found at: ipcc.ch/site/assets/uploads/2018/02/ar4-wg1-
chapter8-supp-material-1.pdf.
A report on environmental indicators 11Climate Change
Taking action References
The Government of Yukon partnered with the Northern Environment and Climate Change Canada, Climate
Climate ExChange at Yukon College on developing a Research Branch. 2014-2015. Climate Trends and
Yukon Climate Change Indicators and Key Findings Variations Bulletins [modified 2018 Dec 10; cited 2016
report. This cross-sector, structured, evidence-based Jan 9]. Available from canada.ca/en/environment-
assessment of Yukon climate change knowledge climate-change/services/climate-change/science-
synthesizes our current understanding, providing research-data/climate-trends-variability/trends-
researchers, decision-makers and the general public variations.html.
with an objective overview of the climate system Intergovernmental Panel on Climate Change (IPCC).
and any potential changes. Precipitation change and 2014. Climate Change 2014 Synthesis Report. IPCC,
projections are two indicators presented in this report. Geneva, Switzerland. Available from: ar5-syr.ipcc.ch.
Reducing GHG emissions will help to reduce the long- Scenarios Network for Alaska Planning (SNAP). 2011.
term negative impacts of the precipitation trends Climate Projections for Yukon. Unpublished Data
presented. produced for the Northern Climate ExChange, Yukon
Data quality College, Whitehorse, Yukon.
Streicker J. 2016. Yukon Climate Change Indicators
¡¡ The data are exclusively from Environment and and Key Findings 2015. Northern Climate ExChange,
Climate Change Canada’s Climate Trends and Yukon Research Centre, Yukon College, Whitehorse,
Variations Bulletins. Yukon, Canada. Available from: yukoncollege.yk.ca/sites/
¡¡ Northern BC is included in Environment and default/files/inline-files/Indicator_Report_Final_web.
Climate Change Canada’s regional separation of pdf.
the data, meaning the results could be skewed
towards southern Yukon. Long-term temperature variation
¡¡ There is uncertainty in the identified trends for Significance
precipitation because data are collected over a
large area with uneven coverage (particularly for Temperature and precipitation are the two most
winter precipitation), and because of differences in commonly used variables to demonstrate changes in
instrument methodology over time. climate.
Global studies, including the 2014 Intergovernmental
¡¡ Data is currently only available to 2016 because Panel on Climate Change Fifth Assessment Report,
of changes to precipitation monitoring within show that the Arctic is warming more quickly than other
Environment and Climate Change Canada. The regions.
update and reporting of historical adjusted
precipitation trends and variations is currently on Climatic changes have started to impact the distribution
hiatus pending extensive data reconciliation. and abundance of vegetation, fish and wildlife in Yukon.
Climate change is also affecting Yukon infrastructure,
¡¡ However, these data findings are supported by economy and communities.
local Yukon and Northern-specific research and
data that can found in the Yukon Climate Change What is happening?
Indicators and Key Findings report. Annual temperature
¡¡ The Intergovernmental Panel on Climate Change Monitoring the temperature departures from the average
(IPCC) is the leading international body for the over the past 30 years helps us to understand the rate
assessment of global climate change. The IPCC and extent of changes occurring in Yukon.
Fifth Assessment Report is a reputable synthesis
of current climate change knowledge captured ¡¡ Temperature variability is measured by the
from 9,200 peer-reviewed scientific publications. departure from a baseline – the 30-year average
from 1961–1990. Temperature departures are
given as a change in ºC from this average (Figure 1).
12 Yukon State of the Environment Interim Report 2019Climate Change
¡¡ The three different lines in Figure 2 represent
3.0
2.5 three potential temperature futures based
2.0
on emissions scenarios developed by the
Intergovernmental Panel on Climate Change.
1.5
Temperature anomaly (°C)
1.0
¡¡ All scenarios show an increase in temperature and
its variability.
0.5
0.0
-0.5
-1.0
-1.5
-2.0
1945 1950 1955 1960 1965 1970 1975 1980 1985 1990 1995 2000 2005 2010 2015 2020
Year
Figure 1: Yukon annual temperature variation, 1950-2016.
Source: Environment and Climate Change Canada, Climate Research
Branch (2017) Climate Trends and Variations Bulletins.
Over the past 50 years:
¡¡ Yukon annual average temperature has increased
by 2ºC, twice the global rate.
¡¡ Winters are warming more than other seasons,
with an average increase of 4ºC.
Projected temperature
¡¡ Global studies, including the 2014
Intergovernmental Panel on Climate Change Fifth
Assessment Report, show that climate scenarios
project a significant increase of more than 2ºC in
temperature over the next 50 years (Figure 2).
Yukon projected precipitation (A2, A1B, B1)
8.0
7.0
6.0
Temperature anomaly (°C)
5.0
4.0
3.0
2.0
1.0
Yukon River Valley, Whitehorse. Photo: R. Cherepak.
0.0
-1.0
* A2, A1B and B1 are different future emission scenarios that have been
-2.0
developed by the Intergovernmental Panel on Climate Change. Further detail on
1990 2000 2010 2020 2030 2040 2050 2060 2070 2080 2090 2100 2110
Year those scenarios can be found at: ipcc.ch/site/assets/uploads/2018/02/ar4-wg1-
chapter8-supp-material-1.pdf.
Figure 2: Yukon projected annual temperature anomalies (A2, A1B, B1)*.
Source: Environment and Climate Change Canada, Climate Research
Branch (2016) Climate Trends and Variations Bulletins.
A report on environmental indicators 13Climate Change
Taking action ¡¡ The Intergovernmental Panel on Climate Change
(IPCC) is the leading international body for the
The Government of Yukon partnered with the Northern
assessment of global climate change. The IPCC
Climate ExChange at Yukon College on developing a
Fifth Assessment Report is a reputable synthesis
Yukon Climate Change Indicators and Key Findings
of current climate change knowledge captured
report. This cross-sector, structured, evidence-based
from 9,200 peer-reviewed scientific publications.
assessment of climate change knowledge about
Yukon synthesizes our current understanding from References
numerous sources both local and national, providing
Environment and Climate Change Canada, Climate
researchers, decision-makers and the general public
Research Branch. 2017. Climate Trends and Variations
with an objective overview of the climate system and
Bulletins [modified 2017 Aug 9; cited 2018 Sep 4].
the changes we are seeing. Temperature change and
Available from: canada.ca/en/environment-climate-
precipitation are two indicators presented in this report.
change/services/climate-change/science-research-data/
Reducing GHG emissions will help to reduce the climate-trends-variability/trends-variations.html.
long-term negative impacts of the temperature trends
Intergovernmental Panel on Climate Change (IPCC).
presented here.
2014. Climate Change 2014 Synthesis Report. IPCC,
Data quality Geneva, Switzerland. Available from: ar5-syr.ipcc.ch.
Scenarios Network for Alaska Planning (SNAP), 2011.
¡¡ The data found in Figure 1 and 2 are exclusively
Climate Projections for Yukon. Unpublished Data
from Environment and Climate Change Canada’s
produced for the Northern Climate ExChange, Yukon
Climate Trends and Variations Bulletins.
College, Whitehorse, YT.
¡¡ The data spans from 1948 to present and are Streicker J. 2016. Yukon Climate Change Indicators and
complete. Northern BC is included in Environment Key Findings 2015. Northern Climate ExChange, Yukon
and Climate Change data. Research Centre, Yukon College, Whitehorse, Yukon,
Canada. Available from: yukoncollege.yk.ca/sites/default/
¡¡ Canada regionally separates the data, meaning
files/inline-files/Indicator_Report_Final_web.pdf.
results could be skewed towards southern Yukon.
¡¡ However, these data findings are supported by
local Yukon and Northern-specific research and
data that can found in the Yukon Climate Change
Indicators and Key Findings report.
14 Yukon State of the Environment Interim Report 2019Air
Whitehorse winter day.
Levels of particulate matter Health effects
The size of particles is directly linked to their potential
Significance for causing health problems. Smaller particles pose large
Yukoners have come to expect a healthy natural health problems, as these particles can more readily get
environment. It is the responsibility of the Government deep into the lungs and potentially into the bloodstream
of Yukon to protect public health and the environment, (Haikerwal et al. 2015). Fine particulate matter also
as identified in Yukon’s Environment Act and Public stays airborne for longer periods than coarse particulate
Health and Safety Act. matter (as coarse PM settles to the ground faster), and
are therefore associated with longer exposure periods.
Levels of particulate matter in our air are a significant
indicator with respect to human health, as these fine Residential wood burning for heating is estimated to
microscopic airborne particles can enter the bloodstream be the largest source of harmful fine particulates in the
through the lungs, and may contribute to short- or long- Whitehorse area during cold winter months.
term health problems. Exposure to particulate matter has been linked to a
Particulate matter are microscopic airborne particles variety of health issues. Inhalation can irritate lungs and
that come in either solid or liquid form. Small particles of airways, make it harder to breathe, and worsen chronic
concern include: conditions such as heart disease, chronic bronchitis,
emphysema and asthma.
¡¡ fine particulate matter, such as those found
The elderly, children, and people with chronic respiratory
in wood smoke, that are smaller than 2.5
illnesses are most at risk, but even healthy people can
micrometers in diameter (PM2. ); and
5 experience temporary symptoms.
¡¡ coarse particulate matter, such as those found Exposure to particulate matter has been scientifically
near roadways and industrial activities (e.g., proven to be detrimental to both public health and the
quarries), that are larger than PM2.5, but smaller environment. Sources of fine particulate matter in Yukon
than 10 micrometers in diameter (PM10). include:
A report on environmental indicators 15Air
Natural sources Human sources Inversions act like a cap on the atmosphere, preventing
the dispersion of pollutants away from valley bottoms.
Forest fires: Although the Emissions from fossil In Yukon, the two most populated communities,
predominant air flow is fuel burning, such as Whitehorse and Dawson City, are located in valleys.
westerly (from Alaska), transportation, electricity
smoke from fires in BC generation, oil and gas. What is happening?
and the NWT occasionally The Canadian Environmental Sustainability Indicators
affect Yukon’s air quality. Air Quality Report, for which National Air Pollution
Wind-blown dust from Wood burning for Surveillance data is based on, shows the following
gravel roads, especially in residential / commercial highlights about the average concentrations of fine
spring. heating, land clearing, or particulate matter in Canada:
recreational burning.
¡¡ Since 2002, average PM2.5 concentrations have
Pollen. Incineration or open consistently remained below the 2020 standard
burning of waste. across all regions of Canada, except for the first
two years in southern Quebec.
Volcanic activity, Fugitive dust from
sometimes from as far vehicles, quarrying or ¡¡ An increasing trend was detected for the average
away as Asia. construction. PM2.5 concentrations in Atlantic Canada and the
Prairies and northern Ontario region. A decreasing
trend was found for southern Quebec.
Yukon Ambient Air Quality Standards have been
developed under the Environment Act to protect human ¡¡ The key results in urban areas from 2016
health and the environment. The Government of Yukon show that Whitehorse recorded the lowest
monitors levels of PM2. in Whitehorse. Continuous, concentrations of fine particulate matter from
5
24/7-monitoring of PM2.5 provides an indication of the across Canada.
state of, and trends in, local air quality. It is in addition to Annual ambient concentration in micrograms per cubic metre
providing a point of comparison of Yukon air quality to 0 1 2 3 4 5 6 7 8 9
national results. Windsor, ON 8.3
Quebec City, QC 8.2
Other environmental effects Regina, SK 8.1
Yellowknife, NT 7.8
Particulate matter may also affect the environment Hamilton, ON 7.8
through: Kitchener, ON 7.3
Montreal, QC 7.1
¡¡ High pollution levels impairing visibility, which Toronto, ON 7.0
may affect driving, aviation, and outdoor sports
St. Catharines - Niagara, ON 6.9
Saskatoon, SK 6.8
or recreational activities like fishing, hiking, or London, ON 6.8
camping. Edmonton, AB 6.4
Oshawa, ON 5.9
¡¡ Changing nutrient and/or acidity balance in soil or Fredericton, NB 5.8
water when particulate matter carried by the wind
Ottawa, ON 5.8
Winnipeg, MB 5.8
settles on the ground. Gatineau, QC 5.6
Calgary, AB 5.2
¡¡ Black carbon, a component of PM2.5, is considered St. John's, NL 5.1
a short- lived climate pollutant (SLCP). These Sherbrooke, QC 5.0
pollutants have a relatively short lifetime in the Halifax, NS 5.0
Vancouver, BC 4.5
atmosphere – a few days to a few decades – and Victoria, BC 4.3
are generally more potent than carbon dioxide in Charlottetown, PE 3.8
terms of their climate warming potential. Whitehorse, YT 3.4
Temperature inversions, when air higher in the Figure 2: Average fine particulate matter concentrations,
atmosphere is warmer than air closer to the earth, can selected Canadian urban areas, 2016.
Source: Environment and Climate Change Canada (2018) Canadian
increase the impacts of particulate matter pollution.
Environmental Sustainability Indicators: Air Quality.
16 Yukon State of the Environment Interim Report 2019Air
Taking action ¡¡ The Government of Yukon is nearing completion
participating in a national Health Canada
¡¡ The Government of Yukon is continuing to monitor study: Outdoor Air Pollution Exposure and Risk
fine particulate matter in Whitehorse and Dawson Assessment. The study examined the oxidative
City. This study is continuing to collect data potential of PM2.5 and the relationship with human
from eight monitoring stations in Whitehorse health concerns, including lung cancer and heart
and one in Dawson City. Data will be used to attacks. Sampling at the downtown Whitehorse
determine the levels and spatial variability of PM2.5 NAPS station began in the spring of 2016 and
pollution in the various neighbourhoods, and ended in December 2018. Results and a report
subsequently enable partners to make decisions will be prepared by Health Canada in 2019.
on actions that need to be taken in high-pollutant
neighbourhoods. The results are anticipated to be
available at the termination of the study in 2020.
¡¡ Monitoring Yukon’s air quality occurs as part of
the National Air Pollution Surveillance (NAPS)
program, which monitors the quality of ambient air
in urban areas and provides long-term air quality
data of uniform standard across the country. A
Memorandum of Understanding establishes the
collaborative effort of the program between the
federal, provincial, territorial and some municipal
governments. Jurisdictions use the air quality
data compiled by NAPS to assess and report on
the state of the air and to develop programs to
address priority air quality issues in air zones. Data
provided by NAPS also support public information
tools, such as the Air Quality Health Index and the
Canadian Environmental Sustainability Indicators.
NAPS data can be accessed from the Canada-
wide air quality database, available at: maps-
cartes.ec.gc.ca/rnspa-naps/data.aspx.
¡¡ In the spring of 2016, the Air Quality Health
Index (AQHI) was launched for Whitehorse.
The AQHI is a public information tool that helps
Canadians protect their health on a daily basis
from the adverse effects of air pollution. The
AQHI is calculated based on the relative risks of a
combination of common air pollutants, including
ozone, particulate matter and nitrogen dioxide;
the data is collected from the Whitehorse NAPS
station.
¡¡ Data provided by NAPS also support public
information tools, such as the Air Quality
Health Index and the Canadian Environmental
Sustainability Indicators.
NAPS station in Whitehorse.
A report on environmental indicators 17Air
Data quality Organic pollutants in air
¡¡ NAPS data are quality-controlled, assured,
Significance
and standardized by Environment and Climate
Change Canada and the Government of Yukon’s Organic pollutants, such as flame retardants and
Department of Environment for inclusion in the pesticides, are human-made chemicals that may
Canada-wide air quality database. contaminate ecosystems. Wind and water can carry
these chemicals away from their sources to reach
¡¡ The Whitehorse NAPS station, located in places like the Arctic, where they have never been used
downtown Whitehorse, continuously monitors before. They tend to settle in colder climates and once
particulate matter, nitrogen dioxide and ground- deposited, can enter Arctic ecosystems. Many of these
level ozone. contaminants are toxic and can accumulate in the food
chain, affecting the health of wildlife and humans.
¡¡ Air quality data collected at the NAPS station
are not representative of air quality throughout Measuring how much organic pollutants are present in
Whitehorse or Yukon because of differences Arctic air over time will provide us with information on:
in geographical layout, population density and
¡¡ whether their concentrations are decreasing,
pollution sources.
increasing or not changing over time;
¡¡ Canadian Environmental Sustainability Indicators
¡¡ where these chemicals have come from;
(CESI) measure the progress of the Federal
Sustainable Development Strategy, report to ¡¡ how much of each chemical comes from which
Canadians on the state of the environment, and region; and
describe Canada’s progress on key environmental
sustainability issues. The indicators, built on ¡¡ what climate conditions influence their movement
rigorous methodology, are added and updated as to the Arctic.
new, high quality data become available. This information can inform policies that limit
emissions and may reduce what comes into the Arctic.
References
Results about how organic pollutant concentrations
Environment and Climate Change Canada. 2018. change in air can be used to negotiate and evaluate
Canadian Environmental Sustainability Indicators: Air the effectiveness of domestic and international
quality [cited 2019 Jan 2]. Available from: canada.ca/en/ control agreements and to assess the risks of new
environment-climate-change/services/environmental- contaminants. The results are also used to test
indicators/air.html. atmospheric models that explain contaminant
Haikerwal A., M. Akram, A. Del Monaco, et al. Impact movement from sources in the South to the Arctic.
of Fine Particulate Matter (PM2.5) Exposure During
What is happening?
Wildfires on Cardiovascular Health Outcomes. Journal
of the American Heart Association: Cardiovascular ¡¡ Air samples have been continuously collected at
and Cerebrovascular Disease. 2015;4(7):e001653. the Little Fox Lake Station in Yukon since August
doi:10.1161/JAHA.114.001653. 2011.
United States Environmental Protection Agency. n.d.
¡¡ The detection of these chemicals in the remote
Particulate Matter (PM) Basic Information [modified
subarctic site of Little Fox Lake demonstrates their
2016 Feb 23; 2019 Jan 2]. Available from: epa.gov/pm-
long-range transport through air and suggests
pollution.
that they could contribute to the chemical
Yukon Department of Health and Social Services. 2015. contamination of remote areas such as the Arctic.
New study to monitor Whitehorse air quality [News
release]. Available from: gov.yk.ca/news/15-344.html. ¡¡ The air concentrations of two pesticides,
hexachlorocyclohexane and endosulfan, are
decreasing at Little Fox Lake.
18 Yukon State of the Environment Interim Report 2019Air
¡¡ Measurement results show that globally regulated ¡¡ Air samples taken at Little Fox Lake in 2015 to
flame retardants (e.g., some of the polybrominated 2018 are currently undergoing chemical analysis
diphenyl ethers) have declined from 2012 to to investigate if the concentrations of new flame
2014. Canada regulated these flame retardants in retardants are changing with time.
2008 and they have been regulated globally since
2009. ¡¡ In warm seasons, organic pollutants tend to stem
from potential sources in Northern Canada, the
¡¡ Conversely, 10 new flame retardants that are not Pacific and East Asia. In cold seasons, they mainly
currently regulated were detected in air at Little came from the Pacific Rim. One example of this
Fox Lake (Figure 1). is a new flame retardant called 2-ethylhexyl
2,3,4,5-tetrabromobenzoate (Figure 2).
¡¡ Organophosphate esters flame retardants and
plasticizers were monitored and detected in
samples taken in 2015.
Figure 1: Regulated flame retardants at Little Fox Lake showed
declining tendency from 2012 to 2014. Flame retardants found in air
in Little Fox Lake that are currently not regulated (Yu et al. 2015).
Air monitoring station at Little Fox Lake. Photo: Pat Roach.
A report on environmental indicators 19Air
Figure 2: Maps showing potential source regions for one of the new flame retardants detected at Little Fox Lake, 2-ethylhexyl
2,3,4,5-tetrabromobenzoate. The maps indicate that (a) in the warm seasons most of this chemical observed at Little Fox Lake stemmed from sources
in Canada, the Pacific and East Asia; (b) in cold seasons they mainly came from the Pacific Rim. Black dots on map show potential paths of movement of
wind carrying this chemical reaching Little Fox Lake.
20 Yukon State of the Environment Interim Report 2019Air
Air monitoring station at Little Fox Lake. Photo: Pat Roach.
Taking action These data also support the Arctic Council’s Arctic
Monitoring and Assessment Programme that provides
The federal Northern Contaminants Program has
information on the status and threats to the Arctic
measured organic pollutants in air in Yukon since 1992
environment, and provide scientific advice on actions to
during three short term studies at Tagish (December
be taken to support Arctic governments in their efforts
1992 to March 1995) and Little Fox Lake (July 2002 to
to take remedial and preventive actions relating to
July 2003 and August 2007 to October 2009).
contaminants.
Continuous measurements are now conducted at Little
Fox Lake since August 2011 to determine: Data quality
¡¡ if the air concentrations are declining for chemicals ¡¡ Data are available for air samples taken once a
that are under domestic and international month using a flow-through air sampler, which
regulations, showing these regulations are does not require electrical power to operate, at the
effective; Little Fox Lake station.
¡¡ where these chemicals have come from, and how ¡¡ Air concentrations of different chemicals may vary
much from which region; and with seasons.
¡¡ if new chemicals that are currently not under ¡¡ The target chemical list includes pesticides, flame
control can enter Yukon by wind. retardants and plasticizers. New chemicals are
added to this list from time to time to assess
The Little Fox Lake data are provided to support
chemicals that may be of concern to the Arctic
the Stockholm Convention on Persistent Organic
environment.
Pollutants – a global treaty to protect human health
and the environment from the adverse effects of these
pollutants. Signatories to the convention work towards
controlling how much and what kind of persistent
organic pollutants humans release into the environment.
A report on environmental indicators 21Air
References United Nations Environmental Programme (UNEP).
2015-2016. Stockholm Convention on POPs [cited
Arctic Council. n.d. Arctic Monitoring and Assessment
2016 Mar 3]. Available from: chm.pops.int/default.aspx.
Programme (AMAP) [cited 2019 Jan 2]. Available from:
amap.no. Yu Y., H. Hung, N. Alexandrou, P. Roach, K. Nordin.
2015. Multiyear measurements of flame retardants and
Government of Canada. n.d. Northern Contaminants
organochlorine pesticides in air in Canada’s western
Program [cited 2019 Jan 2]. Available from: science.
sub-arctic. Environmental Science & Technology 49 (14):
gc.ca/eic/site/063.nsf/eng/h_7A463DBA.html.
8623 – 8630.
Hung H., Y. Yu, M. Shoeib, T. Harner, A. Steffen, D.
Muir, C. Teixeira, L. Jantunen, P. Fellin, P. Roach, F.
Wania. 2015. Northern Contaminants Air Monitoring:
Organic Pollutant Measurement. Pages 161-171 in
Aboriginal Affairs and Northern Development Canada.
Synopsis of Research Conducted under the 2014-2015
Northern Contaminants Program. Aboriginal Affairs
and Northern Development Canada, Gatineau, Quebec,
Canada. Available from: pubs.aina.ucalgary.ca/ncp/
Synopsis20142015.pdf.
Five Mile Lake.
22 Yukon State of the Environment Interim Report 2019Water
Caribou River, Peel Watershed.
Snow accumulation Overall, climate change projections generally indicate
an increase in winter precipitation over a shorter
Significance snowfall period (a trend in earlier snowmelt has been
identified and this is expected to continue), and a higher
The amount of snow on the ground across Yukon proportion of precipitation occurring as rainfall. These
is determined through measuring the snow water contradicting climate processes may induce a complex
equivalent (SWE) at survey stations. There are 52 response that may vary significantly by region and over
snow survey stations across Yukon and a number of time.
complementary instruments that measure snow on the
ground on a continuous basis. This is a measurement of
the liquid water volume held within a snowpack that can
become available when melted. The SWE throughout
and at the end of winter has an influence on a number of
hydrological and related processes:
¡¡ It is a major component of spring freshet and
therefore influences flood forecasting. Larger-
than-average SWE contribute to an increased
likelihood of higher spring flows .
¡¡ The SWE can also influence the timing and
severity of river ice break-up.
¡¡ A higher SWE (deeper snow) acts to further
insulate the ground surface from cold winter air
temperatures and can promote permafrost thaw Dog mushing in Ibex Valley. Photo: F. Mueller.
during the following summer.
¡¡ Low SWE can increase the likelihood of wildfire
risk at the beginning of summer.
¡¡ In the long term, SWE can generate shifts in
vegetation.
¡¡ Finally, the duration of the snow season
significantly affects transportation.
A report on environmental indicators 23Water
¡¡ The stations at both Log Cabin and Meadow
Creek showed significant increasing trends in
snow accumulation; these were +6 per cent and
+4 per cent per decade, respectively.
¡¡ Recently low snow years have resulted in no
significant trends within the Liard drainage.
¡¡ There were no significant trends noted at any of
the Central Yukon stations.
¡¡ Mayo Airport shows a significant increasing trend
in snow accumulation of five per cent per decade.
Taking action
The Government of Yukon’s Water Resources Branch
staff continue to collect data, as do their partners in
Yukon’s remote areas including private contractors
and staff from the Department of Energy, Mines and
Resources. Water Resources compiles and quality
controls all snow accumulation data.
Data quality
¡¡ Access archived snow survey bulletins: Yukon.ca/
snow-surveys-and-water-supply-forecasts.
Wolf Creek snow survey. ¡¡ Current snow survey data from across Alaska and
Yukon can be viewed on an interactive map made
What is happening? available through a United States Department of
Agriculture webpage at nrcs.usda.gov.
There has been a significant increase in the snow water
equivalent, measured at three of the 14 long-term snow ¡¡ There are currently 52 snow survey stations
survey stations analyzed. None of the sites measured located across Yukon, with an additional four in
showed significant decreasing trends. Including all 14 adjacent areas of Alaska and British Columbia
locations, the average increase in snow water equivalent that are used by Water Resources. Most areas
per decade is three per cent. It is important to note that of Yukon have good spatial coverage with the
there are no stations with long-term records available in exception of the far north, where stations are
the far north of the territory (basins draining directly into sparse.
the Arctic Ocean).
References
Recent years (2016 and 2017) have experienced below
average snow throughout most of the territory. This McLeod A.I. 2011. Kendall: Kendall rank correlation
has resulted in three locations that previously indicated and Mann-Kendall trend test. R package version 2.2.
significant increasing trends (Watson Lake, Frances Available from: CRAN.R-project.org/package=Kendall.
River, and King Solomon Dome) to fall slightly below Wickham H. 2009. ggplot2: Elegant Graphics for Data
what is considered statistically significant (p-values Analysis. Springer-Verlag New York, USA.Water
Snowmobiling at Fish Lake. Photo: Marten Berkman
Extreme high and low water in ¡¡ In turn, low flows in lakes and rivers can cause:
lakes and rivers ¡¡ Increased concentrations of dissolved
contaminants, such as metals, which can
Significance negatively affect aquatic ecosystems and human
A range of short and long-term processes affects water health.
levels in Yukon lakes and rivers, including:
¡¡ Low hydroelectric production and therefore higher
¡¡ the timing and magnitude of snowmelt; greenhouse gas emissions.
¡¡ the phase and intensity of precipitation; ¡¡ Negative impacts on water consumption
(agriculture, municipal, industrial) and aquatic life.
¡¡ permafrost thaw and groundwater flux variations;
Increased flows in winter, which is normally a low-
¡¡ shifts in vegetation; flow time of year, are one of many climate change
driven hydrological trend. It results from warming
¡¡ morphological adjustments; and air temperatures, a shorter cold season, degrading
permafrost, and in some locations, increased
¡¡ melting glaciers. precipitation. Such a trend is expected to continue with
The response in water levels and flows to these future warming.
processes may vary in different regions of the territory.
High flows and more intense river ice break-up
conditions in river systems can cause:
¡¡ Increased sediment and contaminant mobilization
and transport, affecting human health, drinking
water and ecosystems.
¡¡ Increased flooding potential in populated areas,
which can result in direct impact on the health and
security of people, infrastructure loss, transport
interruption, and other economic costs.
A report on environmental indicators 25You can also read