Nigeria Country Operational Plan (COP) 2021 Strategic Direction Summary - May 26, 2021
←
→
Page content transcription
If your browser does not render page correctly, please read the page content below
Nigeria
Country Operational Plan (COP) 2021
Strategic Direction Summary

May 26, 2021

                   UNCLASSIFIED
2

Table of Contents
Acronyms ............................................................................................................................................... 4
PEPFAR Indicator Description/Definition ........................................................................................... 7
1.0 Goal Statement ................................................................................................................................. 9
2.0       Epidemic, Response, and Program Context ............................................................................ 11
    2.1 Summary statistics, disease burden and country profile ........................................................... 11
    2.2 New Activities and Areas of Focus for COP21, including Continuity in Treatment ................16
    2.3 Investment Profile ...................................................................................................................... 17
    2.4 National Sustainability Profile Update ..................................................................................... 25
    2.5 Alignment of PEPFAR investments geographically to disease burden ................................... 28
    2.6 Stakeholder Engagement .......................................................................................................... 29
3.0 Geographic and Population Prioritization ................................................................................... 33
    3.1. Geographic Prioritization .......................................................................................................... 33
    3.2. Population Prioritization .......................................................................................................... 36
4.0        Client Centered Activities for Epidemic Control................................................................... 37
    4.1 Finding the missing and getting them on treatment ............................................................... 37
    4.2. Optimizing continuity in treatment and ensuring viral suppression .................................... 42
    4.3. Prevention, specifically detailing programs for priority programming: ................................. 44
    4.4. Additional country-specific priorities listed in the planning level letter ............................... 52
    4.5. Commodities and Supply Chain Systems ................................................................................ 55
    4.6. Collaboration, Integration and Monitoring – Update on the National Alignment Plan....... 56
    4.7 Advanced HIV Disease Management and CD4 assay .............................................................. 57
    4.8. Cervical Cancer Program Plans................................................................................................ 58
    4.9 Viral Load and Early Infant Diagnosis Optimization .............................................................. 59
5.0 Program Support Necessary to Achieve Sustained Epidemic Control ........................................ 62
6.0 Operations and Staffing Plan to Achieve Stated Goals................................................................ 70
APPENDIX A – How we are targeting by geography, age and sex to reach epidemic control in
COP21/FY22 ......................................................................................................................................... 74
APPENDIX B – BUDGET PROFILE AND RESOURCE PROJECTIONS ............................................ 75
APPENDIX C – Systems Investments Table for Section 6.0 .............................................................. 77
APPENDIX D– Minimum Program Requirements ............................................................................ 79
APPENDIX E – Feedback on CSO Input for COP21 .......................................................................81

                                                                UNCLASSIFIED
3

APPENDIX F – Summary of COP21 Program Targets........................................................................ 82
APPENDIX G: COP20 – COP21 Commodities Budget Table ........... Error! Bookmark not defined.
APPENDIX H: COP 21 COVID Funding: American Rescue Plan Act COVID-19.............................. 83
APPENDIX I: Digital Health Investment Inventory .......................................................................... 88

                                                    UNCLASSIFIED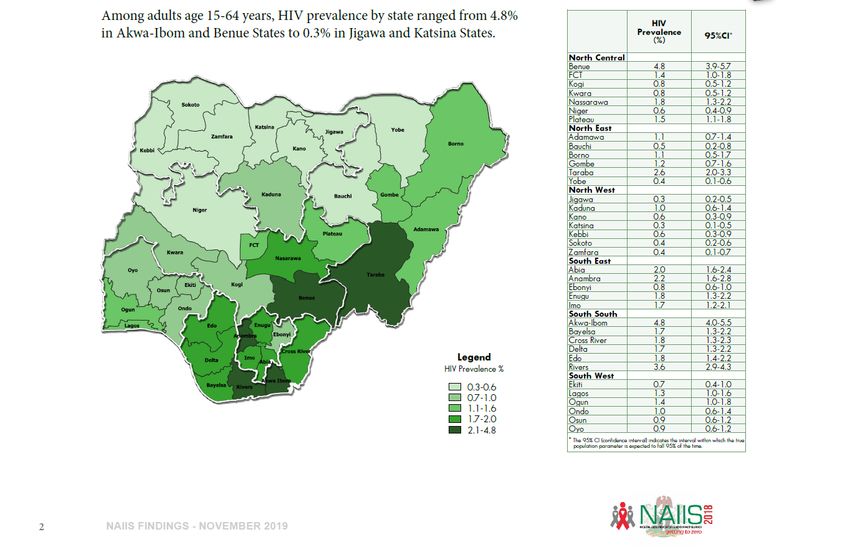
4

Acronyms
AHD      Advanced HIV Disease

ARV      Antiretroviral Drug

ASC      AIDS Spending Category

ART      Antiretroviral Therapy

CALHIV   Children Living with HIV

CBS      Case-Based Surveillance

CLM      Community-Led Monitoring

CSO      Civil Society Organization

DTG      Dolutegravir

ECHO     Extension for Community Healthcare Outcomes

EMR      Electronic Medical Records

ESM      Enhanced Site Management

FBO      Faith-Based Organization

FCT      Federal Capital Territory

GBV      Gender-Based Violence

GF       Global Fund

GON      Government of Nigeria

HEI      HIV-Exposed Infants

HIS      Health Informatics System

HIV      Human Immunodeficiency Virus

IIT      Interruption in Treatment

                                   UNCLASSIFIED
5

IP       Implementing Partner

IPV      Intimate Partner Violence

KP       Key Population

MMD      Multi-Month Dispensing

MSM      Men who have Sex with Men

NASCP    National AIDS and STI Control Program

NAIIS    Nigeria HIV/AIDS Indicator and Impact Survey

NASA     National AIDS Spending Assessment

NCAPS    Nigeria Comprehensive AIDS Program in States

NDR      National Data Repository

NGO      Non-Governmental Organization

NHLMIS   National Health Logistics Management Information System

NISRN    National Integrated Sample Referral Network

OI       Opportunistic Infection

OSS      One-Stop Shop

OU       Operational Unit

OVC      Orphans and Vulnerable Children

PrEP     Pre-Exposure Prophylaxis

PEPFAR   US President’s Emergency Plan for AIDS Relief

PLHIV    People Living with HIV

PMTCT    Prevention of Mother-to-Child Transmission

RST      Risk Stratification Tool

                                     UNCLASSIFIED
6

S/GAC    Office of the U.S. Global AIDS Coordinator

STI      Sexually Transmitted Infections

SNU      Sub-National Units

SVAC     Sexual Violence Against Children

TB       Tuberculosis

TPT      TB Preventive Therapy

TLD      Tenofovir, Lamivudine, and Dolutegravir (HIV Drug Regimen)

UNAIDS   Joint United Nations Program on HIV

VIA      Visual Inspection (of the Cervix) with Acetic Acid

                                  UNCLASSIFIED
7

PEPFAR Indicator Description/Definition
     Indicator                               Description/Definition
TX_CURR                  Number of adults and children currently receiving
                         antiretroviral therapy (ART)
TX_NEW                   Number of adults and children newly enrolled on ART
TX_PVLS (D)              Number of ART patients with a VL result documented in the
                         medical or laboratory records/LIS within the past 12 months.
PMTCT_STAT (newly        Number of pregnant women attending antenatal clinics (ANC)
tested)                  and/or had a facility-based delivery and were newly tested for
                         HIV during pregnancy to know their status
TB_STAT (newly tested)   Number of new and relapsed TB cases newly tested and have
                         documented HIV status during the reporting period
HTS_SELF                 Number of individual HIV self-test kits distributed.
OVC_SERV                 Number of beneficiaries served by PEPFAR OVC programs for
                         children and families affected by HIV
OVC_HIVSTAT              Number of orphans and vulnerable children (
8

      Indicator                              Description/Definition
TB_STAT (newly tested)   Number of new and relapsed TB cases newly tested and have
                         documented HIV status during the reporting period
                         Number of new and relapsed TB cases with documented HIV
TB_STAT POS              positive status (both new and known at entry), during the
                         reporting period
TB_ART                   Number of registered TB cases with documented HIV-positive
                         status during the reporting period. (TB_STAT_POS)
TX_TB (Denom.)           Number of ART patients who were screened for TB at least
                         once during the semiannual reporting period.
TB_PREV (Denom.)         Number of ART patients who were initiated on any course of
                         TPT during the previous reporting period
                         Among those who started a course of TPT in the previous
                         reporting period, the number that completed a full course of
                         therapy (for continuous IPT programs, this includes the
TB_PREV (Num.)
                         patients who have completed the first 6 months of isoniazid
                         preventive therapy (IPT), or any other standard course of TPT
                         such as 3 months of weekly isoniazid and rifapentine, or 3-HP).

                                    UNCLASSIFIED
1.0 Goal Statement
The Nigeria PEPFAR Country Operational Plan for 2021 (COP21) builds off the Nigeria HIV/AIDS
Indicator and Impact Survey (NAIIS) and the Antiretroviral Therapy (ART) Surge from COP19 and
COP20. These efforts allowed the PEPFAR team to focus on states with the largest treatment
coverage gap. With this backdrop, the theme for PEPFAR Nigeria’s COP21 plan is “Going Green”:
Leaving No Geography or Population Behind. The PEPFAR interagency plans to support
Government of Nigeria in “Going Green,” that is, achieving treatment saturation across most of
the states in Nigeria (2nd 95) by the end of FY22.

In COP19, PEPFAR Nigeria utilized results from the NAIIS to prioritize states for rapid ART scale-
up: the “surge” states of Akwa Ibom and Rivers, which accounted for 30% of unmet treatment
needs, the “red” states with low saturation and high unmet need (Delta, Enugu, Imo, and Lagos),
the “green” states with high saturation and low unmet need (Benue, Federal Capital Territory
[FCT], Nasarawa, and Gombe), and all remaining “yellow” states, with low saturation and low
unmet need. The surge states of Akwa Ibom and Rivers were prioritized as Scale-up to Saturation
SNUs with the aim of achieving 81% treatment coverage by the end of the Fiscal Year 2020 (FY20).

At the end of quarter one of FY21 (December 2020), PEPFAR Nigeria has made significant
progress: the surge state of Akwa Ibom; the red states of Delta and Lagos; the yellow states of
Adamawa, Cross River, FCT, Kaduna, Bauchi, Sokoto, Niger, Plateau and Kano; and the green
states of Benue, Gombe, and Nasarawa have all achieved at least 81% treatment coverage.
Furthermore, three states with over 81% treatment coverage, Benue, Gombe, and Nasarawa, were
further saturated by age and sex groups and have reached at least 90% treatment coverage.

For COP21, at the operating unit (OU) level, the PEPFAR Nigeria program will aim to increase the
percentage of people living with HIV (PLHIV) who know their status from the current rates of
92% to 95%, increase the percentage of PLHIV on treatment from current 90% to 100%, and
continue to maintain the proportion of PLHIV who are virally suppressed from current 59% to
greater than 95%. Thus, COP21 will witness an acceleration of the response and bring the country
closer to achieving the UNAIDS goal of 90-90-90 by 2023 and 95-95-95 by 2030. This effort will
also include on-the-ground technical assistance to support National Agency for the Control of
AIDS (NACA) in scaling-up HIV services in Abia and Taraba states, which had previously been
outside of PEPFAR’s geographical coverage.

The PEPFAR Nigeria program will build upon the three broad strategies laid out during the ‘surge’
in COP19 and COP20, and address key programmatic challenges as laid out in the COP21 Planning
Level Letter (PLL). Our strategic direction will include client-centered care, improved patient
retention, and the continued collaboration the Government of Nigeria (GON) and the Global
Fund to Fight AIDS, Tuberculosis and Malaria (Global Fund) on the National HIV Alignment. To
improve client care and retention, PEPFAR will continue to scale-up recently available program
innovations from enhanced site management (ESM), real-time data monitoring using electronic

                                         UNCLASSIFIED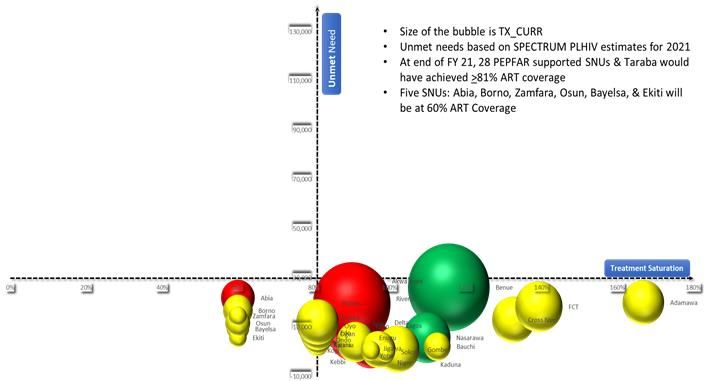
10

medical record (EMR) systems (with data warehousing in the National Data Repository [NDR] for
real-time data analysis) and facilitating knowledge sharing using virtual platforms such
as “Project ECHO.”

Using virtual platforms for alternative methods of program management became increasingly
important during COP20 implementation due to the risks associated with the COVID-19
pandemic. Because PEPFAR Nigeria had already established virtual platforms and interventions as
part of our core ESM approach, we were able to adapt immediately to the lockdown and travel
restrictions imposed during COP19 and COP20 implementation. Implementing Partners (IPs)
were able to shift testing and treatment modalities to focus more on community settings and
were able to bring HIV services directly to the patients. In doing so, PEPFAR Nigeria was not only
able to retain most of our patient cohort during COVID-19, but also increased TX_CURR by an
additional 300,000 PLHIV, all while ensuring the safety of our staff and beneficiaries.

While continuing to mitigate the effects of COVID-19 on our program, “Going Green” will require
that no geography or population is left behind. This will include the continuation of our three
broad strategies, while addressing the four highlighted four highlighted challenges OGAC noted
in the COP21 PLL. First, PEPFAR Nigeria will work to ensure treatment coverage for all by
addressing gaps in the continuity of treatment, particularly in a sub-set of states that experienced
higher levels of interruptions in treatment (IIT). Second, PEPFAR Nigeria will avoid the historic
patient losses during Q1 that have traditionally plagued the PEPFAR Nigeria ART program. Third,
we will protect pediatric populations, who have generally had lower treatment coverage and poor
treatment outcomes, by leveraging the orphan and vulnerable children (OVC) program. Fourth,
we will reach and sustain the 3rd 95 for all by addressing gaps in viral load coverage and sub-
optimal viral load suppression among certain populations, including pregnant women.

Ultimately, COP21 will also showcase the increased collaboration with stakeholders including the
Global Fund, civil society, and the Government of Nigeria to create an aligned national treatment
program. To date, the National HIV Alignment has improved program synergies and resource
efficiency by preventing duplication of efforts. Thus, significant improvements have been made in
our program outcomes, all through shared learning and harmonization of program standards.
The National Alignment has created a ‘whole of Nigeria’ approach around HIV programing and
has encouraged information and data sharing across donors, increasing collaboration and
transparency. In COP21, we hope to build off the great success of the Alignment, under which the
“National Consolidated Service Delivery Guidelines on HIV and STI for Key Populations (KP) in
Nigeria” were recently launched, to include a more aligned KP program, as well as a more
coordinated and robust laboratory network that includes GON and Global Fund laboratories.

                                          UNCLASSIFIED
11
2.0 Epidemic, Response, and Program Context
2.1 Summary statistics, disease burden and country profile
Nigeria is a lower-middle-income country (GNI: 2,100 per capita, Atlas method1) with a current
population estimate of 219,243,344 (population demographics: 49 percent female and 51 percent
male2).
The HIV epidemic in Nigeria affects populations of all age groups and geographic locations. The
2018 NAIIS estimated national HIV prevalence as 1.4% among adults aged 15 years and above, with
a higher prevalence among women 1.8% compared to males 1.0%. Also, NAIIS reported 8 new
infections per 10,000 population. In 2020, there were an estimated 1,804,612 PLHIV in Nigeria.
Regarding progress toward achieving the 95-95-95 goals, as of December 31, 2020, among all
PLHIV in Nigeria, 92% know their status, 90% are on HIV treatment, and 59% are virally
suppressed. As at December, 2020, the states with the largest ART unmet needs are now Rivers
(unmet need = 69,063) and Anambra (unmet need = 57,172).
Figure 2.1.1: HIV Prevalence in Nigeria by States source: NAIIS 2018
1 World Bank, 2017 data https://data.worldbank.org/country/Nigeria
2 2020 Spectrum data, 2019
UNCLASSIFIED12
There remains significant variation in HIV prevalence across the 36 states and the FCT, as shown
in Figure 2.1 above. Though much lower than previously reported, a few states such as Benue,
Akwa Ibom, Rivers and Taraba continue to report prevalence rates much higher than the national
average. The states of Abia, Anambra, Enugu, Delta, Bayelsa and Cross Rivers also report higher
than average prevalence.
According to the UNAIDS Spectrum 2020 estimates, the states with the highest burdens are
Rivers (burden = 193,423), Akwa Ibom (burden = 176,311), Benue (burden = 160,523), and Lagos
(burden = 125,410). Regionally, the HIV epidemic remains concentrated in the South-South,
South-East, and parts of the North-Central regions. The findings in the South-East are quite
significant, as this region was previously thought to have the lowest prevalence in the country3.
The prevalence of HIV in the country also varies by sex and across age groups. Overall, the
national HIV prevalence among females and males was 1.8% and 1.0%, respectively. The
prevalence among children 0-14 years old was 0.1%. Starting from the 15-19 years age group, a sex-
specific inflection point is observed with the prevalence amongst girls being substantially higher
than that of boys of a similar age group. The point of inflection is observed to align with the mean
age of sexual debut for young women, reflecting the significant risk of sexual and other forms of
violence facing adolescent girls and young women. This clearly calls attention to the need for
more structured and expanded interventions targeting girls and women in this age group.
Figure 2.1.2 - HIV Prevalence by Age and Sex
Among the 20–24-year-old, the difference in prevalence between men and women is noticeably
greater, with prevalence among young women being more than twice as high as among young
3 NACA (2015) ‘Nigeria GARPR 2015’[pdf]
UNCLASSIFIED13
men of similar age; this pattern continues through most of the childbearing years, with the sex
gap narrowing at the ages of 50-54 years but widening again at 55-59 years. HIV prevalence is
highest among 35–39-year-old females (3.1%) and 50–54-year-old males (2.2%).
NAIIS was used to update the UNAIDS Spectrum data for the country, which subsequently
estimated that approximately 1,804,612 PLHIV in Nigeria in 2020, and approximately 1,492,154 of
those were reportedly on treatment at the end of 2020. This suggests that about 82% of the
estimated number of PLHIV in the country are on treatment. Based on the COP21 target
projections and the Global Fund targets for the year, the country is expected to have about
1,801,359 people on treatment by the end of 2022, raising the national treatment coverage to about
99.6%.
Figure 2.1.3 National and PEPFAR Current on Treatment Numbers
The program also continues to have huge gaps in case finding among pregnant women with HIV
infection; the annual estimate for this population remains about 150,000, with only about 41,000
reported nationally to have received antiretroviral drugs (ARVs). This reflects the huge gap in the
coverage of prevention of mother-to-child transmission of HIV (PMTCT) services in the country,4
with just 10-20% of ANC sites offering PMTCT services5. It also reflects the gap in the uptake of
ANC services, with just 67% of pregnant women received ANC from a skilled provider.6 These
4 FHI360 (2014), ‘Rapid Health Facility Assessments in Eight Nigerian States’. https://www.fhi360.org/resource/rapid-
health-facility-assessments-eight-nigerian-states
5 Afe, J.A., Aknimurele, T., Oduola, A., Adeola, O. & Agboola, G. (2016), ‘Assessing PMTCT service coverage in
Southwest Nigeria: A step towards universal coverage’, GLOBAL JOURNAL OF MEDICINE AND PUBLIC HEALTH 5(1).
Available on at http://www.gjmedph.com/uploads/O4-Vo5No1.pdf
6 NDHS 2018
UNCLASSIFIED14
findings highlight the need for a more integrated approach to the delivery of reproductive health
services in the country.
Key populations (KPs) constitute about 1% of the adult population in Nigeria, but they contribute
as much as 23% of new HIV infections. Together with their partners, KPs account for 3.4% of the
adult population and 32% of new HIV infections.7 Additionally, a high prevalence of HIV was
reported in the 2020 Integrated Biological and Behavioral Surveillance Survey (IBBSS) among
several KPs: brothel-based female sex workers (17.1%), non-brothel-based FSWs (15%); people who
inject drugs (10.9%) and men who have sex with men (25%). The relatively higher prevalence
among KPs is exacerbated by unsupportive cultural beliefs and practices, societal and religious
biases, stigma and discrimination, and punitive national laws. This situation is worsened by the
Same Sex Marriage Prohibition Act of 2013, which criminalizes homosexuality and same-sex
marriage, discriminates against MSM, and creates a barrier to accessing comprehensive HIV
prevention, treatment, and care services. Other drivers of the epidemic in Nigeria include sexual
and gender-based violence (GBV) affecting the lesbian, gay, bisexual, transgender, and queer
communities.
Other barriers which may impact health-seeking behaviors among PLHIV include: the persistence
of user fees, stigma, and discrimination, as well as operational issues such as patient flow
challenges resulting in long wait times in facility settings. The rollout of differentiated models of
care has helped to mitigate these challenges to an extent, but even these efforts have been limited
by the seeming resistance of health service providers to adopt longer periods between patient
appointments, as well as drug prescribing and dispensing practices. That said, the program has
managed to expand these programs significantly in the last fiscal year. This progress is
summarized for all the differentiated care models in the Minimum Program Requirement review
table (see Appendix D).
7 NACA (2017)
UNCLASSIFIED15
Table 2.1.1 Host Country Government Results16
Table 2.1.2 95-95-95 Cascade: HIV Diagnosis, Treatment and Viral Suppression
HIV Treatment and Viral 10HIV Testing and Linkage to ART
Epidemiologic Data
Suppression Within the Last Year
11Total Estimat Diagnosed
12
HIV PLHIV ART 13Viral Tested Initiated
Population ed Total On ART HIV
Prevalence diagnosed Covera Suppress for HIV on ART
Size Estimate PLHIV Positive
ge (%) ion (%)
(#) (%) (#) (#) (#) (#) (#) (#)
Total 1,804,612 1,492,154 8,235,83
216,762,158 1.30% 1,392,670 83% 86% 341,379 347,378
population 4
Population
less than 86,366,187 0.10% 142,285 58,022 57,445 40% 70% 407,899 9,641 9,763
15 years
15–24- 1,952,45
42,228,147 0.50% 207,935 132,348 131,530 63% 85% 53,746 52,784
year-olds 4
25+ year 1,454,392 1,303,179 5,875,45
88,167,824 1.80% 1,202,300 90% 86% 277,989 284,831
old’s 3
MSM 238,552 25%
17.1% (BBFSW)
FSW 621,219
15% (NBBFSW)
PWID 227,068 10.9%
2.2 New Activities and Areas of Focus for COP21, including Continuity in Treatment
In COP21, PEPFAR Nigeria will continue to consolidate on COP20 gains in the program by
strengthening client-centered, program quality approach within the key domains of prevention,
case finding, treatment, optimized retention, and viral suppression. In addition, the innovative
approaches implemented during the COVID-19 pandemic will be further strengthened and
mainstreamed. This will help to sustain the drive to support continuity in treatment built around
a client-centric management approach, including the use of dedicated case managers across the
full clinical cascade to ensure sustain optimal VLS.
In COP21, PEPFAR Nigeria will strive to attain epidemic control in most of the SNUs. Robust
evidence generated in COP20Q1 from program data indicated a 97% retention on treatment. In
COP21, the focus will be on sustaining the continuity of treatment via client-centric, community-
based ART initiation/delivery, strengthening virtual platforms for enhanced adherence, scaling up
MMD6 especially for pediatrics, full ARV optimization including among children and adolescents
(e.g., DTG) and scaling of Pediatric ART Saturation Strategy (PASS) and alignment with OVC.
The successful implementation of the ART Surge strategy has significantly shifted the unmet need
distribution in Nigeria. For example, Akwa Ibom and Rivers states contribution to unmet need
10
PEPFAR data only
11
Data source: Estimates from Nigeria 2020 Spectrum File
12
Data source: HIV Prevalence from NAIIS 2018 and IBBSS 2020 for KP data
13
Viral suppression among patients who had a viral load in 2020
UNCLASSIFIED17
has dropped from 30% to 18%. In COP21, PEPFAR Nigeria will expand on these gains. In addition,
the lessons learned from the ART Surge will be rigorously transferred and mainstreamed to the
seven (Imo, Abia, Lagos, Borno, Osun, Oyo and Enugu) and 15 (Delta, Kano, Edo, Ogun, Kogi,
Zamfara, Bayelsa, Ondo, Kebbi, Katsina, Ekiti, Kwara, Yobe, Sokoto, and Jigawa) SNUs that now
account for 43% and 39% of the unmet need respectively. The strategies and lesson learned from
the ART surge implementation that will be scaled up to these SNUs includes ESM, community
ART service delivery, community oriented DSD, scaling and strengthen virtual platform for
patient and program management, strategies to increase pediatrics ART saturation and MMD6 for
pediatrics.
Sustaining Continuity in Treatment
Based on lessons learned in COP20, PEPFAR Nigeria will ensure continuity in treatment, by
institutionalizing MMD, ensuring patients tracked back to care are placed on DSD models based
on their need. Additionally, the program will leverage centralized patient-level data centralized in
the NDR to strengthen continuity in treatment through machine learning and predictive analysis.
A prevention package of pre-appointment calls and 2-week, 2-days and 24 hours’ pre-
appointment check-ins will be provided, listing with identified early defaulters and a list-serve
generated list to track patients within 24-48hrs of a missed appointment. Other measures to be
expanded include MMD6 for patients requiring temporary relocation, and travelers; expansion of
community models of ART delivery (e.g., community ART refill groups [CARGs]) and family-
centered approaches targeted at patients that cannot afford transportation to health facilities;
linkage to community resources for household economic strengthening activities; fast tracking of
patients to reduce waiting time within the facilities, and routine collection of patient satisfaction
surveys during visits to support continuous quality improvement of services.
2.3 Investment Profile
HIV response efforts in Nigeria continue to be almost fully dependent on international donors,
mainly PEPFAR and the Global Fund, accounting for 67% and 15% respectively of the $532.4m
reported HIV spending in 201814. Of this amount, $238.4m (45%) was reported to have been spent
on Care and Treatment, $162.5m (31%) was spent on Program Management and Administration,
and $35.6m (7%) was spent on the delivery of HIV Testing Services. PEPFAR and the Global Fund
accounted for 87% and 18% respectively of the investments in Testing, Care and Treatment, and
60% and 17% respectively of Program Management costs.
The Government of Nigeria was responsible for 89% of human resources costs for the HIV
program. PEPFAR and the GF cover the stipend payment for almost all the lay workers (data
clerks, peer educators, lay counsellors, and case managers) in the program. While the program
14
National Agency for the Control of AIDS, ‘2019 National AIDS Spending Assessment Report’.
(Unpublished Draft).
UNCLASSIFIED18
has very detailed data on expenditure support this category of workers, it was however not
reported in the most recent National AIDS Spending Assessment15.
The investments for the support of OVC is 100% from the PEPFAR program, but it is noted that the
program currently only supports OVCs in 28 states (see OVC section below) while no similar
support is available in the rest of the other states.
Table 2.3.1a Investment Profile by Program Areas (Amounts in USD) *
AIDS Spending Government Private PEPFAR GF Others Totals
Categories of Nigeria Funds
Prevention $ 21,525,222 $ 81,754 $ 7,415,680 $ 3,191,677 $- $ 32,214,333
HIV testing $ 1,003,702 $ 4,148 $ 28,088,586 $ 6,498,372 $- $ 35,594,808
Care and treatment $ 7,877,771 $ - $ 187,840,854 $ 42,728,815 $ - $ 238,447,440
Orphans and $ - $ - $ 33,754,442 $ - $ - $ 33,754,442
vulnerable children
Program $ 34,782,609 $ 111,371 $ 98,197,237 $ 27,951,621 $ 1,473,580 $ 162,516,418
management &
admin. (including
Above Site)
Systems $ - $ - $ - $ - $ 311,939 $ 311,939
Strengthening &
Program
Coordination
Human resources $ 26,094,707 $ - $ - $ - $ 3,232,645 $ 29,327,352
Social protection $ 185,557 $ - $ - $ - $ - $ 185,557
and social services
(excluding OVC)
Enabling $ 8,214 $ - $ - $ - $ 10,996 $ 19,210
environment
HIV & AIDS- $ - $ - $ - $ - $ - $ -
related research
Total $ 91,477,782 $ 197,273 $ 355,296,799 $ 80,370,485 $ 5,029,160 $532,371,499
Table 2.3.b Investment Profile by Program Areas (Percentages) *
AIDS Spending Categories (ASC) Government Private PEPFAR GF Others Proportion of
of Nigeria Funds Total By ASC
Prevention 67% 0% 23% 10% 0% 6%
HIV testing 3% 0% 79% 18% 0% 7%
Care and treatment 3% 0% 79% 18% 0% 45%
Orphans and vulnerable children 0% 0% 100% 0% 0% 6%
15
PEPFAR facility HRH assessment 2014.
UNCLASSIFIED19
Program management and 21% 0% 60% 17% 1% 31%
administration (including Above Site)
Systems Strengthening & Program 0% 0% 0% 0% 100% 0%
Coordination
Human resources 89% 0% 0% 0% 11% 6%
Social protection and social services 100% 0% 0% 0% 0% 0%
(excluding OVC)
Enabling environment 43% 0% 0% 0% 57% 0%
HIV and AIDS-related research Nil Nil Nil Nil Nil 0%
(excluding operations research)
Total 17% 0% 67% 15% 1% 100%
COP21 updates: Nigeria was unable to complete the COP21 HIV Resource Alignment Profiles in
time to use these data in this section as recommended by the Office of the U.S. Global AIDS
Coordinator (S/GAC). The team will continue to follow-up with country stakeholders to complete
these profiles and will publish these as soon as they are completed and ratified by all. There is also
no update yet to the 2019 National AIDS Spending Assessment (NASA), so the Investment Profile
tables, and narratives remains as reported in the COP20 SDS. However, please note the following
updates.
• Plans underway to complete and disseminate the 2020 NASA by August 2020.
• Local Civil Society Organizations (CSOs) have expressed some concerns about some of the
data reported in the 2019 NASA. For instance, the $21.5m reported by GON to have been
spent on HIV prevention activities is considered to have probably been misallocated as
there is no evidence to support the likelihood of this expenditure.
• Overall, the CSOs have initiated a process to work with the GoN and other stakeholders to
produce future iterations of the NASA and will work to ensure that all the data collected
are fully validated and can be matched with budgets to ensure that expenditures follow
the actual priorities identified during program planning process.
2.3.2 – National Procurement of Key HIV Commodities
For the year ending December 2020, National Commodities and Supply Chain Program reported a
total investment in HIV commodities of $195m. This is significantly more than the $126M reported
in 2019 and the $181.6M reported in 2018. While the reduction in 2019, was reportedly due to the
reduction in the levels of holding stock of commodities at the central warehouse from six months
levels to two months, the increase for 2020 is reportedly due to the progress that has been made
with MMD (and the impact this has had on volume of commodities needed to sustain the ARV
drug pipeline). About 94% of clients now reported to be on a >3 months dispensing schedule to
reduce the frequency of their engagement with the hospitals. This was one of the measures taken
as part of the Country’s COVID-19 control strategies. The chart below shows how MMD has
evolved in the four quarters of fiscal year 2020.
UNCLASSIFIED20
Figure 2.2.3 – The progress on Multi-Month Dispensing in FY2020
Donor investments continue to account for majority of country’s HIV commodities procurements
(99%), with PEPFAR and the Global Fund contributing 80.7% and 16.5%, respectively. UNITAID
also made a $4.01m investment (2.1%) in HIV self-test kits, Viral Load reagents and drugs for
treatment of opportunistic infections.
At 71%, ARV procurements still make up most of the expenditures, while viral load commodities
and RTKs, account for 13% and 9%, respectively. These proportions deviate slightly from the
previous year’s amounts of 77.7%, 11.5% and 5.7% for the three commodities with a gradual shift
towards the two diagnostics commodities. Actual procurements reflect a 42% increase in ARVs,
72% increase in Viral Load commodities and 149% increase in RTKs.
Table 2.2.2a Annual Procurement Profile for Key HIV Commodities (Amounts in USD) **
Commodity Category Government Private PEPFAR GF Others Totals
of Nigeria Funds (UNITAID)/
(JPEIGO)
ARVs $342,165 $- $122,704,702 $16,009,325 $- $139,056,193
Rapid test kits $228,000 $729,600 $9,496,474 $7,093,073 $487,578 $18,034,725
Other drugs (OIs) $149,125 $- $5,715,832 $2,786,766 $545,610 $9,197,333
UNCLASSIFIED21
Table 2.2.2a Annual Procurement Profile for Key HIV Commodities (Amounts in USD) **
Commodity Category Government Private PEPFAR GF Others Totals
of Nigeria Funds (UNITAID)/
(JPEIGO)
Lab reagents (CD4 $- $- $838,982 $1,222,135 $- $2,061,117
commodities)
Condoms $- $- $- $- $- $-
Viral Load commodities $- $- $16,873,266 $4,992,021 $3,016,443 $24,881,730
EID commodities $- $- $788,628 $110,488 $- $899,116
Other commodities $- $- $1,095,305 $- $- $1,095,305
(GeneXpert Cartridges)
Total $719,291 $729,600 $157,513,189 $32,213,808 $4,049,631 $195,225,518
Table 2.3.2b Annual Procurement Profile for Key HIV Commodities (Percentages) **
Commodity Category (CC) Government Private PEPFAR GF Others Proportion
of Nigeria Funds (UNITAID)/ by CC
(JPEIGO)
ARVs 0.2% 0.0% 88.2% 11.5% 0.0% 100.0%
Rapid test kits 1.3% 4.0% 52.7% 39.3% 2.7% 100.0%
Other drugs (OIs) 1.6% 0.0% 62.1% 30.3% 5.9% 100.0%
Lab reagents (CD4 0.0% 0.0% 40.7% 59.3% 0.0% 100.0%
commodities)
Condoms Nil Nil Nil Nil Nil Nil
Viral Load commodities 0.0% 0.0% 67.8% 20.1% 12.1% 100.0%
EID commodities 0.0% 0.0% 87.7% 12.3% 0.0% 100.0%
Other commodities 0.0% 0.0% 100.0% 0.0% 0.0% 100.0%
(GeneXpert Cartridges)
Total 0.4% 0.4% 80.7% 16.5% 2.1% 100.0%
Unfortunately, there was no reported condom procurements for the second year in a row. This
gap is being addressed in the current fiscal year through procurements by the Global Funds and a
country allocation from a USAID Washington pool, while in the COP21, it will be addressed
through a planned $1.5m budget for condoms, as reflected on the commodities summary sheet in
appendix G.
Through the Nigeria Comprehensive AIDS Program in States (NCAPS) program, funded by the
National Agency for the Control of AIDS (NACA) in Abia and Taraba states, the GON reportedly
spent about $720,000 on HIV commodities in 2020. This is significantly less than the $2.6m spend
in 2019. This decrease in domestic expenditure likely reflects the shrinking fiscal space as oil
prices fell to all-time lows, driven by COVID-19-derived global economic issues.
The success of the treatment surge over the last fiscal year will ultimately warrant an increase in
commodities investments in the coming years. The National Alignment efforts launched last year
UNCLASSIFIED22
will help to ensure that resource allocations reflect this increasing need, which unfortunately may
result in reduced allocations to other program areas unless there is improvements in domestic
financing for HIV services. NACA and the FMoH continue to reassure stakeholders of the
Government’s commitment to increase investments in the coming years.
2.2.3 - US Government health-sector investments outside PEPFAR
Aside from HIV/AIDS program investments, the USG agencies supporting PEPFAR have proposed
other health-sector related investments in 2022 amounting to a total of $188,530,512. The US
Agency for International Development (USAID) will invest $13 million in support of the National
TB and Leprosy Control Program, $74 million in the National Malaria Control Program and $32
million in Maternal and Child Program. USAID also invested about $25 million investment in
support of Family Planning and Reproductive Health services, $7 million in Nutrition and $14
million in Water and Sanitation.
The US Centers for Disease Control and Prevention (CDC) similarly will invest about $16.1 million
in the Polio Eradication efforts, to help sustain Nigeria’s newly acquired status as a “polio-free”
country (Nigeria eradicated Wild Polio Virus 1 in August 2020). These investments will also
support Routine Immunization and disease surveillance efforts in collaboration with the FMoH.
CDC will also invest about $2.77m to support Nigeria’s global health security response and
reporting initiatives.
Lastly, the US Department of Defense (DoD)/Walter Research Army Institute of Research
(WRAIR) will support various health collaborations with the Nigerian Ministry of Defense, the
FMoH, and academic institutions to support approximately $4.6m in programming and research
in malaria, Lassa fever, and other emerging infectious diseases.
Table 2.2.3 USG Non-PEPFAR Funded Investments and Integration
Funding Source Total USG Non- Objectives
PEPFAR Resources
USAID TB $13,000,000 Accelerate case-finding and increase national case detection rate.
USAID Malaria $74,000,000 Reduce malaria burden under the PMI.
USAID Maternal $32,000,000 End preventable child and maternal deaths.
& Child Health
USAID Family $25,000,000 Improve access to and use of quality and voluntary Family Planning
Planning & Rep. services including long acting and permanent methods to reduce
Health unwanted pregnancies.
USAID NUT $7,000,000 Reduce malnutrition among women and children.
USAID WASH $14,000,000 Improve water supply and sanitation.
CDC Global $16,137,285 • Attained and sustained certification for wild polio type 1 (WPVV1)
Immunization free status in Nigeria. Note that Nigeria eradicated WPV1 in
Division (GID) August 2020.
• Improved and targeted surveillance activities across states with
CDC/AFENET presence
• Strengthened polio SIA campaigns and outbreak responses efforts
in response to circulating vaccine derived polio vaccines
UNCLASSIFIED23
Table 2.2.3 USG Non-PEPFAR Funded Investments and Integration
Funding Source Total USG Non- Objectives
PEPFAR Resources
• Strengthened collaboration with the Government of Nigeria (and
other partners) on the transition of polio resources and structures
to support broader surveillance, routine immunization, and PHC
services as GPEI funding dwindles
• Improved routine immunization coverage from 33% to 80% by
2028 through a variety of RI strengthening strategies (e.g., IMOP,
integrated campaigns and RI services etc.)
• Measles elimination: through increase in measles coverage,
introduction of measles dose 2 and quality measles campaigns
• Strengthened surveillance and testing of vaccine preventable
diseases such as measles, yellow fever, and congenital rubella
syndrome.
• Improved response to the COVID-19 pandemic and increased
uptake of the COVID-19 vaccine
CDC Division for $2,765,408 Strengthening of International Health Regulations core capacities to
Global Health promote global health security primarily through:
Protection • Workforce development through frontline, intermediate and
(DGHP) advanced training programs for field epidemiologists through the
NFELTP program.
• Establishment and operationalization of Emergency Operations
Centers.
• Development/improvement/strengthening of Real-Time
Surveillance and Border Health Security.
• Development/improvement/strengthening of Information Systems
and GHSA Reporting
• Development of Public Health Emergency Management programs
DOD JWARG $587,729 Joint West Africa Research Group.
DOD AFRICOS $111,142 African cohort study: longitudinal follow up of PLHIV
Science
DOD INLAP $6,339 External quality assurance panels for clinical laboratory testing
performed under the MHRP research program
DOD LASSA EPI $480,363 Prevalence of Lassa virus-specific antibodies (IgG and IgM) among
adult human populations
DOD Malaria $2,525,122 Malaria diagnostics and quality assurance
DOD Key $556,526 Support for the development of KP guidelines under the national
Populations alignment.
(Global Fund
support)
DOD RV466 $60,755 To obtain four genetically diverse strains of P. falciparum parasites
MALARIA representative of the global diversity for cGMP manufacturing for use
in Controlled Human Malaria Infections (CHMI).
DOD RV466 $37,033 Determining the infectious etiologies and their frequencies among
ULTRASOUND adult patients with acute febrile or other severe acute illness with a
suspected infectious source presenting to study hospitals in Lagos.
DOD BIOSAFETY $262,813 Supporting IPC against especially dangerous pathogens and increasing
AND SECURITY capacity in biosafety, biosecurity, and bio risk management.
Total $188,530,512
UNCLASSIFIED24
COVID 19-related Investments
Outside of the Country Operational Plan 2021, PEPFAR has allocated additional funds to Nigeria
under the American Rescue Plan Act (ARPA) COVID-19, “to support programs for the prevention,
treatment, and control of HIV/AIDS to prevent, prepare for, and respond to coronavirus,
including to mitigate the impact on such programs from coronavirus and support recovery from
the impacts of the coronavirus.” Following the ARPA guiding principles, PEPFAR Nigeria is
approved for $17,525,000 to support activities around the two purposes of ARPA PEPFAR planned
funds: 1) Prevent, prepare for, and respond to coronavirus, and 2) Mitigate COVID-19 impact on
PEPFAR programs and beneficiaries and support program recovery from the impacts of
coronavirus. All planned activities are aligned with broader USG global COVID-19 response and
recovery strategies and objectives and are non-duplicative of existing support to the Government
of Nigeria’s COVID-19 response. The PEPFAR Nigeria team has completed the PEPFAR ARPA
COVID-19 Assistance request, including the table of the various activities to be undertaken (see in
appendix), which has also been entered in the COP21 FAST, per the guidance.
Table 2.2.4 PEPFAR Non-COP Resources, Central Initiatives, PPP, HOP
Funding Source Total PEPFAR Non- Objectives
COP Resources
Funds will be used to support PEPFAR programming as stated
below:
• Build COVID-19 vaccine module in EMR (LAMISPlus) to
support surveillance of COVID-19 vaccinations in PLHIV in
USAID –supported SNUs.
• Improve IPC practices among health care workers in USAID-
supported sites.
• Produce and disseminate evidence-based COVID-19
prevention messages and will drive demand for COVID-19
vaccine via multimedia.
USAID – COVID $8,308,250 • Support COVID-19 vaccine access for PEPFAR beneficiaries
ARPA Funds and staff at targeted sites, including coordinating
the prioritization of vaccines for PLHIV with NPHCDA,
NCDC, and state-level.
• Support the transport of COVID19 test samples in Nigeria,
leveraging the HIV viral load sample transport network that
exists via PEPFAR.
• Support COVAX rollout in Nigeria, leveraging the health
commodity supply chain and logistics system that USAID
supports in Nigeria, including storage/warehousing and
distribution of COVAX to the state-level; and
• Support scaling of decentralized drug delivery (DDD) and
MM6 reducing client exposure to COVID-19 within health
facilities (including partnering with private sector actors to
leverage investments).
UNCLASSIFIED25
Table 2.2.4 PEPFAR Non-COP Resources, Central Initiatives, PPP, HOP
Funding Source Total PEPFAR Non- Objectives
COP Resources
DOD - COVID • Strengthen Infection, Prevention and Control (IPC) among
ARPA Funds HCWs. This will build on the results of the IPC study among
HIV HCW, to include training of over 1,000 health care
workers across 32 military health facilities. The training will
be in two phases with ToT and step down at each facility.
Disinfectant such as Sodium Hypochlorites, Medical Grade
Alcohol-based Hand sanitizer, Auto Sanitizer
Dispenser etc will be procured to improve supplies at the
sites.
$500,000 • Strengthening military-supported COVID-19 laboratory
testing platforms to primarily serve the HCWs that have
been more prone to getting infected with COVID-19 when
caring for PLHIV, and to provide confirmatory testing in the
event of inconclusive results on the COBAS 8800 or
GeneXpert systems. This include purchase of ancillary
supplies for open PCR platforms (Roche LightCycler and ABI
7500), including RNA extraction kits, that are not included
in the procurements by the GoN or Global Fund.
• COVID-19 vaccine sensitization. Data has shown that HCWs
are hesitant to receive COVID-19 vaccination in military
health facilities.
Support PEPFAR programming to prevent, treat, and control
HIV AIDS to prevent, prepare for, and respond to coronavirus,
through:
• Strengthened infection prevention and control (IPC)
programming at over 1,700 CDC PEPFAR-supported sites.
• Increased COVID-19 testing among CDC PEPFAR
beneficiaries and staff
• Enhanced COVID-19 laboratory capacity for genotyping to
track COVID-19 variants of concern.
CDC – ARPA $8,716,750 • Enhanced COVID-19 laboratory capacity for serologic
Funds testing, including to understand evidence of previous SARS-
CoV-2 infection among PEPFAR beneficiaries and serologic
testing of HIV viral load remnant samples.
• Enhanced PEPFAR data management systems for COVID-19,
including site-level electronic medical records (EMR), the
Laboratory Information Management System (LIMS), and
the National Data Repository (NDR); and,
• Expanded virtual telecommunications to allow for continued
PEPFAR program management during ongoing COVID-19
mitigation efforts (e.g., lockdowns).
Total $17,525,000
2.4 National Sustainability Profile Update
As with previous years, the 2019 Sustainability Index and Dashboard (SID) was developed through
a rigorous stakeholder process led by an Expert Panel with membership drawn from Stakeholder
groups – NACA, NASCP, UNAIDS, WHO, Civil Society Organizations, Implementing Partners and
UNCLASSIFIED26
the PEPFAR team. The group met over a 5-days period to complete the first draft of the SID
questionnaire as well as the newly introduced Responsibility Matrix; an accompanying tool which
aimed to assess the functional responsibilities (by contributing to that element and being
accountable for its level of success or failure) of the three major funding components of the HIV
response: PEPFAR, the Global Fund, and Host Government. The draft report of the Expert Panel
was reviewed by a Stakeholder group in November 2020, where additional inputs were gathered
and incorporated. A final draft of the SID documents was subsequently disseminated in January
before it was finalized and disseminated.
As seen from the dashboard (Figure 2.4 below), the Country has sustained the achievements
recorded in the previous iteration of the SID. Despite slight reversals observed in a few areas.
Nigeria achievements continue to be sustained due to the fat that most of the structural and
systematic recommendation identified in previous assessments remain intact.
Sustainability Analysis for Epidemic Control: Nigeria
Epidemic Type: Generalized
Income Level: Lower middle income
PEPFAR Categorization: Long-term Strategy (Co-finance)
PEPFAR COP 19 Planning Level: $392,154,669
2015 (SID 2.0) 2017 (SID 3.0) 2019 2021
Governance, Leadership, and Accountability
1. Planning and Coordination 8.17 9.67 9.67
2. Policies and Governance
SUSTAINABILITY DOMAINS and ELEMENTS
5.44 6.57 5.55
3. Civil Society Engagement 6.33 8.33 7.71
4. Private Sector Engagement 4.93 7.42 5.81
5. Public Access to Information 7.00 5.00 6.56
National Health System and Service Delivery
6. Service Delivery 2.50 6.06 4.90
7. Human Resources for Health 4.92 6.09 6.09
8. Commodity Security and Supply Chain 5.73 6.18 4.72
9. Quality Management 6.24 7.38 3.86
10. Laboratory 4.44 5.83 5.94
Strategic Financing and Market Openness
11. Domestic Resource Mobilization 3.06 5.71 5.56
12. Technical and Allocative Efficiencies 4.51 8.00 7.58
13. Market Openness N/A N/A 9.20
Strategic Information
14. Epidemiological and Health Data 3.75 5.71 5.99
15. Financial/Expenditure Data 5.00 8.33 7.50
16. Performance Data 3.74 6.23 5.84
17. Data for Decision-Making Ecosystem N/A N/A 0.67
Figure 2.4.1 – The Nigeria 2019 SID Dashboard
UNCLASSIFIED27
Recent improvements in the political engagement on HIV financing, as evidenced by the open
pronouncement by the Federal GON of its commitment to provide domestic funding for the
treatment of an increasing number of PLHIV in Nigeria has helped, despite the lack concrete
evidence of these investments at the time of the assessment. As it stands, the Government has
promised to support 100,000 persons on treatment annually in 2020 with plans to see that number
increase by 50,000 on annual basis henceforth.
The progress in the efforts to introduce optimized drug regimens and improve program
coordination through regular engagements with stakeholders and the reintroduction of Joint
Annual Program Review, all process contributed to these sustained positive reviews, while the
continued lack of growing domestic commitments and service provider’s inability to eliminate all
user fees related to HIV was flagged. Despite commitments from several State Government and
some open pronouncements on these issues, most of the States had yet to make any concrete
steps in this regard. One State (Rivers) does appear to have identified and deployed an effective
model of reimbursing public hospitals for their losses on user fees and in doing so, guaranteed
that PLHIV in their state could indeed access services with no user fees.
The re-emergence of the Nigeria Business Coalition and its renewed conversations with NACA for
the set-up of a Private Sector-led HIV Trust Fund may prove to be a game-changer in subsequent
SID assessments. Despite improvements in the operations and program outcomes of key health
systems investments supporting the treatment program, stakeholders had a negative perception
of the absence of easily accessible data tracking the National Pooled Procurement and Integrated
Commodity Supply Chain as well as the National Integrated Sample Referral System (NISRN)
which had in particular led to the ability to account for the turnaround time of results for viral
load and EID samples sent to the reference labs for processing.
New in COP21 - Since the completion of the SID, the National Quantification Team led by the HIV
Department of the FMOH prepares a bi-annual supply planning report that tracks procurement and
utilization of HIV commodities which is shared widely across all stakeholders. In addition, the
National Health Logistics Management System (NHLMIS) has been scaled up and is being utilized
by all health facilities providing HIV services in the country with bi-monthly reporting on stock
levels, utilization/consumption, and commodity receipts at facility level. This platform is accessible
to all state MOHs through the Logistics Management Coordination Units (LMCU) and is currently
being upgraded to provide dashboards on commodity status to inform decision making. Similarly,
data visibility for the National Integrated Sample Referral Network (NiSRN) is being improved
through the following strategies; 1) activation of sample management module with in the Lab
Information Management Systems (LIMS) and remote login of samples from the collection sites
which enables end-to-end visibility and electronic return of results thereby improving turnaround
time for lab results and the activation of e-Labs and an electronic platform to track movement of the
lab samples from collection sites to the labs.
For the two new elements introduced in the SID, the findings were mixed. On Market Openness,
or the extent to which the country’s policies impact on the ability of stakeholders to contribute
UNCLASSIFIED28
effectively to the national HIV/AIDS response, Nigeria was positively assessed because of the
availability of ample opportunities for stakeholders to operate and compete transparently in the
allocation of investments within the national HIV response effort.
On the other element, Data for Decision-Making Ecosystem, the country scored poorly because of
the sub-optimal status of the Civic Registration and Vital Statistics system and the absence of
formal unique identification systems for de-duplicating individual service delivery experiences
and related health outcomes. Also flagged was lack of accurate and updated national population
estimates and the fact that there has not been a Census in the country since 2006.
The recent ratification of the use of biometric apparatus and EMR systems for optimized
biometric data capturing and linkage to the NDR by the fifth National Council on AIDS presents
an opportunity to begin to make improvements on this sustainability element. In addition,
PEPFAR partners are currently rolling out biometric patient data identification systems for the
facilities they support. Recent agreement between the three major donors as outlined in the
Country Alignment Plan, ensures that for 2020-2023, the country will be resourced to implement
a standard package of program services, a common national target framework and review process,
as well as a common national financing framework for the HIV response. It is expected that the
outcome of this new approach to supporting the Nigeria HIV response will yield improved results
in future SID assessments.
What’s new in COP21 – Given that the SID is a biannual process, there is no update to the 2019
iteration of the document. The only update to this section is inserted above.
2.5 Alignment of PEPFAR investments geographically to disease burden
Nigeria has made significant progress towards achieving the UNAIDS goals of 95-95-95 by 2023.
At the end of December 2020, there were about 1,804,612 PLHIV in Nigeria. Due to concerted
efforts by several stakeholders, the country had 1,492,154 PLHIV currently receiving ART across all
SNUs, with PEPFAR alone responsible for 83% of PLHIV on ART, bring the country’s treatment
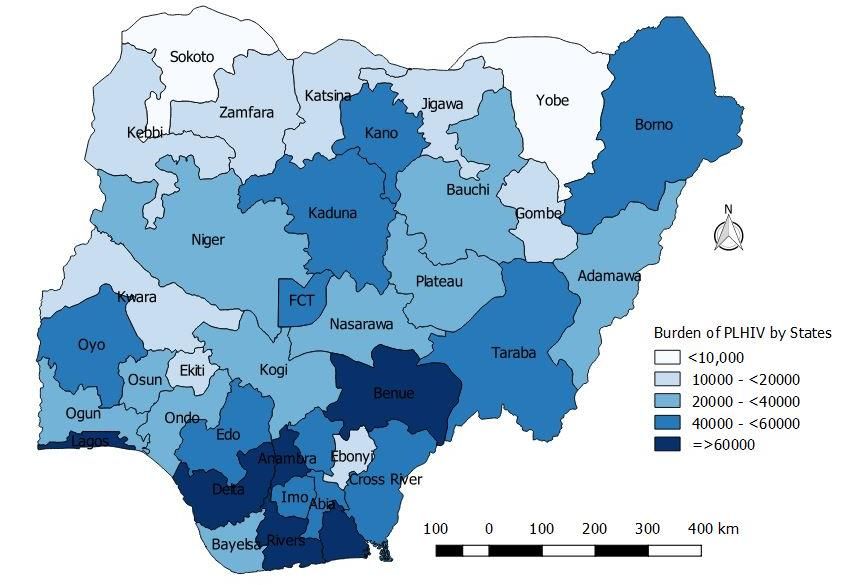
coverage to 83%. Figure 2.5.1 shows the maps of Nigeria by SNU for PLHIV burden and unmet
treatment needs. PEPFAR’s investment has been aligned over the past six years to provide more
support to SNUs with the highest unmet needs.
The progress in Nigeria in the past few years suggests major success has been achieved. For
example, Benue state, the SNU with the highest PLHIV burden, now has a relatively low unmet
treatment need due to significant scale-up efforts in the past few years to improve access to
treatment. A similar effort is currently in progress in Akwa Ibom and Rivers states to increase
access to treatment and achieve epidemic control. In 2019, the two states accounted for 18% of the
unmet treatment needs in Nigeria.
UNCLASSIFIED29
Figure 2.5.1: Nigeria’s PLHIV burden by SNU
Figure 2.5.3 depicts the SNUs in Nigeria by treatment coverage and contribution to unmet need.
In COP21, PEPFAR will achieve treatment saturation (81% treatment coverage) in 29 states with 6
states having treatment coverage of 60% including programing in Abia. Concurrently, the Global
Fund will scale up ART services in Ebonyi and Anambra.
The key aspects of the national alignment are the focus on program synergies, resource efficiency
by preventing duplication of efforts, improvement in program outcomes through shared learning,
and harmonization of program standards. Another key aspect will include joint supportive
supervision activities for a subset of health facilities with the unique characteristics of having a high
client load and being in densely populated, urban communities in the eight scale up states. These
sites will form the learning hubs for the ESM strategy. The goal of the current implementation
period is first to engage with the State Government and other stakeholders to address all policy and
program-level barriers which may pose a challenge to the planned scale-up efforts. The program
will engage each site in a deep-dive analysis of service delivery processes to understand the issues
impairing delivery of services at the prescribed optimum levels.
2.6 Stakeholder Engagement
Leveraging the opportunity of the virtual meeting space, the country team enjoyed the most in-
depth and robust country engagement with Civil Society, implementing partners, GoN, the UN
system, and the Global Fund partners, in developing the COP21 planning proposals.
UNCLASSIFIEDYou can also read


