Central Dunedin Speed
        Restriction
Health Impact Assessment
         Report

                      2010
←
→
Page content transcription
If your browser does not render page correctly, please read the page content below
Central Dunedin Speed
Restriction
Health Impact Assessment
Report
2010
Table of contents
                                                                                             Page numbers
   Table of figures.............................................................................................3
   Glossary .......................................................................................................4
Executive Summary.......................................................................................5
1.      Introduction .......................................................................................10
   1.1    Statement of proposal......................................................................10
   1.2    Aim of HIA .......................................................................................10
   1.3    Genesis of the project......................................................................10
   1.4    HIA team..........................................................................................11
   1.5    Reports contents .............................................................................11
2.      Health Impact Assessment...............................................................12
   2.1    What is Health Impact Assessment? ...............................................12
   2.2    The determinants of health ..............................................................12
   2.3    Why are we using the HIA tool? ......................................................12
   2.4    How are we using the HIA tool? ......................................................13
3.      Background .......................................................................................14
4.      Community profile ............................................................................15
5.      Discussion piece on traffic engineering .........................................19
   5. 1 Fundamentals of traffic management ..............................................19
6.      Screening and scoping.....................................................................20
   6.1    Screening ........................................................................................20
   6.2    Scoping............................................................................................20
   6.3    Scope of the HIA .............................................................................20
        6.3.1      Timeframe for the HIA process .............................................21
        6.3.2      Aims and objectives of the HIA .............................................21
        6.3.3      The identified determinants of health ....................................21
        6.3.4      The population groups most affected....................................22
        6.3.5      Budget ..................................................................................22
7.      Summary of literature review ...........................................................23
   7.1    How does traffic speed influence health and well-being? ................23
   7.2 How does a 30km/h speed limit reduce the severity and number of
          crashes? ...........................................................................................24
   7.3    How does a 30km/h speed limit impact on physical activity?...........25
   7.4    How does a 30km/h speed limit impact on social capital? ...............26
8.      Appraisal............................................................................................27
   8.1    Appraisal workshop process............................................................27
   8.2    Extra appraisal meetings .................................................................27
   8.3 Overall findings of appraisal workshops and subsequent appraisal
          meetings ...........................................................................................28
9.      Recommendations ............................................................................29
   9.1    Recommendation process ...............................................................29
   9.2    Set of recommendations..................................................................29
10.     Evaluation ..........................................................................................32
   10.1     Evaluation framework ....................................................................32
   10.2     Conducting the evaluation..............................................................33
Appendices...................................................................................................34
   Appendix 1.         Screening questions and answers....................................34
   Appendix 2.         Community profile ............................................................36

Central Dunedin Speed Restriction HIA Report             1
Appendix 3. Scoping workshop ............................................................44 Appendix 4. Literature review...............................................................47 Appendix 5. Appraisal workshop ..........................................................67 Appendix 6. Extra appraisal workshops ...............................................71 Appendix 7. Extra appraisal workshop meeting notes..........................76 Central Dunedin Speed Restriction HIA Report 2
Table of figures
Page numbers
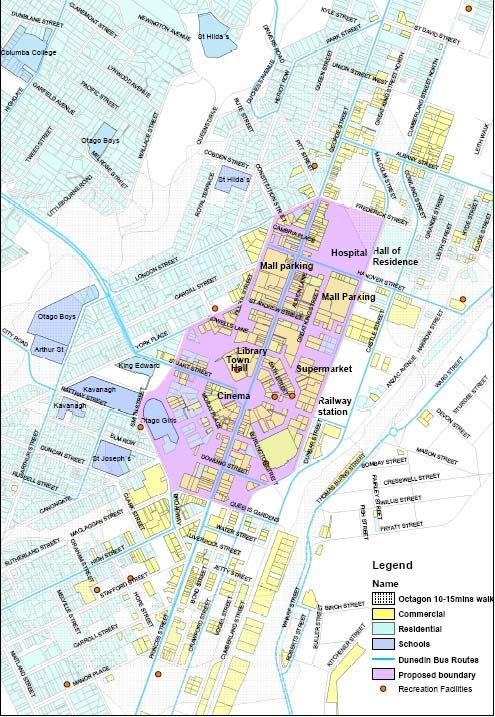
Figure 1. Geographical location of proposed 30 km/h zone.........................................6
Figure 2. Speed profile...............................................................................................16
Figure 3. Percentage of vehicles exceeding speed limit ............................................17
Figure 4. Percentage of vehicles exceeding speed limit - Moray to Dowling St.........18
Please note there are also attachments included with this document, they are;
Attachment 1 Map of zone, illustrating schools, recreational areas etc
Attachment 2 Pedestrian injuries in central city crash sites and injury type
Attachment 3 HIA zone dwelling types
Attachment 4 Meshblock population, census 2006
Attachment 5 Deprivation deciles illustrating inequalities within the area
Attachment 6 Residence of students attending Kavanagh College, Otago
Girls’, Otago Boys’, St Joseph’s Cathedral and St Hilda’s
Collegiate by meshblock
Attachment 7 Photo illustrating pollution on internal shop wall
CAS Data
Attachment 8a Road traffic accidents by road user age
Attachment 8b Road traffic accidents by road user and time
Attachment 8c Hourly time versus road user
Attachment 8d Road Traffic accidents – by road user and day/night
Central Dunedin Speed Restriction HIA Report 3Glossary
Appraisal Identifies the relevant determinants of health and uses specific
workshops tools to identify potential health impacts.
Barnes Dance A type of pedestrian crossing whereby all traffic stops and
pedestrians are able to cross the intersection in any direction,
including diagonally. Also known as a scramble crossing or
diagonal crossing.
Central City An integrated ‘place based’ strategy for the central city area, to
Strategy identify an integrated package of actions that can be used to
revitalise that centre economically and socially and improve
connections and shared spaces.
Determinants of Health is determined by a continuum of influences ranging from
health age, sex and heredity factors, through to individual behaviours,
and the social, cultural and economic contexts in which people
live their lives.
Health Impact A formal process which predicts the potential effects on health,
Assessments and aims to mitigate and improve health outcomes by providing
(HIA) evidence based recommendations.
Modal shift Transition phase from one mode of transport to another.
Scoping Highlights the key issues that need to be considered to define
and shape the HIA.
Social capital Refers to the connection within and between social groups.
Social capital is a public good, calculated on the benefits to
society that accrue through individuals being part of a network
of mutual acquaintance and connection.
Screening Initial selection process to assess a policy’s suitability for HIA.
Central Dunedin Speed Restriction HIA Report 4Executive Summary Background information This report presents the process and findings of a Health Impact Assessment (HIA) on a proposal by Dunedin City Council (DCC) to extend the 30km/hr speed limit zone within the central city. The work was initiated and co-funded by the DCC. The DCC led the HIA, in partnership with Public Health South (PHS) and with guidance from Impact Assessment Specialist, Martin Ward. Dunedin City is the second largest city in the South Island, with a population of 122,000. The city has a relatively static population although the University has had significant growth with tertiary student enrolments, nearly doubling over the last twenty years. Tertiary students make up nearly 20% of the Dunedin community with almost 80% of all Dunedin 20 to 24 year olds being tertiary students. The city has a smaller proportion of children than New Zealand’s national rate, yet similar to national demographics Dunedin’s population is ageing – a trend that is set to continue. Dunedin’s city centre retains a ‘main street’ format, with the main street being George Street. George Street forms a central spine along which shops and businesses are located, with overflow onto neighbouring streets. The city centre contains offices, residential and commercial accommodation, retail, restaurants, cafes and services such as the hospital and Police. On the perimeter of the core central city is several schools and childcare facilities. The area experiences high pedestrian and vehicle traffic movement. In addition many crashes occur within the city centre. Dunedin has a markedly high rate of traffic crash injury at 554.5 per 100,000 compared to the national rate of 352 per 100,000. This rate of injury falls disproportionately across population groups affecting cyclists, pedestrians and the elderly more. The DCC is developing a Central City Strategy (CCS). The purpose of the CCS is to produce an integrated ‘place based’ strategy for the central city area. Place-based strategies aim to identify an integrated package of actions that can be used to revitalise that centre economically and socially and improve connections and shared spaces. The HIA of the proposed expansion to the 30km speed limit zone will assist in the identification of issues and opportunities for the CCS. Central Dunedin Speed Restriction HIA Report 5
Figure 1. Geographical location of proposed 30 km/h zone

Central Dunedin Speed Restriction HIA Report   6
The HIA

This HIA examined the implications of a draft proposal to extend the 30km/hr urban
speed zone in the central city area of Dunedin. The HIA looked at the effects, both
positive and negative, on the following determinants of health and well-being:
physical activity, social capital and personal safety. Potential effects were considered
for three priority groups: the elderly, youth and the general pedestrian population.

The geographical scope of the HIA is approximately from Union Street in the north, to
the Oval in the south; from Smith Street in the west to Anzac Avenue in the east.
Within this area the proposed 30km/hr reduced speed zone is bounded by Queen’s
Gardens, Cumberland Street, Frederick Street, Filleul Street, Smith Street and
Rattray Street (Figure 1). The two one-way system will not included in the area.

The process included a scoping workshop, a community profile, a literature review
and an appraisal workshop. Evidence gathered during this process was used to
inform the recommendations. A separate evaluation process ran alongside the HIA.

HIA findings
Overall the HIA found that the proposal to extend the 30km/hr zone would result in an
increase in levels of personal safety and social capital. There was also evidence to
suggest that levels of physical activity would rise if certain other factors were brought
into play. These were the creation of pedestrian-only zones and design of the area to
ensure pedestrians were sheltered from rain when waiting to cross the road. There
was evidence to suggest that noise and exhaust emissions from passenger transport
vehicles were hindering physical activity and levels of engagement in community
activities and public affairs in the zone. Passenger transport vehicles were regarded
as “noisy”, “smelly” and “off-putting” for pedestrian traffic and potential users. This
was of concern as we are seeking to encourage modal shift away from single
occupancy vehicle use and towards walking, cycling and passenger transport.

There was support for the proposal to extend the 30km/hr zone from all of the groups
interviewed at the appraisal stage of the HIA.

The HIA process resulted in the following recommendations being formulated based
on the evidence gathered in the HIA.

Recommendations

Recommendations to the Dunedin City Council:

Recommendation 1
   That the extended zone be implemented by the Dunedin City Council as part of
   the Central City Strategy.

Recommendation 2
   That a range of engineering and other measures that encourage pedestrian use
   and increase their safety are implemented by Dunedin City Council e.g. Barnes
   Dances; wider pavements; raised carriageways, with emphasis on entry
   treatments.

Central Dunedin Speed Restriction HIA Report   7
Recommendation 3
   That Dunedin City Council investigates the opportunity/need to have more
   “intensive” measures in areas with high crash rates taking account of time
   distributions e.g. outside Meridian. That in relation to this, Dunedin City Council
   takes into account the different traffic profile of St Andrew Street.

Recommendation 4
   That Dunedin City Council considers the introduction of traffic management
   measures to encourage smooth traffic flow in order to reduce emissions. That in
   support of emission reduction, Dunedin City Council investigates methods of
   managing destination versus through traffic.

Recommendation 5
   That the Dunedin City Council increase pavement width and amenity to improve
   access, social interaction and usability.

Recommendation 6
   That the Dunedin City Council uses a range of methods to support and
   encourage walking and cycling in the area, e.g. by providing safe and convenient
   crossing points in suitable locations, providing facilities at destinations e.g. cycle
   parking, reallocating road space to cyclists and pedestrians, urban design and
   amenity improvements that make cycling and walking more appealing and
   enjoyable, including public art, inlaid mosaics, sculpture and so on.

Recommendation 7
   That the Dunedin City Council considers an extension of the zone to increase
   safety for school children in/around View Street, Smith Street and York Place.

Recommendations to the Otago Regional Council:

Recommendation 8
   That the Dunedin City Council and the Otago Regional Council work together to
   consider alternative passenger transport routes in the central area (to help reduce
   emissions) and provide more “hub” based approach to services for ease of use.

Recommendation 9
   That the Otago Regional Council amends bus contracts to increase penalties for
   not conforming to requirements for noise and exhaust emissions and/or require
   passenger transport vehicles to elevate the exhaust.

Recommendations to the Ministry of Health, Ministry of Transport, New
Zealand Transport Authority, Ministry for the Environment and Environmental
Protection Agency:

Recommendation 10
   That the Ministry of Transport and NZTA separate noise and exhaust emission
   standards for the passenger service vehicles from those for heavy vehicles in
   New Zealand.

Recommendation 11
   That the Ministry of Health/Ministry for the Environment/Environmental Protection
   Agency/NZTA and Ministry of Transport work together to devise a more stringent
   set of passenger transport emission standards. This revised set should be
   suitable for use in those areas of high pedestrian density.

Central Dunedin Speed Restriction HIA Report   8
Recommendation 12
   That the Ministry of Transport research safety and amenity benefits arising from
   the introduction of 30km/hr zones in both central city shopping areas and school
   zone areas and develop a New Zealand evidence base of health and well-being
   effects of the introduction of 30km/hr speed limits.

Recommendation for Public Health South and Dunedin City Council:

Recommendation 13
   That an investigation into the value of a Memorandum of Understanding between
   Dunedin City Council and Public Health South whereby projects of interest are
   identified early on for potential HIAs be undertaken.

Central Dunedin Speed Restriction HIA Report   9
1.       Introduction
This report contains an outline of the processes and outcomes of the Central
Dunedin Speed Restriction HIA (the HIA) which was undertaken between January
and June 2010.

1.1 Statement of proposal
The HIA assesses both positive and negative impacts on community health and well-
being of an expansion to the existing 30km/hr speed limit zone, within the Dunedin
central city area.

The HIA process identifies whether the effects of the proposal will have impacts on
the community, with a focus on vulnerable groups in particular, and how severe these
will be.

The findings of the HIA will contribute to the pool of research being assembled by the
DCC, and provide specific recommendations to improve the proposal. The HIA will
also help embed the HIA process within the organisation and assist with the
prioritisation of future projects in the city centre by informing the Central City Strategy
(CCS). The purpose of the CCS is to produce an integrated ‘place based’ strategy for
the central city area. Place-based strategies aim to identify an integrated package of
actions that can be used to revitalise that centre economically and socially and
improve connections and shared spaces. The HIA of the proposed expansion to the
30km speed limit zone will assist in the identification of issues and opportunities for
the CCS.

1.2 Aim of HIA
The overall aim of the Central Dunedin Speed Restriction HIA is for the DCC to
complete a quality HIA in partnership with PHS on the proposal to extend the 30
km/hr speed zone.

1.3 Genesis of the project
The subject of this HIA was identified during a conversation between the
Transportation Operations Department of the DCC and Iain McCauley, Principal
Adviser/Scientist at the Ministry of Transport. During which it was realised that there
was no evidence on the effects on health and well-being due to a reduction in speed
limits, within New Zealand (NZ). Staff members of both the DCC and PHS had
completed HIA training and were keen to collaborate on the production of a
meaningful contribution to knowledge of public health in NZ.

Central Dunedin Speed Restriction HIA Report   10
1.4 HIA team
The DCC initiated the work which was partly funded from the Ministry of Health’s HIA
Support Unit ‘Learning by Doing’ fund. The DCC led the HIA in partnership with PHS
which contributed in-kind. The HIA team consisted of;

Charlotte Flaherty – Travel Co-ordinator, Transport Operations, DCC
Sarah Weller – Senior Planner, Transport Operations, DCC
Steve Miles – Principal Urban Designer, DCC
Diana Munster –Transportation Operations, DCC
Emma Lynch – Public Health Researcher, PHS
Faola de Montgomery – Mental Health Promotion Advisor, PHS

Evaluator
Emma O’Neill - DCC

Martin Ward – Impact Assessment Specialist

1.5 Reports contents
This report contains information about stages in the HIA process including the
screening stage, the statement of proposal, the scope of the project and the scoping
and appraisal workshops. It also records the process and information collected
during the creation of a community profile and a literature review. It presents a
general outline of the HIA process and places HIA in a global context. This report
identifies the benefits to this project of the inter-agency collaboration and inclusion
that is a trademark of the HIA process. This report seeks also to record the ‘Learning
by Doing’ process, highlighting successes and learning points.

The information contained in this report will be used to identify key issues for the
DCC Planning and Transportation Departments and will ultimately inform the Central
City Strategy.

Central Dunedin Speed Restriction HIA Report   11
2.       Health Impact Assessment

2.1 What is Health Impact Assessment?
Health Impact Assessment (HIA) is a tool endorsed by the World Health
Organisation. It is widely used throughout Europe. HIA has been used in New
Zealand for a number of years and in particular since 2005.

HIA is applied to draft proposals and uses a collection of tools to predict the health
impacts and consequences and to ascertain whether the positive impacts can be
amplified and the negative impacts mitigated against. HIA also helps organisations to
identify whether the possible effects of the policy affect one group more than another
and helps provide clarity around planning to meet a diversity of needs.

HIA helps to encourage a longer-term focus, rather than short-term, and fosters
interagency collaboration and inclusion. The aim is to deliver evidence-based
recommendations to inform the decision-making process.

2.2 The determinants of health
Health and well-being are not determined solely by the health sector. In fact, these
‘curative’ services are the tail-end of a long chain that includes education,
employment, poverty and inequality, all of which affect both health and well-being.
Individual lifestyle factors (such as, whether or not people smoke; consume adequate
amounts of fruit and vegetables; or are physically active) are just one part of a
continuum of influences on public health and well-being, with the environment in
which people live and the services they have access to, as well as broader social and
economic factors, all having a crucial effect. Individual choices are fundamentally
determined by the wider environment in which the individual exists.

Broad social and economic environments make a major contribution to well-being
(National Health Committee, 1998). These broad environments include type of
governance, employment rates, general economic conditions and social support
structures. It can be difficult to determine the impact of each determinant as they are
inter-related and occur simultaneously. However it is already well understood that the
transport system impacts on many of the determinants including social
connectedness, physical activity and personal safety. Traffic speed and density have
a direct impact.

2.3 Why are we using the HIA tool?
There is growing international understanding that traditional land-use and transport
planning has led to motorised transport dependence and unhealthy, unsustainable
cities (Barton and Grant, 2008). The changing global context, including climate
change, oil price fluctuations and inactive related diseases, has major implications for
human well-being and, in particular, for how we think about transport.

At a strategic level, there is an increasing recognition that the transport sector must
contribute to environmental, health and social objectives; however European and

Central Dunedin Speed Restriction HIA Report   12
North American commentators note that existing planning tools are not designed for
the new agenda and that changes in the technical aspects of the process are lagging
changes in the planning goals. New tools and processes are therefore required to
produce a more radical change in transportation planning: tools and processes that
put people and not cars at the centre of the planning process. HIA is one of those
tools.

2.4 How are we using the HIA tool?
Many of the HIAs undertaken in NZ have focussed on transportation. In a global
context, transport related HIAs have mostly been initiated and funded by the health
sector rather than the transport sector. In the case of the Central Dunedin Speed
Restriction HIA Report the initiative was that of DCC City Planning and
Transportation Departments with funding from the Ministry of Health ‘Learning by
Doing’ Fund and in-kind funding from both the DCC and PHS.

There are clear links between transport practices and the determinants of health. A
review of the literature on HIAs (NZTA Research Report 375) suggests that input
from public health experts at an early planning stage, before a draft policy or project
plan is available, may be the best way to ensure that potential effects on health and
well-being are considered. The DCC is doing just that as evidence from the HIA will
inform the DCC’s nascent CCS.

Central Dunedin Speed Restriction HIA Report   13
3. Background
Dunedin is the second largest settlement in the South Island of NZ and the city
centre has high traffic flows, both vehicular and pedestrian. Dunedin’s traffic crash
injury is at a significant level being 554.5 per 100,000 as opposed to the national
rate of 352 per 100,000 (Ministry of Social Development, 2009).This rate of injury
falls disproportionately across the population affecting cyclists, pedestrians and the
elderly more as a group.
The DCC's decision to carry out an HIA was a direct result of funding being made
available by the Ministry of Health; an awareness of HIA through staff trainings; and a
renewed level of interest by DCC in the future of the central city area based on
feedback received through Community Plan submissions. The general condition of
the city centre is serviceable but there is increasing evidence that paving is beginning
to wear out in heavily trafficked areas and it cannot be cost effectively patched up in
the longer term without impacting further on amenity.
Although a programme of work had yet to be confirmed, ongoing internal discussions
in DCC recognised the influence of traffic and parking on pedestrian circulation and
ambience in the central city area. It was also recognised that there was a need to
improve the level of consultation with the community and provide more robust
support for DCC's decision making in the public arena.
HIA was of particular interest to DCC for the following reasons:
To trial HIA methodology as an analytical tool for supporting revitalisation
projects generally.
Identifying wider potential health benefits of any changes beyond accident
reductions.
Understanding the impact of changes on particularly vulnerable groups within
the community.
Creating opportunities to engage with and establish good relations with key
stakeholders before any broader programme of work was considered.
Applying lessons learned from the findings of this HIA to other parts of
Dunedin.
The DCC decided to apply for HIA funding and was successful in qualifying for a
funding on the condition it worked closely with PHS.
Central Dunedin Speed Restriction HIA Report 144. Community profile In order to progress with the HIA it was necessary to profile the community that used/lived in the central city area, i.e. the zone under consideration. The following is a summary of the community profile. The complete version of the community profile can be found in Appendix 2. Tertiary students make up nearly 20% of the Dunedin community and nearly 80% of all Dunedin 20 to 24 year olds are tertiary students. The city has a smaller proportion of children than NZ overall but an inflated rate of young adults. Like the national population, Dunedin’s population is ageing – a trend that is set to continue (Monitoring Population, August 2002). The city has a relatively static population although the University has had significant growth with tertiary student enrolments in Dunedin nearly doubling over the last twenty years. Travel to work data from the 2006 census shows that the total number of people working in the zone is just over 10,000. Active travel modes, such as passenger transport, cycling and walking, are used by approximately 2,271 people (Census, 2006). Of these, walkers form the largest group, totaling 1,332. The city centre still retains a ‘main street’ format, with the main street in this case being George Street. George Street forms a central spine along which shops and businesses are located, with overflow onto neighbouring streets. The zone (figure 1) includes retail premises, offices, other workplaces, restaurants, bars and cafés and some residential and commercial accommodation properties. It also includes public facilities (such as the library and Community House which houses offices of a range of not-for-profit organisations) and entertainment destinations (both for adults and teenagers). There are a sizeable number of dental surgeries, accountants and lawyers firms. The University is located to the north of this area, resulting in large numbers of students traversing the area. The location of schools means several schools sit just outside the boundaries of the area with a combined total of 1800 school students either in the area or in the immediate vicinity. There are three main shopping malls which can be accessed from George Street. Dunedin Hospital, Dunedin Police headquarters and St John Ambulance headquarters are located within the zone. Traffic is able to move in both directions along George Street and neighbouring streets. There is some on street parking along George Street and surrounding areas, including free short term parking e.g. P5 parks, disabled parks, taxi stands, motor cycle parks, bus stops loading bays and paid parking administered through Pay and Display meters. Of those who work in the zone around 7,000 drive to work. It is unlikely that all of these drivers park within the study area – it is expected that parking is distributed through the study area in off-street car parks, and in the surrounding area both on and off street. The area is used by a large number of vehicles on a daily basis, these comprise of: those vehicles in transit through the area; public buses with many bus stops located Central Dunedin Speed Restriction HIA Report 15
in the area; taxis; couriers; delivery vans; and vehicles whose occupants wish to park
in the area for shopping, visiting the library etc; bicycle users also cycle through the
area for the reasons listed above.

There is significant foot traffic in George Street and the central city area, including
workers, University students, school students, shoppers an tourists. These
pedestrians are travelling to and from work and school or to visit facilities such as the
library, bank, retail stores or restaurants/cafes. At night-time pedestrians are likely to
visit bars, restaurant, cinemas and theatres. Some are using the central city area as
a route to another destination. The central city area is the drop off point for tourists
from the cruise ships – these ships arrive with a regular frequency throughout the
year and deposit a large number of tourists within the city centre.

Assessment of 30km speed limit in George and Princes St
The conflict between large numbers of pedestrians and vehicular traffic meant that in
2005, DCC implemented some changes designed to improve safety for pedestrians
and reduce delays to passenger transport that were being caused by vehicles waiting
to turn into side roads. A 30km/hr zone was introduced along Princes and George
Street, the only accompanying physical changes were adjusting signal phases
conducive to 30km speed, and installing 30 km signs to indicate the change in speed
limit. In addition, turning bans were introduced at several intersections, to improve
the flow of traffic along George Street It is worth noting that George Street had some
pre-existing traffic calming, whilst Princes Street did not.

Four years after the speed limit change there has been:
       - a 30% reduction in all crashes
       - a 50% reduction in serious and fatal crashes
       - a 35% reduction in injury crashes
       - and, an overall reduction in speed of ~ 2km has been achieved.

An analysis of traffic volumes and speeds was carried out using data collected from
the study area in March 2010. The speed profile below shows the results for George
Street (between Hanover Street and St. Andrew Street intersections).

Direction         Time               Max (km/h)      Mean          85th%    >30km/h
                                                     (km/h)        (km/h)   (%)
Northbound        8am-5pm            56              26            32       24
                  5pm-8am            66              31            38       58
                  All day            66              28            35       38
Southbound        8am-5pm            55              26            32       22
                  5pm-8am            65              30            37       51
                  All day            65              28            34       34

                                         Figure 2. Speed profile

Central Dunedin Speed Restriction HIA Report       16
It is evident from this table is that the average speed during the daytime in both
directions is 26km/h. During the day, on average 23% are travelling faster than
30km/h – the percentage exceeding the speed limit is quite significant.
During the night (5pm – 8am), the average speed is slightly higher than during the
day, at 30 km/h. The percentage of vehicles exceeding the speed limit is again
significant being 58% of all northbound and 51% or all southbound traffic.
Figure 3 illustrates the percentage of vehicles exceeding the speed limit according to
the time of day, and whether it is a weekday or weekend. The number of vehicles
travelling faster than 30km/h peaks at around 5am, and then steadily declines to
around 15% between 12pm and 4pm.
Hanover to St Andrew ‐ NBD
100
Percent exceeeding 30km/h
90
80
70
60
50
40
30
20
10
0
0000
0100
0200
0300
0400
0500
0600
0700
0800
0900
1000
1100
1200
1300
1400
1500
1600
1700
1800
1900
2000
2100
2200
2300
Weekday Weekend
Figure 3. Percentage of vehicles exceeding speed limit
A similar pattern was observed at other sites on George Street. However, different
results were obtained from Princes Street (Moray Place to Dowling Street section),
where it was found that during the day 62% of vehicles travelling in a northbound
direction were exceeding the speed limit, as were 39% of those travelling
southbound. Vehicles are clearly travelling faster along this section of road.
Central Dunedin Speed Restriction HIA Report 17Figure 4 shows a much flatter profile than the previous graph for George Street –
although this was only observed for vehicles travelling northbound – the southbound
pattern was more similar to George Street. The graph illustrates that vehicles
consistently travel at speeds faster than 30km/h regardless of time of day, with the
lowest level of speeding experienced on weekdays at 8am, and the highest
percentage of drivers speeding on weekdays at 1am.
Moray Pl to Dowling St ‐ NBD
120
Percent exceeeding 30km/h
100
80
60
40
20
0
0000
0100
0200
0300
0400
0500
0600
0700
0800
0900
1000
1100
1200
1300
1400
1500
1600
1700
1800
1900
2000
2100
2200
2300
Weekday Weekend
Figure 4. Percentage of vehicles exceeding speed limit - Moray to Dowling St
To some extent the speed of vehicles on George Street appears to be self-regulating,
particularly during the day time. Congestion reduces vehicle speeds as does the
relatively narrow environment with parking available on both sides of the road. The
drop over the lunchtime period could well be linked to increased pedestrian activity at
this time of day. These effects do not seem to be so noticeable on Princes Street.
Central Dunedin Speed Restriction HIA Report 185. Discussion piece on traffic engineering
Previous experience with the implementation of the existing 30km/hr zone in the
central city and evidence from elsewhere suggested that for the 30km/hr reduced
zone to work there would need to be substantial engineering of the area. Simply
putting signs in place would have minimal effect and could invalidate the work put
into producing the HIA.
Reducing speed is known to reduce the injury severity and survivability for vulnerable
users in particular. The most effective way of reducing the traffic speed is by
changing the road environment to reflect the desired speed (in this case 30km),
through kerb build-outs, traffic platforms etc. This would result in traffic naturally
travelling at 30km/hr, and then the area can then be formally made into a 30km
speed limit area (following NZTA setting of speed limits rule), which means that this
speed limit can be enforced by Police.
Senior Transportation Planner for the DCC, Lisa Clifford, contributes the following to
the discussion.
5. 1 Fundamentals of traffic management
Road networks have two functions:
1) As through Routes: To facilitate the movement of people and goods for one
location to another
2) To provide access within the area: To facilitate access to land adjacent to the
roads in the networks (by foot car or bike).
The management of traffic on particular roads depends upon the function of the road
within the network. One of the biggest problems in regards to roading is the lack of
clarity over road hierarchy. For instance, is the primary function of the road to move
traffic through an area or provide access to an area?
The problem stems from the conflict that exists between the movement and access
functions. Vulnerable users especially young pedestrians and cyclists are over-
represented in accidents on such roads (“collectors/distributor roads’). The roads
within the HIA area fit in this category. Methods to change this include:
1) Constraining and changing the behaviour of vulnerable road users
2) Constraining and changing the behaviour of the vehicle drivers
3) Modifying driver behaviour and expectations by adapting the physical
environment.
Traffic management involves pursuing the third option; the other two involve
education and enforcement. Traditional traffic management has generally focused
upon altering the flow rate, whereas traffic calming is aimed primarily at altering the
speed. This supports the idea that signs alone are not as effective at altering speed.
If a road is wide and clear, the tendency is to drive faster. It should be noted that
traffic calming is often seen as more than a road safety improvement measure; it is
often a means of restoring a proper balance between motor vehicles and the
community.
Central Dunedin Speed Restriction HIA Report 196. Screening and scoping
6.1 Screening
A screening meeting was convened in March 2010.
The following people were present:
Steve Miles Principle Urban Designer, City Planning, DCC
Sarah Weller Senior Planner, Transportation Planning, DCC
Emma Lynch Public Health Researcher, PHS
Charlotte Flaherty Travel Co-ordinator, Transportation Operations, DCC
Martin Ward Impact Assessment Specialist.
The group considered a series of questions (listed in Appendix 1) and, on the basis
of the answers, concluded that there was likely to be a range of positive and possibly
some negative impacts on the health and well-being of the population.
It was not clear what level of benefit would be delivered by a reduction to 30km/hr in
the central city area. Hence the group considered that using the HIA tool would better
inform the decision-making process.
6.2 Scoping
A scoping workshop was held in Dunedin on Friday 26 March 2010.
Scoping workshop attendees were as follows:
Anna Johnson City Planning Manager, DCC
Steve Miles Principal Urban Designer, DCC
Sarah Weller Senior Planner, Transportation Planning, DCC
Charlotte Flaherty Travel Co-ordinator, Transportation Operations, DCC
Diana Munster Transportation Operations, DCC
Meryl Donaldson Research and Monitoring Officer, City Planning, DCC
Emma O’Neill HIA Evaluator, DCC
Colin Hillerby Parking Officer, Parking Enforcement, DCC
Emma Lynch Public Health Researcher, PHS
Faola de Montgomery Mental Health Promotion Adviser, PHS
Iain McAuley Principal Adviser/Scientist, Ministry of Transport
Sgt Tania Baron Strategic Traffic Unit, Police
Janice Burton PHS, Invercargill (observing)
Martin Ward Impact Assessment Specialist.
6.3 Scope of the HIA
The scope of the HIA provides information on the following key requirements:
1. Timeframe
2. Aims and objectives of the HIA
3. The determinants of health identified by the project as worthy of increased
focus
4. Those populations identified by the scoping workshop as being most likely to
feel the effects of proposal
Central Dunedin Speed Restriction HIA Report 205. Budget and other resources
These requirements were discussed and decided upon at various meetings leading
up to the scoping workshop.
6.3.1 Timeframe for the HIA process
Feb March April May June
Deliver evaluation time ●
frame
Screening and Scoping March 26●
Scope report ●
Lit research ●
Speed survey ● ●
Community Profile ●
Appraisal 1 ●
Appraisal 2 ●
Draft report ●
Final report ●
Evaluation ●
6.3.2 Aims and objectives of the HIA
Aim
The overall aim of the Central Dunedin Speed Restriction HIA is for the DCC to
complete a quality HIA in partnership with PHS on the proposal to extend the
30km/hr speed zone.
Objectives
To develop capacity in Dunedin for HIA
To lay foundations for more systemic use of HIA-referenced approaches to
transport planning on a routine basis
To identify, by seeking evidence from informed individuals, the positive and
negative impacts of the proposal on selected populations groups
To identify measures to enhance the positive effects and mitigate the negative
effects
To prepare a better proposal using the evidence produced by the HIA process
6.3.3 The identified determinants of health
The scoping workshop reviewed information collected for on the community profile
and the literature review (working document). A key finding was that Dunedin has a
high rate of injury 554.5 per 100,000 as opposed to the national rate of 352 per
100,000. This injury falls disproportionately across the population affecting cyclists,
pedestrians and the elderly more as a group.
At a meeting to discuss the determinants of health in regards to traffic speed, the
discussion brought three key determinants of health to the fore. These were agreed
as:
Central Dunedin Speed Restriction HIA Report 21 How does a 30km/h speed limit reduce the severity and number of crashes?
How does a 30km/h speed limit impact on physical activity?
How does a 30km/h speed limit impact on social capital?
These determinants then became the focus for the literature review, as well as an
overarching questions being:
How does traffic speed impact on health/well-being?
6.3.4 The population groups most affected
The populations determined by the scoping workshop to be most affected by the
proposal were the elderly, youth and visitors to the city centre (tourists, pedestrians,
cyclists). It was also agreed that the pedestrian population was the population of
most interest to the HIA, as they can be used both as a measure of the economic
health and vitality of the central city area and as a “canary in the coal mine”.
The community profile highlighted that the city centre was an area frequented by
many residents: many of the key activity areas for the elderly and youth are located
in the city centre (hospital, library, night-time recreational facilities, retail activity
areas). The profile also described an area where tourists were dropped off en masse
from cruise ships.
The selection of the population groups was validated at the appraisal workshop stage
when representatives of the groups detailed their experiences in the city centre.
6.3.5 Budget
The budget the steering team submitted to the Ministry of Health ‘Learning by Doing’
funding application was used as a framework for the budget.
Six sources of income/support/resources were identified for the HIA, the first five are
Ministry of Health, DCC (being City Planning, Transportation Planning and
Transportation Operations) and PHS. The sixth source of support was the Ministry of
Transport. Iain McCauley from the Ministry was on the steering group of Applying
HIA to Land Transport Planning, attended the scoping workshop and peer reviewed
the literature review.
Additional funding was provided by the Transportation Planning Department at the
DCC for the traffic measurements and analysis.
Time diaries were kept in order to measure contributions. City Planning created a
spreadsheet for measuring the HIA work.
Central Dunedin Speed Restriction HIA Report 227. Summary of literature review
Traffic speed greatly influences the health and well-being of individuals and
communities. This literature summary does not attempt to address all the potential
influences, but highlights those which consistently arise within the literature. Both
national and international experiences of speed reductions were drawn upon, and
where possible 30km/h speed zones were evaluated.
7.1 How does traffic speed influence health and well-being?
The major areas of health and well-being influenced by traffic speed include:
Severity and number of crashes
Physical activity
Social capital i.e. participation in community activities and public affairs (the
above three bullet points above are comprehensively discussed in 7.2, 7.3, and
7.4).
Physical, mental and emotional well-being
o Based on the findings of other 30km/h zones, there would be little or no
effect on travel time.
o Literature supports the view that after an initial period of exposure and
education the majority of users (including drivers) are supportive of the
decrease in speed.
o The benefits to pedestrian well-being are substantial, with a decrease in
traffic speed increasing pedestrian perceptions of safety.
o Traffic speeds over 30 km/h have been shown to restrict children’s freedom
(e.g. by being driven to school) and are predicted to have an effect on the
child’s physical health, mental development, autonomy and impinge on their
ability to navigate unfamiliar environments later in life (Huttenmoser, 1995;
Whitzman, 2007; Plowden, 1996). It is suggested that children’s emotional
and intellectual development accelerates in more walk-able and mixed use
communities Hertzman, 2002; Gilbert & O’Brien, 2005). This is probably due
to a combination of increased opportunities for physical activity,
independence and community cohesion.
Economic Development
o From a retail perspective, reduction and/ or the removal of traffic has been
found to increase retail turnover.
o At an individual level there are direct health gains if active transport is
adopted, as increased physical activity is a protective factor for many
diseases and therefore ensures economic productivity i.e. low number of
sick days, ability to hold down a job. Indirect economic health gains include,
decrease costs of running a vehicle, less noise and air pollution, and a
reduction in crashes, which has economic cost in regards to injury and
sickness. However, it is problematic to quantify such economic health gains
due to the various scales of traffic calming measures.
Environment
o Air and noise pollution generated from traffic is a significant health concern.
Air pollution
o Delepierre (2008) argues that lowering the speed limit reduces air pollution
in two ways, firstly by decreasing the number of cars on the road, and
secondly by resulting in calmer driving patterns due to engineering methods
(i.e. replacing traffic lights with roundabouts).
Central Dunedin Speed Restriction HIA Report 23o The New Zealand Transport Authority (2007) predicts that there are
approximately 500 premature deaths per year due to vehicle emissions
Other New Zealand research has estimated that the rate of mortality
attributed to vehicle emissions would be 200 premature deaths for adults
over the age of 30 years; this is slightly less than traffic accidents (Fisher et
al., 2002).
o There is limited information on air pollution due to vehicle emissions within
Dunedin’s central city.
Noise pollution
o In Dunedin’s central city the ambient background noise is 60 – 70 dB
(personal communication Dunedin City Council noise control officer). This is
consistent with what would be expected for a 50 km/h speed limit (NPC -
Noise Pollution Clearinghouse, n.d) and is above the sound levels (55-
65 dB) which are seen to lead to serious annoyance (Babisch, 1998).
o Noise emissions may have a large impact on Dunedin residents, as many
people come into the city centre and hence are often exposed.
o Implementing a 30km/h speed limit has been found to reduce transport
noise by 2dB and if combined with other calming measures transport noise
can be reduced by a further 4dB (den Boer & Schroten, 2007).
The literature review focussed on three key determinants; safety, physical activity
and social capital, these were expanded on using three further research questions.
7.2 How does a 30km/h speed limit reduce the severity and number of
crashes?
Speed is the single most important contributor to road fatalities. Reducing the
speed limit has been universally found to reduce the severity and number of
crashes.
Dunedin has the highest national rate of pedestrian’s injuries. In 2008 the injury
rate was 554.5 per 100,000, this far exceeds the national rate of 352 per
100,000 (Ministry of Social Development, 2009).
Within the proposed 30km/h speed zone there were a total of 242 road user
injuries in the 5 year period from 2004-2009 inclusive
Trends include 20 locations with four or more injury crashes within a 30 metre
radius. Distribution by age (in 5 year bands) shows that 15-24 year olds
accounted for 93 or 38% injuries, with 24-34 year olds accounting for 18%
injuries. In terms of time (4 hourly blocks) the peak injury period was between
12 and 4pm where 82 (43%) of injuries occurred. See Attachments 8a, 8b, 8c,
8d.
Literature highlights the disparity experienced amongst our vulnerable
communities when involved in a crash, such as; motorcyclists, then cyclists are
at most of risk of injury or death; child pedestrians followed by elderly are most
likely to be hospitalised; and those between 15 and 17 years are over-
represented in injury and deaths as drivers, passengers and pedestrians.
Ethnicity disparities can be illustrated with Māori and Pacific Islanders being at
a greater risk of motor crashes per kilometre 1 travelled and being twice as likely
to be injured as pedestrians than New Zealand Europeans (Ministry of
Transport, 2009; Land Transport Authority, 2000; Ministry of Transport, 2008).
1
Per kilometre travelled provides an accurate measure of exposure rates, while per population provides an overview
of the public health issue.
Central Dunedin Speed Restriction HIA Report 24 There are also socio-economic disparities, a cohort study with 10,000
participants found that those in the lowest quartile of occupational status were
four times as likely to experience a driver injury compared to those in the
highest quartile, and those with less than two years of secondary school
education were twice as likely to suffer driver injuries compared to those with
tertiary education (Whitlock, et al., 2002).
As the health burden associated with traffic falls unevenly across the
population, those that would be most likely to benefit from a speed reduction
are our vulnerable user groups.
7.3 How does a 30km/h speed limit impact on physical activity?
Physical activity can be improved through active transport modes.
Being physically active provides a great deal of benefits, both to the individual
and the community. In a random sample of Danish women and men, cycling to
work was found to reduce all cause mortality by 40% (Andersen et al., 2000).
There are also economic benefits associated with being physically active
(through active transport). A recent New Zealand review suggested that per
capita benefits range between $2,488 and $3,270 per annum due to a reduction
in morbidity, mortality and loss of Disability Adjusted Life Years (Genter et al.,
2008). This is exclusive of other benefits such as fuel saving and roading costs.
Within Otago walking is the most popular form of physical activity for 70.9% of
people (SPARC, 2008). In 2006, the New Zealand census illustrated that 8.7%
of Dunedin residents travelled to work by walking, 1.5% by bicycling and 65.1%
by private motor vehicle. Walking exceeded the national rate of 5.3% and
cycling and use of private motor vehicle were on a par with the national rates at
(1.9%) and (64.2%) respectively. (Statistics New Zealand, 2007).
Studies predominantly evaluate individual factors in prohibiting active transport
modes.
Studies which do factor in vehicle speed point to a lack of certainty that
lowering speeds will lead to a modal change (Grundy, 2008; Ogilvie, 2004),
whereas hazards associated with the road transport environment have been
consistently and strongly identified as a principal constraint on walking and
cycling. The Netherlands, Germany, Denmark and Japan have achieved
relatively high rates of active transport due to transport strategies which focus
on a range of speed reduction initiatives (Pucher & Beuhler, 2008) and social
endeavours including changing of social norms and lessening the perceived
risk of engaging in active transport (Garrard, 2008; Davies 2010).
A review by Saelens & Handy (2008) of the built environment found that
transport options that slow and spread traffic increase street connectivity, safety
for cyclists and make walking more feasible, safer and more attractive. This
however is not evidence of a causal relationship. While international experience
suggests that there is strong and consistent evidence that traffic hazards
(including vehicle speed) are a major constraint on active transport speed
reduction is not the only change needed to increase safe active transport, but
merely a key component (Saelens & Handy, 2008; Pucher & Beuhler, 2008;
Davies, 2010).
Central Dunedin Speed Restriction HIA Report 257.4 How does a 30km/h speed limit impact on social capital?
Social networks may be based on spatial proximity, for example neighbourhoods, or
on shared interests i.e. sports or cultural groups. Social capital provides contacts,
resources, skills, influence, reassurance, mutual support and is shown to be
associated with good health, low crime, higher educational achievement, economic
growth and other positive benefits (Gray et al., 2006).
Communities highly dependent on the motor vehicle pose mobility barriers for
children, the elderly, those without vehicles, and people with mobility
impairments. Accessible, walkable, safe neighbourhoods with mixed land use,
public transport options, and recreational facilities encourage people with
limited mobility to remain involved in community activities (Younger et al.,
2008).
Research has indicated that when traffic is slowed through traffic calming
measures, there are improvements in quality of life and improved safety and
mobility for pedestrians and cyclists (Appleyard & Lintell, 1972; PHAC, 2003).
The Victorian Transport Policy Institute (2009) conducted a systematic review
of road and traffic conditions and demonstrated that the greater the road size
and traffic speed, the greater the degradation of the non-motorised traffic
environment. The security and attractiveness of walking conditions, including
the quality of footpaths, crossings, minimal volumes and speed of motor vehicle
traffic, and the presence of other pedestrians is of particular importance for
community cohesion.
Furthermore, McDonald (2007) found higher rates of children walking to school
in more cohesive neighborhoods (after controlling for other factors such as
income and land use). This greater level of walking and social interaction in turn
contributes to improved physical and emotional health (Frumkin et al., 2004).
Please refer to Appendix 4 for a full version of the literature summary including
references.
Central Dunedin Speed Restriction HIA Report 268. Appraisal
8.1 Appraisal workshop process
The appraisal workshop was held at the Clifford Skeggs Gallery on Wednesday 5
May 2010.
Attendees heard what an HIA aimed to do. They heard how the 30km/hr zone could
be achieved, a summary of the literature findings and data about crash statistics. It
was also explained that although a section of George Street currently has a speed
restriction of 30km/hr, the zone in questions would have a larger geographical area
and would include more traffic calming measures/ design than the existing speed
signs.
Attendees then broke into their respective groups to discuss the following questions:
Q1. Consider the effects of a speed reduction to 30 km/hr on physical activity?
Positive/ negative
Q2. Consider the effects of a speed reduction to 30 km/hr on community activities
and public affairs? (social capital)
Positive/ negative
Q3. Consider the effects of a speed reduction to 30 km/hr on personal safety?
Positive/ negative
For a complete list of appraisal question and findings, please refer to Appendix 5.
The group discussing “elderly and visitors” had representatives from:
Disability Information Service Grey Power Living Streets
Citibus Transportation Planning DCC PHS
HairRaiser Tours Guided Walks Transportation Operations Age Concern
New Zealand Transport Agency.
The group discussing “youth, pre-schoolers and visitors” had representatives from:
Spokes Dunedin Living Streets University Proctor
Campus Watch York Place Preschool Urban Design
Youth Action Council DCC PHS.
8.2 Extra appraisal meetings
DCC and PHS subsequently contacted those who had been unable to attend the
appraisal workshop and visited them to ascertain their evidence on the proposal.
This included young people, being;
School Students Youth Action Council
Central Dunedin Speed Restriction HIA Report 27You can also read


