Cities and Towns NATIONAL ISSUES REPORT - Ressources naturelles Canada
←
→
Page content transcription
If your browser does not render page correctly, please read the page content below

CHAPTER 2

Cities
and Towns

N AT I O N A L ISS U E S R E P O RT
N AT I O N A L I S S U E S R E P O RT
                                                                         27

Coordinating lead author
Craig Brown, PhD, Vancouver Coastal Health

Lead authors

Ewa Jackson, ICLEI Canada

Deborah Harford, Adaptation to Climate Change Team,
Simon Fraser University

David Bristow, PhD, Civil Engineering, University of Victoria

Contributing authors

Dan Sandink, Institute for Catastrophic Loss Reduction

Heather Dorries, PhD, School of Public Policy and Administration,
Carleton University

Mark Groulx, PhD, School of Environmental Planning, University of
Northern British Columbia

Zainab Moghul, PhD, Environment and Climate Change Canada

Sophie Guilbault, Institute for Catastrophic Loss Reduction

Treaty, Lands and Resources Department - Tsleil-Waututh Nation

Anika Bell, University of Victoria

Recommended citation

Brown, C., Jackson, E., Harford, D. and Bristow, D. (2021): Cities and
Towns; Chapter 2 in Canada in a Changing Climate: National Issues
Report, (ed.) F.J. Warren and N. Lulham; Government of Canada,
Ottawa, Ontario.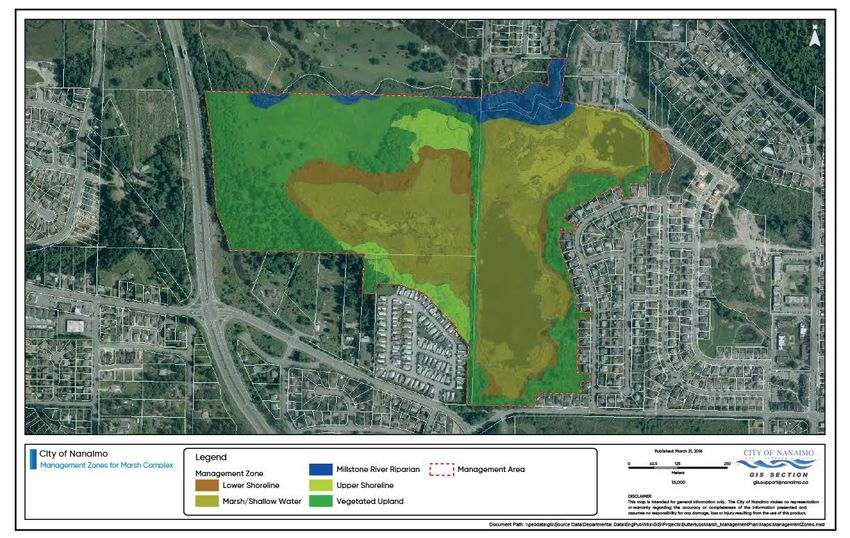
N AT I O N A L I S S U E S R E P O RT
                                                                                                                    28

Table of contents
Key messages                                                                                                 30

2.1 Introduction                                                                                             32

     2.1.1 Cities and towns                                                                                  32

     2.1.2 Climate change impacts in cities and towns                                                        34

2.2 Climate change is threatening Canada’s ageing infrastructure                                             37

     2.2.1 Introduction                                                                                      37

     2.2.2 Approaches and mechanisms to reduce risks                                                         38

     2.2.3 Decision-support tools                                                                            39

     2.2.4 Funding                                                                                           40

     2.2.5 Interdependencies                                                                                 42

     Case Story 2.1: Enhancing infrastructure resilience in Fredericton, NB
     to reduce flood risk                                                                                    43

2.3 Enhancing green spaces helps cities and towns adapt to climate change                                    45

     2.3.1 Introduction                                                                                      45

     2.3.2 Low impact development                                                                            48

     2.3.3 Urban biodiversity                                                                                49

     2.3.4 Urban forests                                                                                     49

     2.3.5 Water supply                                                                                      50

     2.3.6 Multifunctional landscape planning                                                                51

     Case Story 2.2: Piloting natural asset valuation in Nanaimo, BC                                         51

2.4 Climate change will hit those already struggling in cities and towns the hardest                         53

     2.4.1 Impacts on individuals and communities                                                            53

     2.4.2 Social determinants                                                                               54

     2.4.3 Strong social systems                                                                             57

     2.4.4 Increasing equity                                                                                 58

     2.4.5 Place-based adaptation                                                                            59

     Case Story 2.3: Victoria Call to Action: Building resilience through thriving and inclusive communities  59

2.5 Working together yields the most successful outcomes                                                     60

     2.5.1 Introduction                                                                                      60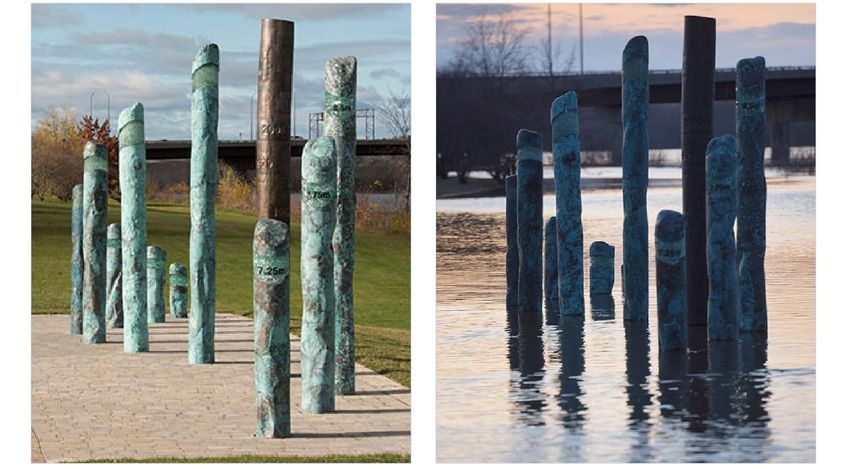
N AT I O N A L I S S U E S R E P O RT
                                                                                                          29

    2.5.2 Co-production                                                                             61

    2.5.3 Municipal governments                                                                     61
    2.5.4 Private and public sectors                                                                62

    2.5.5 Citizens                                                                                  63

    2.5.6 Boundary organizations                                                                    63

    Case Story 2.4: Brampton Lighthouse Project: Supporting vulnerable populations during extreme
    weather events                                                                                  65

2.6 Indigenous peoples in cities and towns are often affected in unique ways by climate change      67

    2.6.1 Introduction                                                                              67

    2.6.2 Climate change impacts for First Nations, Métis and Inuit peoples                         68

    2.6.3 Indigenous Knowledge and climate change                                                   69

    2.6.4 Adaptation and reconciliation                                                             70

    Case Story 2.5: Community climate change resilience planning in the Tsleil-Waututh Nation       70

2.7 Cities and towns are moving from adaptation planning to implementation                          71

    2.7.1 Introduction                                                                              72

    2.7.2 Barriers to adaptation                                                                    72

    2.7.3 Advancing adaptation implementation                                                       74

    Case Story 2.6: Adaptation measures and co-benefits through the upgrading of Rue Saint-Maurice
    in Trois-Rivières, QC                                                                           78

2.8 Monitoring and evaluation of adaptation is an important and often overlooked step               80

    2.8.1 Introduction                                                                              80

    2.8.2 Progress and approaches                                                                   80

    Case Story 2.7: Tracking progress on adaptation through the City of Surrey’s Sustainability
    Dashboard82

2.9 Moving forward                                                                                  83

    2.9.1 Knowledge gaps and research needs                                                         83

    2.9.2 Emerging issues                                                                           83

2.10 Conclusion                                                                                     85

2.11 References                                                                                     86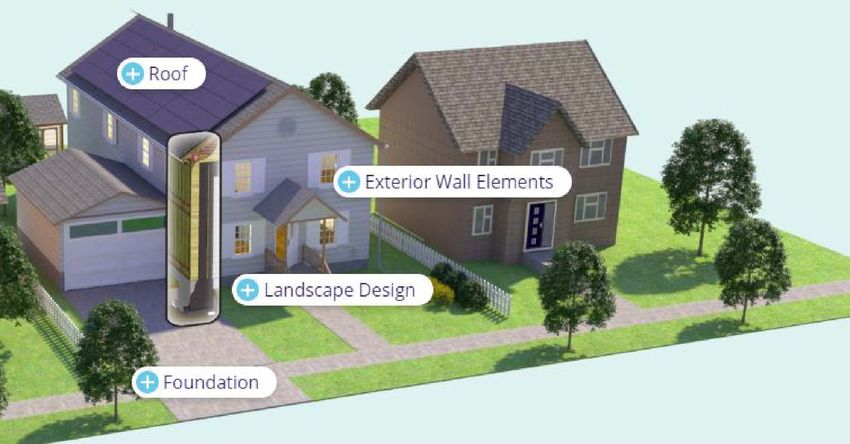
N AT I O N A L I S S U E S R E P O RT
                                                                                                                    30

Key messages

Climate change is threatening Canada’s ageing infrastructure
(see Section 2.2)
Safe and reliable infrastructure and resilient buildings are essential to life in cities and towns. The projected
changes in climate will increase risk for Canada’s ageing infrastructure, causing structural damage,
compromising system reliability and threatening health and safety. Integrating climate change information
into the design, operation and management of infrastructure projects will help minimize risk.

Enhancing green spaces helps cities and towns adapt to climate
change (see Section 2.3)
Green infrastructure, such as parks, wetlands and green roofs, in Canada’s cities and towns increase the
quality of life for residents and improve climate resilience. Recognizing the value of the benefits associated
with green infrastructure and nature-based adaptation solutions will be useful in advancing their use to
reduce impacts from climate change and other stressors.

Climate change will hit those already struggling in cities and towns
the hardest (see Section 2.4)
Climate change will impact individual and community health and well-being in cities and towns. However,
the negative impacts from climate change will not affect all members of society equally. Considering social
equity in adaptation decisions will help reduce the vulnerability of those at highest risk and will ensure that
benefits are distributed fairly.

Working together yields the most successful outcomes (see Section 2.5)
Effective adaptation approaches to climate change consider diverse perspectives and priorities. Local
governments are increasingly playing a strong role in driving meaningful collaboration with different groups
when it comes to designing, planning and implementing adaptation in their communities.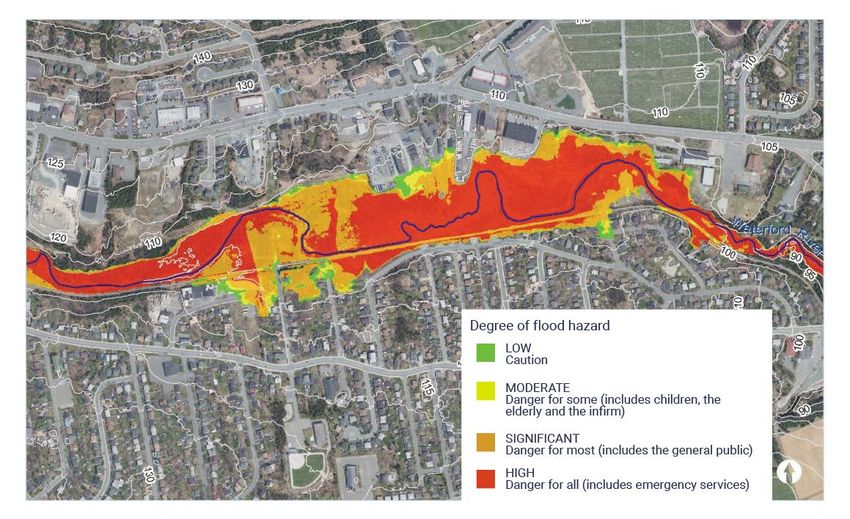
N AT I O N A L I S S U E S R E P O RT
                                                                                                                   31

Indigenous peoples in cities and towns are often affected in unique
ways by climate change (see Section 2.6)
Canada’s cities and towns are home to large populations of Indigenous peoples, who are often affected
in unique ways by a changing climate. Attention is being given to Indigenous issues, and the inclusion of
Indigenous perspectives and expertise in municipal adaptation planning processes is occurring, but this is
not widespread. Strengthening collaboration with Indigenous peoples will require increased capacity and
additional research.

Cities and towns are moving from adaptation planning to
implementation (see Section 2.7)
Implementation of adaptation initiatives by cities and towns is not keeping pace with the risks posed by
current weather extremes and future climate changes. However, examples of implementation are becoming
more common, and the barriers to action are being reduced. Promising practices like mainstreaming and
innovative funding arrangements offer opportunities to scale up and accelerate implementation.

Monitoring and evaluation of adaptation is an important and often
overlooked step (see Section 2.8)
Monitoring and evaluation methods are required to track adaptation progress, and measure whether
adaptation efforts are resulting in their desired outcomes. While promising approaches exist, monitoring and
evaluation of adaptation projects and outcomes are still rare, and there is value in helping cities and towns to
develop approaches that are effective and comprehensive.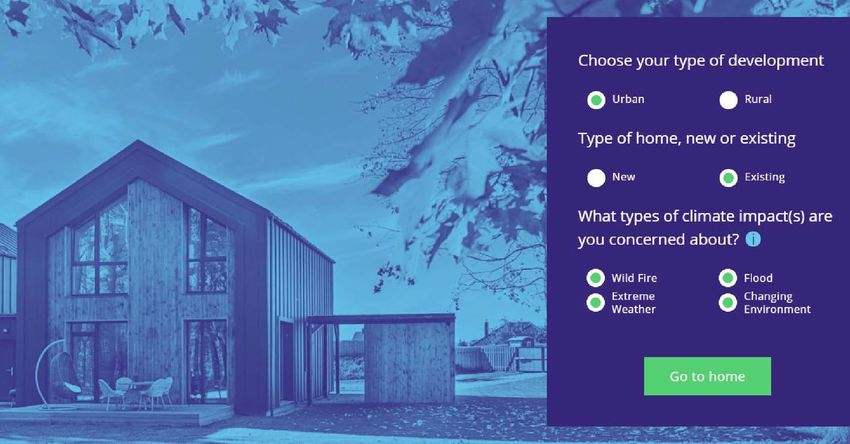
N AT I O N A L I S S U E S R E P O RT
                                                                                                                32

2.1 Introduction

2.1.1 Cities and towns

Over 80% of Canadians live in urban areas (see Box 2.1; Statistics Canada, 2017a), and more than half (51.8%)
of Canada’s Indigenous population lives in a metropolitan area of at least 30,000 people (Statistics Canada,
2017b). Our cities and towns help drive the national economy, and provide resources and opportunities that
contribute to individual and community health and well-being. Although cities and towns have many attributes
that increase their adaptive capacity (Natural Resources Canada, 2016); concentrated populations, exposure
of economically-valuable assets, ageing infrastructure, degraded ecosystems and social inequality can make
urban areas and their residents highly vulnerable to climate change (see Figure 2.1; Maxwell et al., 2018).

   Figure 2.1: Assets and challenges that influence adaptive capacity in cities and towns.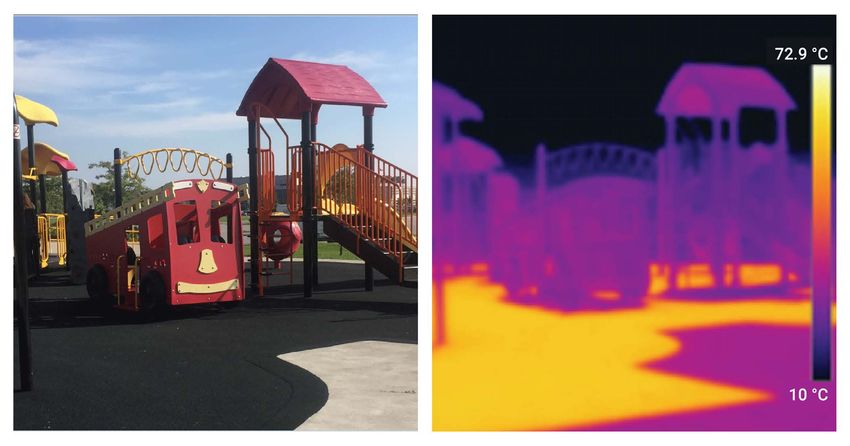
N AT I O N A L I S S U E S R E P O RT
                                                                                                                   33

Changes in Canada’s climate are already evident and projected to continue. For example, parts of the country
have experienced higher temperatures, more extreme heat, less extreme cold, shorter snow and ice cover
seasons, earlier spring peak streamflow, and rising sea level (Bush and Lemmen, 2019). In addition, increased
precipitation is projected for most of Canada, on average, although summer rainfall may decrease in some
areas. More intense rainfalls will increase urban flood risks, while in coastal regions, sea-level rise and more
extreme high-water events will increase the risk of coastal flooding in some communities (Bush and Lemmen,
2019). These changes will result in greater impacts on cities in the future, unless appropriate adaptation and
risk management are implemented (see Table 2.1).

Managing climate risks is essential, and can provide a range of direct and indirect economic, individual,
social and environmental benefits. Cities and towns can also adapt to take advantage of opportunities that a
changing climate will bring, such as decreased heating demand in buildings (Amec Foster Wheeler and Credit
Valley Conservation, 2017). Reducing net greenhouse gas emissions (mitigation) is essential to managing
future risks (Bush and Lemmen, 2019), although a discussion of mitigation efforts is largely outside of the
scope of this report, which focuses on climate change impacts and adaptation.

Population growth, urbanization, densification and increased resource consumption in the coming decades
will amplify the sensitivity of cities and towns to climate-sensitive hazards (Webb et al., 2018). For example,
the population in Ontario’s Greater Golden Horseshoe is expected to grow by 50%, reaching 13.5 million
people by 2041 (Government of Ontario, 2017), and that of Metro Vancouver is expected to increase by
25% to 3.2 million people over the same time period (Metro Vancouver, 2014, 2018). This population growth
will mean higher exposure to impacts (as more people would be affected), along with greater demand on
critical systems like energy, water and health care. The composition of Canada’s population can also affect
vulnerability; for instance, newcomers to Canada and the elderly can have higher vulnerability to extreme
weather events (Chang et al., 2015).

This chapter assesses climate change impacts and adaptation in cities and towns across Canada and
acknowledges that each location experiences and adapts to climate change differently (Hunt and Watkiss,
2011). This chapter references Canadian and international literature, and includes case stories that provide
practical examples of adaptation in action. The content has been structured using key messages that reflect
the current state of research and practice on issues of priority to cities and towns. The volume in which
this chapter appears is part of a suite of complementary products that are contributions to the national
assessment process Canada in a Changing Climate: Advancing our Knowledge for Action.

Box 2.1: Urban areas

Although the term “urban area” is often used interchangeably with cities and towns, Statistics Canada has
replaced the term “urban area” with “population centre” and uses the following discrete categories: small
(populations between 1,000 and 29,999), medium (populations between 30,000 and 99,999), and large
(populations of 100,000 or more) (Statistics Canada, 2017e). As in previous assessments (e.g., Palko
and Lemmen, 2016), this chapter focuses primarily on medium and large population centres, with some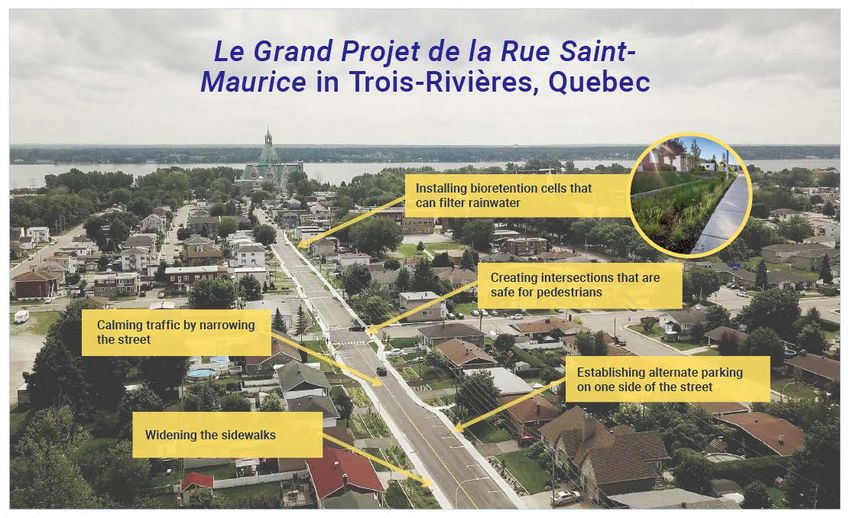
N AT I O N A L I S S U E S R E P O RT
                                                                                                                    34

consideration of small centres that have more than 10,000 people. It is estimated that 500 of Canada’s 3,650
cities and towns have populations over 10,000. For discussion on climate change impacts and adaptation in
communities smaller than 10,000 people, see the Rural and Remote Communities chapter.

2.1.2 Climate change impacts in cities and towns

As the global mean temperature continues to increase, cities and towns across Canada will experience
warmer temperatures, shifting precipitation patterns (e.g., less snow and more rain, sustained periods of
drought), increased frequency and intensity of some extreme weather events, and—for most coastal cities—
sea-level rise (Bush and Lemmen, 2019). Under all emissions scenarios of the Intergovernmental Panel on
Climate Change (IPCC), these changes will result in an increased incidence of acute and chronic biophysical
impacts, including more frequent and intense heat events (see Figure 2.2), increased incidences of poor air
quality (e.g., from ground-level ozone, particulate matter), short-duration, high-intensity rainfall events, wind
storms, wildland-urban interface fires, increased coastal erosion, storm surge flooding and decreased water
quality (Bush and Lemmen, 2019; Field, 2018; BC Ministry of Environment and Climate Change Strategy, 2017;
Government of Canada, 2016; Gasper et al., 2011). These biophysical impacts will affect built infrastructure,
natural environments, individuals and communities (see Table 2.1). Such impacts are accentuated in
developed areas because many impact-reducing natural surfaces have been replaced by water-shedding,
heat-absorbing and re-radiating surfaces, and the population density is higher (Seto and Shepherd, 2009;
Venema and Temmer, 2017). Many of the high costs associated with these impacts (see Costs and Benefits
of Climate Change Impacts and Adaptation chapter) will be borne by local governments.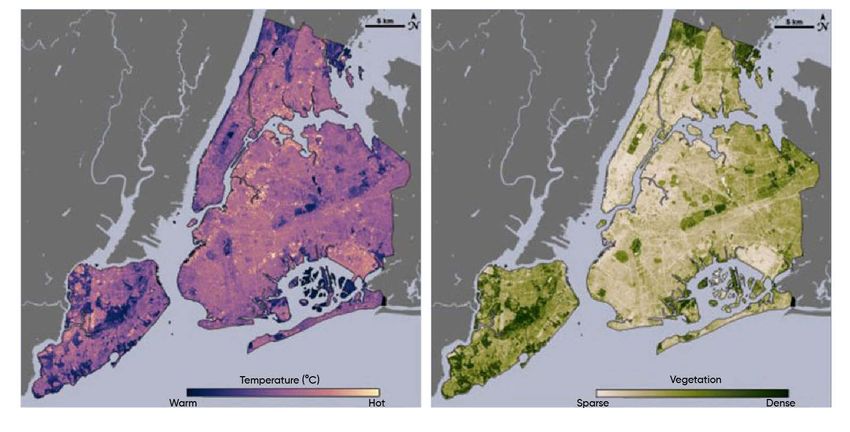
N AT I O N A L I S S U E S R E P O RT
                                                                                                                    35

Table 2.1: Common climate change impacts facing cities and towns

      CATEGORY                                         COMMON CLIMATE CHANGE IMPACTS

                                     •    Damage to infrastructure and buildings from storms
                                     •    Increased cooling demand and decreased heating demand in
                                          buildings
     Infrastructure
                                     •    Potential increase in disruption to and failure of electrical systems
     and buildings
                                          from heat and storms
                                     •    Increased winter maintenance costs and higher public safety risks
                                     •    Damage to coastal infrastructure due to sea-level rise

                                     •    Shifts in distributions of plant and animal species, including
                                          beneficial and invasive species

       Natural                       •    Degradation of urban ecosystems and those in the outskirts
       systems                       •    Increase in environmental pollution (e.g., rainfall events transporting
                                          contaminants into waterways)
                                     •    Saltwater intrusion into water supply aquifers

                                     •    Increased social inequity
                                     •    Business disruptions
    Individuals and
                                     •    Mental and physical health impacts
     communities
                                     •    Loss of cultural landmarks, heritage and traditional practices
                                     •    Changes to recreation and tourism opportunities

 Sources: Abbott and Chapman, 2018; Cedeño Laurent et al., 2018; Field, 2018; Diamond Head Consulting
 Inc., 2017a; Public Health Agency of Canada, 2017; Government of Canada, 2016; Giordano et al., 2014;
 Revi et al., 2014; Solecki and Marcotullio, 2013; Gasper et al., 2011.
N AT I O N A L I S S U E S R E P O RT
36
Figure 2.2: The annual number of extreme heat days projected for six Canadian cities under three warming
scenarios: global mean surface temperature of 1.5°C, 2°C, and 4°C above pre-industrial levels. The values are
based on statistically downscaled simulations by 24 climate models participating in CMIP5, with the error bars
representing the 25th and 75th percentiles, and the grey section showing the number of historical extreme heat
days (1986–2005). The threshold for extreme heat differs by city (e.g., Toronto = 31°C, Vancouver = 29°C). Data
source: Environment and Climate Change Canada.N AT I O N A L I S S U E S R E P O RT
37
2.2 Climate change is threatening Canada’s
ageing infrastructure
Safe and reliable infrastructure and resilient buildings are essential to life in cities and towns. The
projected changes in climate will increase risk for Canada’s ageing infrastructure, causing structural
damage, compromising system reliability and threatening health and safety. Integrating climate change
information into the design, operation and management of infrastructure projects will help minimize risk.
Historical and recent exposures to weather extremes have shown that urban infrastructure is vulnerable to
these types of events. Climate change will increase the risk of overheated buildings, damaged infrastructure
(e.g., bridges during flooding) and power outages across Canada. Increasing the resiliency of Canada’s
ageing infrastructure is challenging due to factors such as higher levels of use beyond initial design, the large
investments required, and performance under uncertain future climate conditions. In addition, infrastructure
design to date reflects an assumption of a steady-state climate, whereas we now must design for “non-
stationarity” in order to minimize disturbance and damage as the climate continues to change dynamically.
Infrastructure was identified as the top sector at risk to climate impacts, but also has the greatest “adaptation
potential” to avoid and reduce negative consequences, as long as careful planning is undertaken (Council of
Canadian Academies, 2019). The state of research and practice in Canada is advancing, as are the resources
available to cities to towns.
2.2.1 Introduction
The infrastructure in cities and towns includes water systems (e.g., stormwater, wastewater, drinking water),
transportation systems, public and private buildings, sport and recreation facilities, utilities (e.g., electricity
and gas), telecommunications and industrial sites (see Box 2.2 for more details). Nearly two thirds of core
public infrastructure is owned and maintained by municipal governments, and over one third is in need of
retrofit or replacement due to being in a relatively poor condition (Project Steering Committee, 2016). Rising
temperatures, changing hydrological conditions and more frequent extreme weather events will increase
the risk of failure and make it more difficult to deliver optimal levels of service across the entire lifespan of
existing and new infrastructure assets (Asset Management BC, 2018; Amec Foster Wheeler and Credit Valley
Conservation, 2017).N AT I O N A L I S S U E S R E P O RT
38
Box 2.2: Infrastructure
The term “infrastructure” can mean many different things. Public Safety Canada provides a list of ten sectors
that are termed critical infrastructure: health, food, finance, water, information and communication technology
(ICT), safety, energy and utilities, manufacturing, government, and transportation (of all types―ground, air and
water) (Public Safety Canada, 2020). The emphasis of this chapter is on the physical assets that underpin the
functioning of these and other sectors within cities and towns, including buildings. Much of the infrastructure
in population centres is publicly owned, such as roads, water mains and public buildings. Other infrastructure,
such as most buildings, and ICT, natural gas and power distribution can be privately owned (in some cases
depending on the regulatory structure). Infrastructure assets are dependent on other assets and services
from other infrastructure. The term “interdependent” is used to describe cases where assets or systems are
dependent on each other.
2.2.2 Approaches and mechanisms to reduce risks
The Climate-Safe Infrastructure Working Group—a panel of scientists, registered engineers and architects
in California—defines climate-safe infrastructure as “infrastructure that is sustainable, adaptive and that
meets design criteria that aim for resilience in the face of shocks and stresses caused by the current and
future climate” (Climate-Safe Infrastructure Working Group, 2018, p. 5). Although this goal is conceptually
straightforward, there are many challenges in achieving it (e.g., Climate-Safe Infrastructure Working Group,
2018; Amec Foster Wheeler and Credit Valley Conservation, 2017). As the field of climate change adaptation
matures, approaches are emerging to assist infrastructure designers and operators as they modify their
planning and design approaches. The Infrastructure and Buildings Working Group—a multi-stakeholder
working group under Canada’s Climate Change Adaptation Platform—outlines the key areas that must be
addressed, several of which are presented below:
• Development of guidelines, codes, standards and specifications that take into consideration the
expected climate change impacts;
• Development of critical infrastructure inventories, including the evaluation of vulnerabilities and
identification of priority at-risk areas, based on the projected impact of climate change;
• Identification of high-risk areas based on recent events (e.g., new flood zone mapping);
• Completion of risk assessments and cost benefit analyses of alternatives to support decision-
making on priority adaptation actions; and
• Integration of planning and decision-making between departments within an organization or
between stakeholders (Amec Foster Wheeler and Credit Valley Conservation, 2017).N AT I O N A L I S S U E S R E P O RT
39
Although it is difficult to precisely track progress in each of these areas, there is evidence of advances. For
example, asset management is a relatively widespread practice that seeks to inventory and manage existing
and new infrastructure across municipal corporations, in a way that maximizes benefits and reduces risks,
while reflecting the context and priorities of the community (Federation of Canadian Municipalities, 2018).
Over the last few years, the asset management community has been encouraged to incorporate climate
change into its practices (Asset Management BC, 2018). While the inclusion of climate change is not yet well
established, it involves considering how a range of potential climate impacts may affect levels of service, and
building these considerations into asset management activities (see Case Story 2.1; Federation of Canadian
Municipalities, 2018). This process can also be used to manage natural assets (e.g., wetlands), although this
practice is still very new (Municipal Natural Assets Initiative, 2017). Incorporating climate change into asset
management represents a significant opportunity to accelerate adaptation through mainstreaming, and to
pursue low-carbon options during infrastructure renewal (Adaptation to Climate Change Team, 2019).
Codes, standards and guidelines are essential drivers of climate-safe infrastructure that are largely
determined by various levels of government (Amec Foster Wheeler and Credit Valley Conservation, 2017).
For example, in Quebec, standard BNQ 3019-190 provides information, guidelines and recommendations
to improve the thermal performance of parking areas (e.g., reduced surface area, increased greenspace,
permeable pavement) with the goal of reducing the urban heat island effect (Bureau de normalisation du
Québec, 2013). The Borough of Rosemont–La Petite-Patrie, Quebec, has used this standard to require that
“paving material in all new parking, loading and storage areas must meet a minimum solar reflectivity index
rating of 29” (Government of Canada, 2011, p. 2). The Standards Council of Canada (2019) is also advancing
work in this area , including a new national guideline on basement flood protection (Canadian Standards
Association, 2018) and support for a Canadian standard for flood-resilient communities (Moudrak and
Feltmate, 2019). Additional information on buildings is provided in Box 2.3.
2.2.3 Decision-support tools
Despite promising examples, designing for an increasingly non-stationary climate remains a challenge with
evolving solutions. Designers are encouraged to incorporate flexibility to allow for uncertainty (Field, 2018;
Milly et al., 2008), and to use safe-to-fail approaches that minimize consequences instead of the probability
of failure (Climate-Safe Infrastructure Working Group, 2018). Traditionally, infrastructure parameters and
thresholds have relied on historical weather data (Amec Foster Wheeler and Credit Valley Conservation,
2017). Given the long lifespans of most infrastructure, future climate projections will be needed to
establish parameters and thresholds for infrastructure. Intensity Duration Frequency (IDF) curves relate
rainfall intensity with its duration and frequency of occurrence, and are often used to inform infrastructure
decisions. Tools such as the IDF CC Tool 4.0 (Simonovic et al., 2018) can be used to develop IDF curves
based on historical data, as well as under future climate conditions, thereby helping to incorporate climate
considerations into infrastructure decisions. For instance, IDF curves were used in a study of Saskatoon
residential retention ponds under future climate scenarios (Elshorbagy et al., 2018).N AT I O N A L I S S U E S R E P O RT
40
The Climate Lens from Infrastructure Canada represents an effort to embed the consideration of climate
risk in professional practice. It requires analysis of climate change resilience during the planning and design
phases of a project, as a prerequisite to funding for projects over $10 million, and also requires consideration
of how the emissions from all projects will be managed and minimized (Infrastructure Canada, 2019). The
guide contains a collection of supporting resources, including regional climate resources, engineering data
sets (e.g., IDF files), provincial and territorial flood maps, risk assessment methodologies, previous federal
assessment reports, and adaptation resources (Infrastructure Canada, 2019).
Professional associations across Canada are increasingly providing voluntary training to their members on
the planning and management of climate-safe infrastructure. For example, Engineers and Geoscientists
British Columbia has an extensive climate change information portal that aims to support its members as
they incorporate climate risk management into their practices (Engineers and Geoscientists British Columbia,
2020). Similarly, the Canadian Society of Landscape Architects has produced a set of adaptation primers to
guide its members’ practice (Canadian Society of Landscape Architects, 2018), and the Canadian Institute
of Planners has a climate change portal with resources to inform planning and design for climate change
adaptation, and a new policy for climate change planning that guides professional practice (Canadian
Institute of Planners, 2018).
In addition to these decision-support tools, there is also an expanding body of examples and design
strategies in the following areas: storm and sanitary sewer design (Moudrak and Feltmate, 2017; Crowe,
2014), transportation infrastructure (Temmer and Venema, 2018; Simonovic et al., 2016; Dennis Consultants,
2008), energy distribution (Gomez and Anjos, 2017; AECOM and Risk Sciences International, 2015; Boggess
et al., 2014), water systems (United States Environmental Protection Agency, 2014; Loftus, 2011), and
information and communications technology (Kwasinski, 2016).
2.2.4 Funding
Although there are many barriers relating to financing of climate-safe infrastructure in Canada’s cities and
towns (Amec Foster Wheeler and Credit Valley Conservation, 2017), there are innovative paths forward that
are currently available to infrastructure owners and operators. These include incentive-based tools such as
local improvement charges (LICs), density for benefit agreements, development costs charges and natural
area tax exemptions (Zerbe, 2019; Adaptation to Climate Change Team, 2015). Funding options have also
been assessed for natural assets initiatives (Cairns et al., 2019), and municipalities have received funding for
adaptation through federally funded programs, such as the Municipalities for Climate Innovation Program
(delivered by the Federation of Canadian Municipalities) and the Natural Disaster Mitigation Program
(delivered by Public Safety Canada). However, most of these funding opportunities are time-bound, and the
amount of funding available generally falls short in comparison to the scale of adaptation responses that are
needed. Since public funding sources represent only one quarter of capital expenditures in Canada, it will also
be essential to mobilize private investment from businesses, homeowners and public-private partnerships in
order to implement adequate infrastructure adaptation (Adaptation to Climate Change Team, 2015).N AT I O N A L I S S U E S R E P O RT
41
Box 2.3: Buildings
In the past five years, there has been an increased effort to design for climate resilience at the building level
(e.g., BC Housing, 2019). For each building type, there are a number of structural and operational adaptation
options available depending on the hazard faced (see Figure 2.3). These include general guidance for
designers and operators (e.g., BOMA Canada, 2019; Kesik and O’Brien, 2017; City of Toronto, 2016) and also
certification systems like BOMA BEST 3.0 (BOMA Canada, 2020) for existing buildings, and the pilot credits
in the RELi project rating system for new buildings (Pierce, 2017). There are also a number of pilot projects.
For example, the City of Windsor, Ontario, retrofitted a 100-year-old home in the city’s core to reduce the risk
of flooding by using a variety of property-level flood protection measures, including a backwater valve, sump
pump with overflow, and regrading (City of Windsor, 2019).
Enhancing climate resilience through building codes is another approach being used in cities and towns.
Many local jurisdictions in Canada have adopted measures to reduce disaster risk through building design,
despite limited authority to regulate construction beyond provincial code requirements (City of Barrie, 2017;
Town of Wasaga Beach, 2015; City of Cambridge, 2011). For example, most municipalities in Alberta and
major cities in Ontario such as Toronto, Ottawa, Windsor, Mississauga and Hamilton have adopted building
code interpretations that have resulted in the installation of sewer backflow protection in most new homes
to reduce sewer backup risk (Sandink, 2013a). In the City of Victoriaville, QC, the voluntary, incentive-based
Habitation Durable [sustainable housing] program includes disaster risk reduction measures, such as
improved roof-to-wall connections to reduce wind risk and measures to decrease heat-health risks. Seven
additional municipalities in the province of Quebec have adopted Habitation Durable (City of Victoriaville,
2018). Halifax enforces a vertical setback for residential ground floors of all new buildings along its coastline
to accommodate sea-level rise, based on predictions and modelling out to the year 2100 (Halifax Regional
Municipality, 2014).
For many building-level adaptation measures, there are associated co-benefits. For example, passive solar
design in buildings can help maintain comfort, including during power outages, while reducing heating and
cooling loads (e.g., via optimized shading). Similarly, foliage and green roofs reduce urban heat, while also
retaining stormwater and decreasing cooling demand. These and other building-level resilience measures
deliver co-benefits relating to livability and property values as well (Urban Land Institute, 2015).N AT I O N A L I S S U E S R E P O RT
42
Figure 2.3: A series of screenshots from the website www.climateresilienthome.ca, developed by the City of
Edmonton and Ask for a Better World. This interactive tool provides information about modifications for making
new and existing homes more climate resilient.
2.2.5 Interdependencies
Creating climate-safe infrastructure requires an operationalized understanding of the interconnected and
interdependent nature of urban infrastructure, where interdependency refers to a relationship between
two or more infrastructure systems (e.g., electricity distribution and water treatment) (see Figure 2.4;
Zimmerman and Faris, 2010). Interdependencies can be physical, cyber-based, geographic or operational
in nature (C40 Cities and AECOM, 2017), and can lead to cascading impacts across infrastructure systems,
involving multiple infrastructure owners (Asset Management BC, 2018). Identifying interdependencies isN AT I O N A L I S S U E S R E P O RT
43
increasingly considered to be a first step in reducing climate risk (C40 Cities and AECOM, 2017). Pilot projects
related to specific assets, including the General Hospital in Nanaimo, BC, are being initiated to explore how
interdependencies translate into climate risks (Cross Dependency Initiative, 2019).
Discussions about interdependencies and cascading impacts often highlight the centrality of electricity to
urban life. As Figure 2.4 shows, when the electricity supply is disrupted, many negative impacts occur across
other infrastructure systems—as well as in natural and social systems (C40 Cities and AECOM, 2017). For
example, high-rise buildings may experience disruptions in essential services like water supply and elevator
service, and may lose their ability to maintain safe thermal conditions during power outages (Kesik et al.,
2019). Buildings tend to be highly interdependent, in that they rely on most other infrastructure types and are
designed with minimal ability to function without these infrastructure elements. Utilities across Canada are striving to
manage the risks to their distribution networks (e.g., BC Hydro, 2019; Canadian Electricity Association, 2019).
Figure 2.4: A graphical representation of an example of interdependencies between infrastructure systems.
Source: Adapted from C40 Cities and AECOM, 2017.
Case Story 2.1: Enhancing infrastructure resilience in Fredericton, NB
to reduce flood risk
Located on the Saint John River, the City of Fredericton is the capital of New Brunswick and is home to nearly
60,000 people. The primary climate risk for Fredericton is spring flooding of the Saint John River—a hazard so
prominent that a public art piece was commissioned to contextualize the height of floodwaters (see Figure 2.5).N AT I O N A L I S S U E S R E P O RT
44
Fredericton experienced back-to-back spring floods in 2018 and 2019, both lasting for over a week. For each
flood, a significant portion of the arterial transportation network was disrupted, and commuters struggled to
travel from one side of the river to the other for work, hospital visits and other activities that are often taken
for granted. During this time, the City encouraged using active transportation, free transit, park-and-ride
options and telecommuting to ensure business continuity, as well as altering the flow of traffic on the major
bridge to permit improved access to and from downtown. Business continuity is one way that City staff have
framed adaptation efforts, accepting that eliminating flood risk is not possible.
Persistent flood risk has resulted in over two decades of efforts to ensure that the City’s infrastructure is
more resilient. Fredericton has relied on a commitment to asset management planning and a long-term vision
to guide this work. This has led to changes, such as culverts that are sized 20% above a 1:100 return period;
the use of active transportation (e.g., cycling); and rail-corridor trails that have been used as sites for water
mains to increase redundancy, and also to act as alternative transportation routes when flooding disrupts
vehicle traffic. The City has relied on diverse funding mechanisms to complete this work and will receive
support from the National Disaster Mitigation Program to make Fredericton more resilient.
Figure 2.5: Gerald Beaulieu’s public art installation “Watermark”, consisting of a series of 11 wooden posts
of different heights along a riverside walking path in Fredericton, NB. The tallest post—the “memory pole”—is
encased in copper sheets that mark the year and peak water level of the Saint John River during the annual
freshet. This project is a great example of municipal Public Works collaborating with the Culture Office. Photos
courtesy of the City of Fredericton.N AT I O N A L I S S U E S R E P O RT
45
2.3 Enhancing green spaces helps cities and
towns adapt to climate change
Green infrastructure, such as parks, wetlands and green roofs, in Canada’s cities and towns increase
the quality of life for residents and improve climate resilience. Recognizing the value of the benefits
associated with green infrastructure and nature-based adaptation solutions will be useful in advancing
their use to reduce impacts from climate change and other stressors.
The natural environment influences quality of life in Canada’s cities and towns, and supports food and water
security, as well as providing significant benefits in terms of air quality, water filtration and biodiversity. The
ability of green infrastructure to increase resilience to climate change is well understood. Green infrastructure
is beginning to be used more widely in Canada’s cities and towns, as are innovative approaches to design
and governance relating to the natural environment. As the climate changes, protecting and enhancing green
infrastructure (see Figure 2.6) will contribute to its resilience and its ability to continue to provide ecosystem
services and co-benefits. This requires integration with complementary planning processes (e.g., built
infrastructure decisions), as well as consideration of other factors relating to land-use planning and development.
2.3.1 Introduction
Cities and towns incorporate natural systems that include waterways, coastlines, wetlands, urban forests,
parks, and remnant ecosystems, as well as built assets such as green roofs, bioswales and rain gardens
(see Figure 2.6). These natural and engineered assets provide valuable goods and services that can increase
adaptive capacity (see Ecosystem Services chapter; Frantzeskaki et al., 2019; Adaptation to Climate Change
Team, 2017; Kabisch et al., 2017; Terton, 2017) and are often flexible, cost-effective, and broadly applicable in
reducing the impacts of climate change (Emilsson and Sang, 2017). Green infrastructure can reduce impacts
associated with extreme heat, drought, flooding and sea-level rise, while delivering multiple co-benefits (see
Table 2.2). For example, there is increasing understanding of the effects that green infrastructure can have
on heat and air pollution at the site, neighbourhood and city levels (Zupancic et al., 2015). However, the ability
to provide these benefits is threatened by rapid urban growth and development, destructive land and water
use practices, and the temperature and precipitation changes and extreme events associated with climate
change (The Nature Conservancy, 2018; Emilsson and Sang, 2017; Terton, 2017).N AT I O N A L I S S U E S R E P O RT
46
Figure 2.6: Definition of green infrastructure. Source: Adapted from Brooke et. al, 2017.
There is an increasing amount of guidance available for those seeking to use green infrastructure for
adaptation (e.g., see Case Story 2.2; Terton, 2017). Vulnerability and risk assessment tools also exist. For
example, the PIEVC (Public Infrastructure Engineering Vulnerability Committee) protocol was applied to three
parks in Mississauga to assess their vulnerability to twelve climate parameters (e.g., flooding, freeze-thaw
cycles, drought and air quality). A number of risks were identified that could be managed by construction,
operations and management, and/or additional research (Risk Sciences International, 2018).N AT I O N A L I S S U E S R E P O RT
47
Table 2.2: Co-benefits of green infrastructure
CATEGORY CO-BENEFITS
• Improved air quality
• Improved water availability and quality
• Increased habitat and connectivity for biodiversity
Environmental
• Reduced urban temperatures
• Erosion prevention
• Carbon sequestration and reduced emissions
• Opportunities for recreation and physical activity
• Improved mental health
• Increased social cohesion (e.g., parks, community gardens, beaches)
Social • Potential for urban agriculture and local food security
• Reduced mortality
• Educational opportunities
• Spiritual value and sense of place
• Cost effectiveness compared to grey infrastructure
• Flood protection
• Reduced energy consumption in buildings
• Reduced energy required for pumps, etc.
Economic
• Pollution removal
• Improved power transformer capacity and electrical transmission
efficiency
• Increased property values and property tax revenue
Sources: Arsenijevich, 2018; EPCCARR, 2018; Kabisch et al., 2017; Terton, 2017; Berry, 2016; McDonald
et al., 2016; Sörensen et al., 2016; AECOM and Risk Sciences International, 2015; Kardan et al., 2015;
Alexander and McDonald, 2014; ARUP, 2014; Beatley and Newman, 2013; Summers et al., 2012; Foster et
al., 2011.N AT I O N A L I S S U E S R E P O RT
48
2.3.2 Low impact development
Low impact development (LID) aims to return the hydrology of a site as closely as possible to its pre-
development conditions (Ahiablame et al., 2013) and is widely recognized as an important strategy for
stormwater management in urban areas (Berry, 2016; Dagenais et al., 2014). Examples of LID include green
roofs, permeable pavement, rain gardens, bioswales, infiltration planters, vegetated swales, flow-through
planters, drywells and retention ponds. These natural assets retain and filter a portion of stormwater, help
to recharge water supplies, avoid costly upgrades to hard infrastructure, provide habitat and recreation
opportunities, and are viewed as vital components of municipal infrastructure systems (see Figure 2.7;
Kabisch et al., 2017,). For example, in Washington State’s Puget Sound, there is an initiative to install
12,000 rain gardens, which would defer 160 million gallons of water from entering the stormwater system
(Stewardship Partners and Washington State University Extension, 2019). Planning is underway for a similar
project in North Vancouver (Pacific Water Research Centre, 2020). The City of Niagara Falls now offers a
rebate program that will cover 50% of the cost of one rain barrel for its residents (City of Niagara Falls, 2019).
Regulatory approaches have also been effective at increasing LID. For example, Toronto’s Green Roof bylaw
requires developments with a roof space larger than 2,000 square meters to have green roofs. The City
estimates that these green roofing initiatives have alleviated over 9 million litres of stormwater from their
drainage systems and mitigated 120 tonnes of greenhouse gas emissions by reducing annual energy usage
by 1,000 megawatt hours (Guilbault et al., 2016). LID has been embraced variably, but generally favourably
across Canada (Ishaq et al., 2019). Current concerns about LID include lifecycle operational and maintenance
requirements, including considerations of maintenance processes and costs, and the impact of freezing rain
and winter rain events on the efficiency and survival of roof gardens.
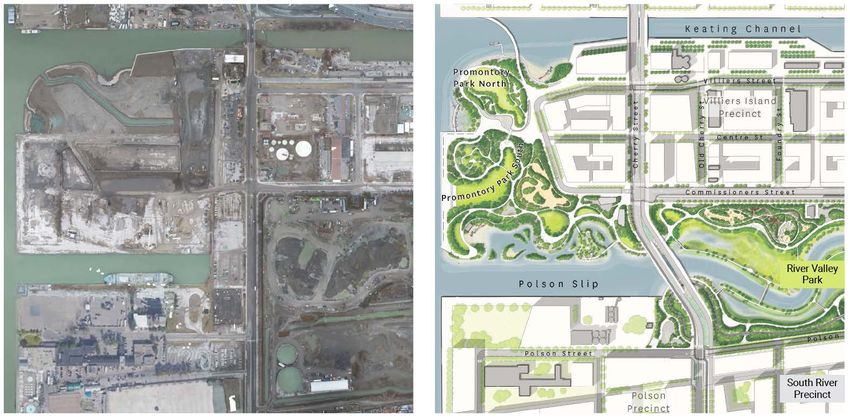
Figure 2.7: Photos of existing conditions at the often-flooded mouth of the Don River in Toronto, ON, and a
rendering of a design to better accommodate floodwaters while improving amenities. Source: Waterfront
Toronto, 2020.N AT I O N A L I S S U E S R E P O RT
49
2.3.3 Urban biodiversity
The protection of urban biodiversity (i.e., the variety of life in the urban context) is a priority for many
Canadian cities. Tools exist to support cities and towns in urban biodiversity planning (e.g., ICLEI
Canada, 2014) and in creating urban biodiversity strategies (e.g., City of Vancouver, 2016); these tools
can help address issues such as the arrival of invasive species, which is increasingly likely to occur in a
changing climate (Smith et al., 2012). Efforts to preserve green space and biodiversity outside of a city
can complement initiatives occurring within municipal boundaries (e.g., Parks Canada, 2014). However,
coordinating transboundary and trans-sectoral planning for ecosystem connectivity is becoming increasingly
urgent in the face of habitat loss and climate change. Some degree of connectivity is important for the health
and survival of almost all species, and local and regional approaches to green infrastructure are likely to
provide larger-scale benefits for flood and heat reduction (Satzewich and Straker, 2019).
2.3.4 Urban forests
Urban forests are useful in retaining stormwater, improving air quality, and reducing urban heat (see
Figure 2.8). To maintain these benefits, it is essential that municipalities manage urban forests in ways
that ensure their adaptability to climate change (Diamond Head Consulting Inc., 2017b; Brandt et al., 2017;
McDonald et al., 2016). For example, the City of Kitchener is preparing its urban forest for more winter
ice storms (City of Kitchener, 2019). For many cities, increasing heat and drought mean that cities need
to actively plan to introduce tree species that will not only reduce various climate risks, but will also be
resilient themselves to changing climate conditions (Brandt et al., 2016). Cities and towns across Canada
are acknowledging this dimension of climate risk, and are developing a deeper understanding of the climate
vulnerability of trees (e.g., City of Montréal, 2017). Cities and towns are also prioritizing the health of their
urban forests. For example, the urban forest in Kingston, Ontario, provides $1.87 million in environmental
benefits annually, and is being actively managed via the city’s Urban Forest Management Plan and Drought
Protection Strategy (Guilbault et al., 2016). In some neighbourhoods—particularly in dense cities like Montréal
and Toronto—the cost of tree planting for particulate matter (PM) reduction is as low as US$840/ton, and
rivals commonly used strategies to reduce PM (e.g., point source control) (McDonald et al., 2016). Similarly,
the shade provided by trees reduces temperature in the area, with associated reductions in cooling costs
(McDonald et al., 2016).N AT I O N A L I S S U E S R E P O RT
50
Figure 2.8: A graphical representation of the correlation between urban trees and temperature. Source: NASA
Earth Observatory, 2006.
2.3.5 Water supply
Water is an essential resource for cities and towns, and degraded water quality is commonly identified as a
potential impact of a changing climate (see Water Resources chapter). The provision of clean drinking water
is contingent on supply, treatment and delivery, with supply being the primary climate-related challenge.
Local governments have always managed variability in supply; however, this occurred within the context of
relatively predictable climatic variability (de Loe and Plummer, 2010). The causes of water shortages vary
depending on the hydrology within a given region, and vary widely across Canada (de Loe and Plummer,
2010). For example, in rainfall-dominated regions, a water shortage is often caused by decreased summer
precipitation, while in snowmelt-dominated regions, earlier or more rapid snowmelt, or a reduced snowpack
could be the cause (BC Ministry of Environment and Climate Change Strategy, 2019). Additional factors, such
as stormwater management decisions that impact groundwater recharge, also affect municipal drinking
water supply and quality (Amec Foster Wheeler and Credit Valley Conservation, 2017).
There have been some assessments of the resilience of water supply treatment and distribution
infrastructure. For example, an assessment of Calgary’s water supply system found that the system was
generally resilient due to robust treatment processes, two raw water sources, and redundancy within the
distribution system (Associated Engineering, 2011). Tools also exist to guide the planning process. These
often point to the importance of collaborative governance when managing watersheds (e.g., POLIS Project onN AT I O N A L I S S U E S R E P O RT
51
Ecological Governance and Centre for Indigneous Environmental Resources, 2019), including the inclusion of
Indigenous Knowledge Systems (Porten et al., 2016). An example of this type of governance can be seen in
the Cowichan Valley Regional District (CVRD) water use planning process that involved the CVRD, Cowichan
Tribes, the Cowichan Watershed Board and Catalyst Paper (Cowichan Valley Regional District, 2018). This
process was created in response to significant pressure being placed on the drinking water supply system by
factors relating to water demand, land use and a shifting hydrological cycle from climate change (Compass
Resource Management Ltd., 2018).
2.3.6 Multifunctional landscape planning
Multifunctional landscape planning offers an emerging alternative to urban development frameworks that
utilize built infrastructure, such as buildings, streets or districts, as the central organizing element of the
urban fabric (e.g., smart growth and new urbanism). Multifunctional landscapes are explicitly designed to
provide synergistic functions (e.g., environmental, social, economic and cultural) that support ecological
health and co-benefits at and across the site, neighbourhood, city and regional scales (Kabisch et al.,
2017; Sörensen et al., 2016). Ecosystem services are reintroduced or reinforced within the urban fabric by
coordinating development around “spatially and functionally integrated systems and networks of protected
landscapes” that may be supported with additional complementary built infrastructure (Ahern et al., 2014,
p. 255). The approach suggests a greater need for involvement of landscape architects throughout the
planning and design process (Canadian Society of Landscape Architects, n.d.; Lovell and Johnston, 2009).
Although effective applications of multifunctional landscape approaches are still limited in an urban
context (Meerow and Newell, 2017; Lovell and Taylor, 2013), Toronto’s Don Mouth Naturalization and Port
Lands Flood Protection project, with its series of proposed terrestrial, wetland and aquatic ecosystems,
illustrates a multifunctional space in which ecological function is restored to the benefit of human health,
recreation, restoration and built asset protection (see Figure 2.7). Since green infrastructure measures often
require significant space that developers and others may desire, it is important to take climate change into
consideration when contemplating urban growth (Geneletti and Zardo, 2016).
Case Story 2.2: Piloting natural asset valuation in Nanaimo, BC
Cities and towns face the dual challenges of upgrading ageing infrastructure and increasing the resilience of
their natural environment. The Municipal Natural Assets Initiative (MNAI) aims to address these challenges
by helping municipalities identify, value and account for natural assets in their financial planning and asset
management programs (O’Neil and Cairns, 2017), and to consider future climate conditions (Municipal
Natural Assets Initiative, 2017). By identifying natural assets―such as wetlands, forests and parks―cities
and towns can work to protect them, and can rely on ecosystem services to reduce the load on conventional
infrastructure, like underground drainage.N AT I O N A L I S S U E S R E P O RT
52
Guided by the MNAI, the City of Nanaimo, BC, sought to assign a financial value to its natural assets, using
the Buttertubs Marsh Conservation Area (BMCA) as part of a pilot study. When the opportunity came to
participate in the MNAI, the City had just completed a Management Plan update with the Nature Trust of
British Columbia and Ducks Unlimited for the BMCA. There was interest in exploring how the City could work
more effectively to help implement the conservation plan, while also recognizing its value in mitigating the
flows of the Millstone River. The BMCA comprises 55 hectares of reclaimed wetland and floodplain within
Nanaimo (see Figure 2.9; Molnar et al., 2018). The project found that the BMCA helps moderate the rivers
downstream during extreme precipitation events, and therefore reduces flood risk in the floodplain. Building
an engineered system that could do what the BMCA does naturally would cost the City between $6.6 and $8.5
million, a figure that would rise with more extreme events. The results of this pilot study will guide the City in
identifying other key natural assets to be recognized and integrated into the City’s infrastructure (Molnar et
al., 2018). Water levels throughout the BMCA have been tracked for the last two years in an ongoing effort to
monitor and evaluate the project.
Figure 2.9: The Buttertubs Marsh Conservation Area, which comprises 55 hectares of reclaimed wetland and
floodplain, appears in the center (the "management area") of this aerial photo of Nanaimo, BC. Source: City of
Nanaimo.N AT I O N A L I S S U E S R E P O RT
53
2.4 Climate change will hit those already
struggling in cities and towns the hardest
Climate change will impact individual and community health and well-being in cities and towns. However,
the negative impacts from climate change will not affect all members of society equally. Considering
social equity in adaptation decisions will help reduce the vulnerability of those at highest risk and will
ensure that benefits are distributed fairly.
Many of the impacts of climate change on health and well-being—especially those relating to individual physical
health—are increasingly well understood (see Health of Canadians in a Changing Climate Report). Adapting to
these impacts requires continued collaborations across sectors and consideration of the many non-climate
factors that influence health. Understanding and addressing the vulnerability of various urban populations
to climate change is essential for increasing both individual adaptive capacity and the overall resilience of
urban communities. It continues to be an important area of practice to establish practical linkages between
community development, social resilience interventions, initiatives that increase equity, reconciliation and
climate change adaptation.
2.4.1 Impacts on individuals and communities
There is strong understanding of the impacts that climate change has on the physical health of individuals
(see Table 2.2; EPCCARR, 2018; Berry et al., 2014). This understanding is becoming more nuanced and is
beginning to include mental health impacts, such as despair and anxiety, as well as post-traumatic stress
disorders for those affected by, and responding to, extreme events (Decent and Feltmate, 2018; Gifford and
Gifford, 2016). Negative impacts can also result from individuals and communities experiencing grief or loss
regarding some aspect of their surroundings that has been altered by climate change (e.g., the loss of cedar
trees on Vancouver Island) (Cunsolo and Ellis, 2018). Framing climate adaptation as a public health issue is
likely to garner public support for adaptation (Araos et al., 2017; Cheng and Berry, 2013) and is increasingly
commonplace in adaptation practice in Canada’s cities and towns. Climate change is also affecting the
delivery of services by health agencies across Canada (e.g., disease surveillance, air quality monitoring and
emergency preparedness) (Buse, 2018).
Negative impacts of extreme weather events and climate change on cultural practices include the loss of
landmarks and a reduced ability to engage in recreational and cultural activities, such as bird watching, using
public playgrounds and harvesting traditional foods (see Figure 2.10; Government of Canada, 2016; Ford,
2012). In Ottawa, for example, Canada Day festivities have been reduced due to extreme heat (Dunham,
2018), and it is likely that skating on the Rideau Canal will decrease in the future (Spears, 2017).N AT I O N A L I S S U E S R E P O RT
54
Figure 2.10: Thermal imaging of Windsor's Captain John Wilson park shows that the temperature of the dark
rubber mat under the play structure (yellow area) is 69.0°C. Photos courtesy of the City of Windsor.
2.4.2 Social determinants
Climate change can exacerbate existing socioeconomic vulnerabilities (EPCCARR, 2018). Social vulnerability
refers to a set of social characteristics (e.g., socioeconomic status, age, ethnicity, housing status) that affect
adaptive capacity and that increase the sensitivity of certain populations to climate impacts (EPCCARR, 2018;
Cutter et al., 2010). Considering socioeconomic vulnerabilities, including their history and dynamics, helps to
ensure that adaptation initiatives do not exacerbate existing inequities and that they are better positioned to
maximize benefits for marginalized groups (Shi et al., 2016). The relationship between social vulnerability and
climate change is often evident during extreme weather events. For example, Superstorm Sandy “exposed the
role that chronic societal stressors—such as poverty, lack of mobility and lack of social cohesion—can play in
both increasing community vulnerability and hindering a region’s ability to recover from a disaster” (Grannis,
2016, p. 1). Some adaptation plans acknowledge the effects that climate-sensitive hazards can have on
homeless populations (e.g., City of Toronto, 2019), and climate change is increasingly being viewed as a risk
multiplier for the affordable housing crisis many cities are facing (Ortiz et al., 2019).
Adaptation planning across Canada often takes into consideration those who are vulnerable, including low-
income and equity-seeking groups (i.e., groups facing an unequal distribution of opportunities and resources)You can also read