MOVING PEOPLE Solutions for a growing Australia - Bus Industry Confederation
←
→
Page content transcription
If your browser does not render page correctly, please read the page content below
MOVING PEOPLE
                > Solutions for a growing Australia

                                                      MOVING PEOPLE > Solutions for a growing Australia
MOVING PEOPLE
> Solutions for a growing Australia
Moving People Solutions for a growing Australia iii

Foreword

This report is a collaborative publication produced
by the three leading groups representing the public
transport industry in Australia (the Australasian Railway
Association, the Bus Industry Confederation and the
International Association of Public Transport–UITP).
It has been jointly authored by John Stanley (Adjunct
Professor, Institute of Transport and Logistics Studies,
University of Sydney) and Simon Barrett (Managing
Director of L.E.K. Consulting, Australia).
The report is targeted at key policy makers in
Commonwealth and State Territory Governments, with
an interest in, or responsibility for, transport policy and
related areas.
iv Moving People Solutions for a growing Australia

Table of contents

  Executive Summary                                                                    1

1. Context                                                                             5

2. National Transport Issues                                                          11
  2.1 Traffic congestion, competitiveness and liveability                             12
  2.2 Climate change (greenhouse gas emissions)                                       16
  2.3 Social inclusion                                                                17
  2.4 Oil prices and energy security                                                  21
  2.5 Safety and health                                                               21
  2.6 Air pollution                                                                   23
   2.7 Growing funding requirement                                                    23
   2.8 Summary of key issues                                                          24

3. A Land Transport Policy for Australia                                              27
   3.1 Integrated approaches for sustainable outcomes                                 28
   3.2 An integrated national land transport policy                                   29
   3.3 The impact of urban structure                                                  38
   3.4 A Package of Measures                                                          40

4. Public Transport Improvement Priorities                                            43
   4.1 Scope                                                                          44
   4.2 The value of urban public transport enhancements                               44
   4.3 Priority urban mass transit initiatives                                        45
   4.4 Network extensions and enhancements                                            50
   4.5 Integrating public transport to a National Moving People Policy                50

5. Federal Involvement                                                                55
   5.1 Why the Federal Government must be involved                                    56
   5.2 National land transport policy structure                                       57
   5.3 Federal and State/Territory roles                                              58
   5.4 Sustainable funding—road pricing reform                                        63
   5.5 Overview                                                                       63

Appendix 1: Meeting Possible Future Climate Change Targets                            66

Appendix 2 : International Examples of Transport Policy and Funding                   68
   Canada                                                                             68
   United States                                                                      70

Appendix 3 : Best practice examples of public transport services and infrastructure   72
   Australia                                                                          72
   International                                                                      72
Moving People Solutions for a growing Australia v

List of figures
Figure 1.1:   Transport and storage gross fixed capital formation as a proportion of GDP (FY1970–2002)                      7
Figure 1.2:   Transport, utilities and communication infrastructure fixed capital formation (FY1960–2008)                   7
Figure 1.3:   Transport infrastructure fixed capital formation (FY1960–2008)                                                8
Figure 1.4:   Growth in Australian road task (FY1975–2007)                                                                  8
Figure 2.1:   Total car passenger kilometres for capital cities (FY1991–2008) (billion passenger kms)                      14
Figure 2.2:   Estimated car passenger kms per capita (FY1990–2008)                                                         14
Figure 2.3:   Public transport use in capital cities (FY1991–2008) (billion passenger kms)                                  15
Figure 2.4:   Rail patronage growth per annum in major international cities (2004–08)                                       15
Figure 2.5:   Vehicle kilometres travelled—United States (1980–2006)                                                       18
Figure 2.6:   Australian Greenhouse Gas Emissions (1990–2006)                                                              18
Figure 2.7:   Australian transport greenhouse gas emission projections (1990–2020F)                                        19
Figure 2.8:   Consumer attitudes to transport emissions                                                                    19
Figure 2.9:   Mode splits for travel to school in Sydney (1971–2003)                                                       25
Figure 2.10: Transport construction real expenditure by entity completing construction (1990–2008)                         25
Figure 3.1:   Developing a basis for national land transport policy                                                        30
Figure 3.2:   Australian capital cities gross population density (2000–08)                                                 31
Figure 3.3:   Activity Intensity and Daily Per Capita GHG Emissions in Sydney and Melbourne                                31
Figure 3.4:   Incremental GHG Intensity of Passenger Transport in Melbourne (2007/8)                                       33
Figure 3.5:   Car occupancy rates (1999–2008)                                                                              33
Figure 3.6:   Average Australian fuel consumption (1998–2007)                                                              35
Figure 3.7:   New Car Emissions Performance Targets (2002–18F)                                                             35
Figure 3.8:   Population density in major cities (2004)                                                                    39
Figure 4.1:   The benefits to society from mass transit and social transit                                                 44
Figure 4.2:   Features and Benefits of an Integrated Transport Plan                                                        51
Figure 5.1:   Aligning national land transport problems with outcome‑driven programs                                       58
Figure A1.1: Projected urban mode shares under alternative 2050 emission scenarios, consistent with an
             80 per cent cut in land transport emissions from 2000.                                                        62
Figure A2.1: Governmental funding of Canadian Urban Public Transport Capital Investment (2001–2007)                        68

List of tables
Table 3.1:    Alignment of measures and their expected benefits                                                            30
Table 3.2     Australian Domestic Freight Task (2002–03)                                                                   34
Table 4.1:    Key state based public transport priorities                                                                  51
Table A.1:    Road transport emission reduction scenarios that achieve an 80% cut below 2000 levels by 2050                62
Moving People Solutions for a growing Australia 1
Executive Summary
National land transport policy v. Increasing mobility opportunities
>> Provision of reasonable base public transport
issues and directions
service levels
Australia’s current land transport systems are not >> Using existing public transport opportunities
sustainable in economic, environmental or social terms. To (e.g. school and community buses) more effectively
substantially improve the sustainability of Australia’s land
transport systems, national land transport policy for at vi. Creating a more sustainable freight network
least the next decade needs to be framed around outcomes: >> Focus on freight movement to ports, hubs and to
connect key manufacturing/distribution centres
a. Congestion management: to manage congestion costs,
improving economic competitiveness and quality of life
in our cities; A seven point national plan
b. Environmental improvement: to achieve substantial These initiatives would be encouraged by the following
cuts in transport greenhouse gas emissions; National Land Transport Seven Point Plan.
c. Social inclusion: to ensure adequate accessibility 1. Increased investment in public transport.
options are available for all Australians (and (see Sections 2.7 and 4)
international visitors); 2. Freight capacity investment and efficiency
d. Health & safety: to make the transport system safe and improvements (see sections 3.2.3 and 3.2.7)
encourage healthier transport choices; and, 3. Road pricing reform, and reallocation of road space
e. Energy security: to increase our energy security by to prioritise low emission modes (see Section 3.2.3, 3.2.7
reducing our reliance on imported fossil fuels. and 5.4)
4. Improved accessibility for all with the establishment
This report focuses primarily on the people elements of the
of Regional Accessibility Planning Councils,
land transport task.
behavioural change programs. (see Sections 3.2.1
The key Policy Objectives that are required to improve the and 3.2.5)
sustainability of our transport systems are:
5. More compact, walking and cycling friendly urban
>> Changing the modal balance for transport away from
settlements. (see Section 3.3)
such a high dependence on motor vehicles;
>> Improving the environmental performance of all 6. Improved fuel efficiency. (see Section 3.2.4)
transport modes but particularly of cars and trucks; and 7. Improvements in transport research and
>> Ensuring that travel opportunities are available to all, information—implementation of a National Transport
irrespective of personal circumstances. Research Program (see Section 5.2)
These three policy objectives can be translated into six
major Program Directions: The public transport role
i. Reducing the demand for travel Australian public transport systems and services must play
>> Land use planning (increased density, co‑location) a larger role in future national land transport solutions,
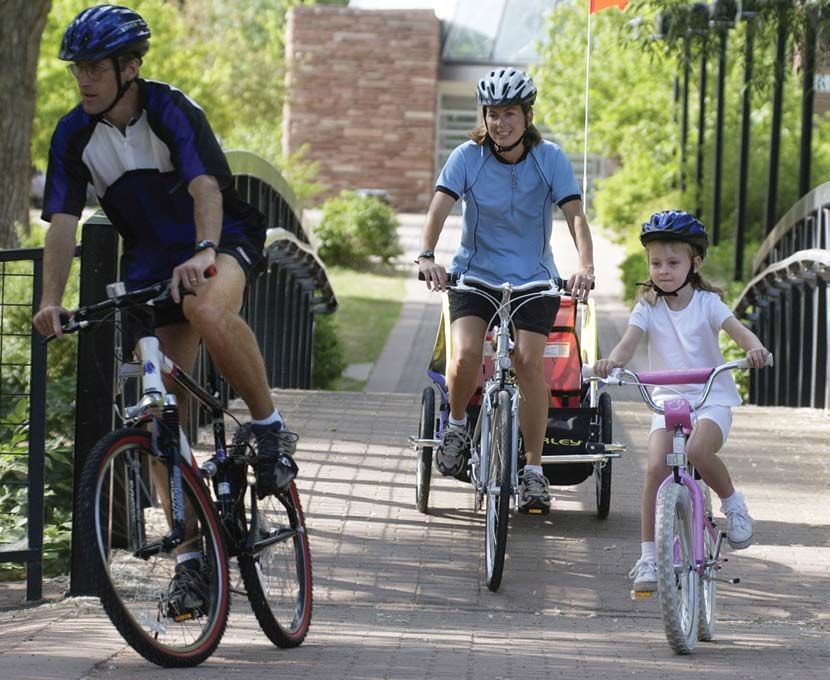
>> Maximising opportunities for walking and cycling as a key means of improving the sustainability of these
systems. Service improvements must be delivered in an
ii. Achieving a shift to lower carbon transport modes efficient manner, to assure value for money to governments
>> Cars to public transport, walking and cycling and the community.
>> Trucks to rail
Public transport system and service development
iii. Improving vehicle utilisation should encompass:
>> Higher car occupancy >> delivering improved customer service;
>> More efficient freight movements >> investing in network extension and service
iv. Reducing vehicle emissions intensity enhancements;
>> More efficient vehicles >> making better use of existing infrastructure;
>> Smaller passenger vehicles >> driving improved land use and transport planning; and,
>> Alternative fuels >> maximising value for money for Government.
>> Intelligent transport systems
>> Better driving practices
2 Moving People Solutions for a growing Australia

The report outlines a range of ways in which Australian          Programming for outcomes
public transport services can be improved to enable the          Federal government involvement in land transport must
sector to enhance the sustainability of Australia’s land         contribute to the resolution of a number of national issues
transport systems. It also identifies ways in which public       that are severely impacted by land transport services/
transport service efficiency can be improved.                    system performance. The following national land
Following the lead now being provided by COAG, Federal           transport program structure is proposed.
and State funding support for the implementation of
substantially improved public transport systems and               National land            > national land transport
services should be dependent upon both the existence of           transport issue            program response

State integrated strategic planning systems, including land
use and transport systems, and also upon the existence            Congestion               > Congestion management
of programs that help to assure efficient service delivery
is achieved. Benchmarking can help to provide this
assurance and should be part of the assessment criteria for
                                                                  Climate change           > Environmental improvement

any funding request to the Federal Government to assist
upgrade public transport systems/services.                        Social exclusion         > National mobility and access

The case for federal funding                                      Safety/health            > Safety and health
The sustainability issues confronting Australia’s land
transport systems are very significant and growing in
                                                                  Energy security          > Energy security
magnitude. They affect all Australians. While the cities
are the areas of greatest concern, regional and rural
areas also confront many of the issues (e.g. the road toll,      The chart indicates the alignment between the critical
greenhouse gas emissions, social exclusion, economic             national land transport issues and the proposed
competitiveness related to infrastructure provision and          outcome‑based response programs. A program
energy security). Because of the scale and geographical          structured along these lines encourages an integrated,
spread of these issues, national policy and program              “modally‑agnostic” approach to the pursuit of solutions to
responses are required for effective solutions. This must,       land transport problems, which is important for achieving
involve the Federal Government showing leadership and            transformational change—as distinct from an approach
working in partnership with others. Some issues require a        that is simply more of the same. Program elements in each
specific Federal policy and program response. The sheer          area would need to include a wide range of measures for
scale of the financial requirement means that state‑based        maximum effectiveness. This would include measures
budgets wil not be sufficient to equip Australia’s cities with   associated with (for example) infrastructure improvement,
adequate transport services.                                     system regulation, and operations management, etc. A
The recently announced Federal provision of over                 clear set of national key performance indicators should
$4 billion towards a number of transformational urban            be developed and monitored, to measure progress against
public transport initiatives under the Building Australia        these critical policy goals.
Fund, on recommendation from Infrastructure Australia,           Because of the long time period that will be required to
demonstrates that the Federal Government recognises the          implement many of the changes (especially those related
importance of transformational change. The December              to developing more compact urban land use patterns),
2009 COAG Communique supports this acceptance.                   long term funding commitments will be fundamental
                                                                 to the achievement of effective outcomes. Rolling five
                                                                 year Federal funding commitments, with provisions
                                                                 to guarantee minimum flows, will be vital to driving
                                                                 transformational change. These should support State/
                                                                 Territory (and local government in some cases) five year
                                                                 plans.
Moving People Solutions for a growing Australia 3

The national interest issues discussed in this report require   Sustainable funding—road pricing reform
transformational change, not simply “more of the same”.         A reformed transport pricing regime should become
The focus for Federal funding support should be on capital      the basis of a sustainable approach to national land
assistance to projects that lead transformational               transport policy.
change and improve the national interest outcomes
identified in this report. In some cases this assistance will   A reformed road pricing system should cover all vehicle
be the majority of the funding required for a particular        classes and all costs attributable to road use. Possible
initiative. In others it will simply be top‑up funding,         options to structure such a charging system include:
to support private sector funding. The top‑up could be          1. a use‑based charge to cover carbon costs (the current
in recognition of identified external benefits from the            Carbon Pollution Reduction Scheme curiously proposes
initiatives in question that the private sector is unable to       offsetting the carbon price for cars by excise offsets for
capture as in some port projects.                                  three years, a system that is at odds with the purpose of
                                                                   emissions trading);
The Federal Government should not involve itself in the
operation of land transport systems that are currently          2. a usage‑based charge to cover the costs of road
State/Territory or local government responsibilities but           construction and maintenance attributable to lighter
should influence the development direction of those                vehicles;
systems in ways that contribute to better outcomes when         3. tonne kilometre charges for the additional road damage
assessed against the national interest issues raised in            attributable to heavy vehicles;
this report. In providing funding support along such            4. a use‑based charge to cover the external cost component
lines, the Federal Government needs to assure itself that          of accident costs;
outcomes represent social value for money and that
                                                                5. use‑based charges to levy vehicles for air pollution
funding recipients do not simply substitute Federal money
                                                                   costs; and,
for State/Territory/local government money. The use of
performance benchmarking, a comprehensive planning              6. a congestion pricing scheme to make users accountable
approach and subsequent performance monitoring can                 for the congestion costs attributable to their road use,
protect against these risks.                                       by time and location.

An important consideration in structuring Federal               Existing fuel excise and registration charges would be
financial support for land transport infrastructure is          abolished and replaced by the above charges. There would
whether to adopt a formula‑based approach to distribution       need to be an Intergovernmental Agreement to implement
of funding allocations (primarily to States and Territories)    such a system, because the incidence and scale of
or to rely on a bid process, where bids are submitted in        revenue flows would differ substantially from the current
accordance with pre‑specified criteria and allocations          arrangements.
are made to those proposals which best meet the
criteria, irrespective of geography. The latter approach
                                                                Overview
characterises the Infrastructure Australia approach. The
former is closer to the basis for current Federal allocations   The national land transport policy framework outlined
of land transport financial assistance (basically road          above, which focuses mainly on people movement, is
funding). An argument for including at least an element         based on:
of formula funding within a Federal financial assistance        >> identification of the critical national land transport
program for land transport is that to do otherwise would           issues that require a national response for
unfairly penalise a jurisdiction that has put in additional        their resolution;
past effort at its own expense and currently has a smaller      >> formulation of a comprehensive, outcome‑driven
backlog than others, simply because of greater effort. It          approach to national policy/program structure;
is proposed that a part of Federal land transport financial
                                                                >> implementation of a set of planning processes that feed
assistance should continue to be formula‑based and part
                                                                   the policy/program structure in an integrated manner;
be based on transport‑plan based project submissions.
                                                                >> concentration of Federal land transport
                                                                   assistance funding in seven categories to promote
                                                                   outcome achievement.
                                                                The proposals should place Australia in a strong position
                                                                to provide a world class 21st century land transport system.
one Context
6 Moving People Solutions for a growing Australia

Context

Effective transport systems are a vital foundation                                  Underinvestment in transport infrastructure was
of competitive economies and of liveable, inclusive                                 observed in Australia as Governments reined in budget
communities. They enable the efficient and safe movement                            deficits, and increasingly looked to the private sector for
of people and goods that is critical to our quality of life.                        investment. Gross Fixed Capital Formation (GFCF) in the
Our roads, public transport, footpaths and cycle ways                               key economic infrastructure sectors (transport and storage;
provide us with opportunities to access family and                                  electricity, gas and water; and telecommunications)
friends, jobs, recreation, education, health care and the                           declined substantially as a proportion of GDP over the
many other activities that contribute to individual and                             four decades from the early 60s. From 6 per cent of GDP
community wellbeing.                                                                at that time, GFCF in economic infrastructure fell to half
                                                                                    this level by the 1990s. (Figure 1.2). A similar trend was
Our transport systems, however, also cause a number of
                                                                                    observed for transportation infrastructure (Figure 1.3).
serious economic, environmental and social problems. For
                                                                                    Over half of the decline in GFCF from the early 60s to late
example, they cause significant congestion in our cities
                                                                                    90s was accounted for by declining investment in the
and are a major source of greenhouse gas emissions, which
                                                                                    transport sector.
are implicated in climate change. Our high dependence
on fossil fuels for transport also poses issues for energy                          Infrastructure spending actually fell or went sideways in
security, given declining domestic oil supplies, rising oil                         the late 80s and through the first half of the 90s. During
prices and concerns over “peak oil”.                                                this period there was a significant national focus on
                                                                                    increasing the efficiency with which existing infrastructure
Countries from Europe to North America, and elsewhere,
                                                                                    was used, with much previously government‑owned
have recognised these pervasive influences of transport
                                                                                    infrastructure shifting to the private sector, as part of
and the importance of a national approach to transport
                                                                                    the National Competition Policy reforms. These reforms
policy, to maximise the potential benefits from an effective
                                                                                    increased market pressures on infrastructure provision and
and efficient transport sector. As a result, in recent years
                                                                                    operation, and delivered important efficiencies in some
transport has typically become a much more significant
                                                                                    sectors, including land transport.
element of national policy agendas. This increasing policy
interest is partly a reflection of inadequate spending on                           While infrastructure investment has risen strongly over
transport infrastructure during the 1970s, 80s and, in some                         recent years, there remains a significant backlog of
cases, the 90s, as transport investment fell as a proportion                        expenditure. Road use has grown strongly over the last
of Gross Domestic Product (GDP) in many countries around                            twenty years, both in terms of freight tonne kilometres
the world.                                                                          and vehicle kilometres. In particular, the growth in freight
                                                                                    movements has been significantly greater than GDP
In an increasingly globalised business world, the impacts
                                                                                    growth. (Figure 1.4). With this continuing increase in
of declining transport infrastructure spending on economic
                                                                                    road use, the relative neglect of transport infrastructure
competitiveness (reflected in growing congestion costs) has
                                                                                    investment is increasingly being reflected in the growing
rung alarm bells in many countries (e.g. the US, Canada,
                                                                                    congestion levels on our urban roads. The public transport
and many European countries).1
                                                                                    equivalent is increasing capacity constraints in the
                                                                                    face of rapidly growing patronage levels, especially on
                                                                                    rail systems.
                                                                                    The Bureau of Transport and Regional Economics has
                                                                                    estimated that road congestion cost Australia $10 billion
                                                                                    annually in 2005, or about one per cent of GDP, and that
                                                                                    this cost will double by 2020.2 Capital city road use by cars
                                                                                    has flattened over the past few years (see Figure 2.1 below),
                                                                                    suggesting that freight traffic growth is currently the major
                                                                                    contributor to increasing congestion. This has implications
                                                                                    for pricing policy reform, discussed in Section 3.2 below.

1   Appendix 2 summarises Canadian and US interest in this area.
2   Bureau of Transport and Regional Economics (2007), Estimating urban traffic and congestion cost trends for Australian cities, Working Paper no. 79, Canberra.
Moving People Solutions for a growing Australia 7
Figure 1.1: Transport and storage gross fixed capital formation as a proportion of GDP (FY1970–2002)
Percent
5
4
3
2
1
0
1970 1972 1974 1976 1978 1980 1982 1984 1986 1988 1990 1992 1994 1996 1998 2000 2002
Australia United Kingdom Germany New Zealand France Netherlands
Note: Australian data is sourced from the ABS while international data is sourced from the OECD
Source: Australian Bureau of Statistics (2002), Australian System of National Accounts, Cat. no. 5204.0,
ABS, Canberra; OECD (2002), Structural Analysis Database
Figure 1.2: Transport, utilities and communication infrastructure fixed capital formation (FY1960–2008)
Billions of dollars Percent of GDP
60 7
6
45
5
4
30
3
2
15
1
0 0
60 62 64 66 68 70 72 74 76 78 80 82 84 86 88 90 92 94 96 98 00 02 04 06 08
Billions of dollars Percent of GDP
Note: Machinery and equipment and non-dwelling construction in the transport and storage, electricity, gas and water supply,
and ommunication services industries, Chain volume measures
Source: Australian Bureau of Statistics (2008), Australian System of National Accounts, Cat. no. 5204.0, ABS, Canberra8 Moving People Solutions for a growing Australia
Figure 1.3: Transport infrastructure fixed capital formation (FY1960–2008)
Billions of dollars Percent of GDP
30 3.5
25 3.0
2.5
20
2.0
15
1.5
10
1.0
5
0.5
0 0.0
60 62 64 66 68 70 72 74 76 78 80 82 84 86 88 90 92 94 96 98 00 02 04 06 08
Billions of dollars Percent of GDP
Note: Machinery and equipment and non-dwelling construction in the transport and storage industries, Chain volume measures
Source: Australian Bureau of Statistics (2008), Australian System of National Accounts, Cat. no. 5204.0, ABS, Canberra.
Figure 1.4: Growth in Australian road task (FY1975–2007)
CAGR%
Index (1975–07)
600
5.6
500
400
300
3.2
2.4
200
100
0
1975 77 79 81 83 85 87 89 91 93 95 97 99 01 03 05 07
Person movement (bkms) Road freight (btkms) GDP $b
Note: *Person road movement (passenger cars and buses) and road freight
Source: Bureau of Infrastructure, Transport and Regional Economics (2009), Australian Transport Statistics Yearbook 2009,
Department of Infrastructure, Transport, Regional Development and Local Government, Canberra; Australian Bureau of Statistics (2008),
Australian System of National Accounts, Cat no. 5204.0, ABS, CanberraMoving People Solutions for a growing Australia 9
A strong recovery in spending on economic infrastructure Over the past thirty years, Australian Federal Government
in recent years has helped tackle some infrastructure involvement in land transport has been predominantly
backlogs, but the consequences of three decades of a focused on the road sector, both via funding support for
declining expenditure share are increasingly apparent and road maintenance and upgrading and regulation of road
have been reported by groups such as the Business Council use. Federal land transport funding over the thirty year
of Australia3 and Infrastructure Partnerships Australia.4 period from 1974 to 2004 totalled $62 billion, of which
$58 billion was road funding.8 Rail freight and urban
The increasing national focus on transport policy in many
transit received Federal funding support of just $4 billion
countries is driven by growing concerns about greenhouse
over this same period.
gas emissions and the urgency of the transport sector
responding to rising GHG concentrations. At the May 2009 Since the election of the Rudd Government, there has been
OECD International Transport Forum held in Leipzig, a marked increase in Federal Government involvement
for example, it was widely acknowledged that national in land transport; the 2009–10 Budget committed over
transport policy makers should lead sectoral responses to $4 billion to support public transport development.
climate change before finance and energy policy specialists However, Australia still lacks a comprehensive statement
impose solutions on the transport sector. The recently of the vision or goals that are being pursued by
announced UK greenhouse gas emission reduction target such involvement.
of 34 per cent on 1990 levels by 2020 gives transport a
This report is designed to contribute to the development
major role in emissions reduction.5 Hybrid buses are
of an Australian national transport policy, focusing on
of considerable interest in the US and there is growing
land transport and primarily, but not solely, on people
examination of high speed rail in both Europe and the
movement. It also seeks specific actions from the
US, partly because of the good greenhouse gas emissions
Commonwealth Government, in those areas where it has
performance of this mode. While the emissions intensity
direct influence. The structure of the report is as follows:
varies from country to country, the GHG emissions are
estimated at 4 kg of CO2 emissions per 100 passenger kms >> Section 2 provides details on the critical transport issues
for high speed rail, compared to 17 kg of CO2 emissions that demand a national transport policy response in
per 100 passenger kms for air travel.6 Given that the Australia, focussing primarily on people movement.
Melbourne‑Sydney air route is the fourth busiest in the However, it also addresses certain freight issues because
world7, the Australian East Coast is potentially a strong integrated approaches to transport policies and
candidate for high speed rail. programs are widely recognised as delivering the most
effective outcomes;
Congestion and greenhouse gas emissions are major
>> Section 3 outlines the nature of the responses that will
examples of market failures or externalities, which require
address root causes and enable identified issues to be
efficient corrective governmental actions. The scale of
effectively tackled;
costs and other consequences associated with Australian
transport congestion and GHG emissions alone is such as >> Section 4 sets out proposals for how Australia’s public
to warrant an Australian national land transport policy transport systems should be improved in coming years,
response. Other issues noted in Section 2 (e.g. the road to enable them to contribute effectively to tackling the
toll, social exclusion, energy security) add further weight problems outlined in Section 2;
to the case for a national policy response. Australia >> Section 5 proposes how the Federal Government should
remains, in fact, one of the few developed economies participate within this national response.
without a clearly enunciated national land transport policy
that encompasses all modes of surface transport, the
lack of focus on public transport being a notable gap for
many years.
3 Business Council of Australia (2009), Groundwork for growth: Building the infrastructure that Australia needs, Business Council of Australia, Melbourne.
4 Infrastructure Partnerships Australia (2007), Australia’s Infrastructure Priorities: Securing Our Prosperity, Infrastructure Partnerships Australia, NSW.
5 http://news.bbc.co.uk/2/hi/science/nature/8150919.stm
6 Figures based on the situation in Europe. Australia’s near‑total reliance on coal for the generation of electricity would suggest that emissions by high speed
trains in Australia would be higher
7 Official Airline Guide (2007), Media Release: OAG reveals latest industry intelligence on the busiest routes
8 UITP (2006), UITP (Australia/New Zealand) Members’ Daily News Summary, The International Association of Public Transport
Australia‑New Zealand (UITPANZ).two National Transport Issues
12 Moving People Solutions for a growing Australia

National Transport Issues

Around the world, there is remarkable similarity of                                   Box 1: The major national transport problems are common
the key transport issues that are the focus of national                               internationally
governments. These issues include:
                                                                                         “In one way or another, transportation plays a vital and
>> traffic congestion, where costs are persistent, high                                  essential role in all social and economic activities... It
   and increasing, with consequences for economic                                        is inexorably intertwined and interdependent with the
   competitiveness and city liveability;                                                 economic and social fabric of our society.”9
>> transport energy consumption, where the high                                          “The surface transportation system of the United States is at
   reliance on, and increasing demand for, fossil fuels                                  a crossroads. The future of our nation’s well‑being, vitality,
   has consequences for greenhouse gas emissions and                                     and global economic leadership is at stake. We must take
                                                                                         significant, decisive action now to create and sustain the
   energy security;
                                                                                         pre‑eminent surface transportation system in the world.”10
>> the social exclusion confronting many people                                          “Across the world, cities face many common transport
   because of poor mobility or access opportunities,                                     issues. Typically they include growing traffic congestion,
   including people in outer suburbs, and remote areas                                   pollution, greater car dependency, buses caught in city
   and communities;                                                                      congestion, and aging transport infrastructure. This in turn
                                                                                         reduces urban quality of life, has impacts on people’s health
>> the air pollution consequences of current
                                                                                         and can impede economic growth.”11
   transport choices;
>> the safety and health consequences of current transport
   choices; and,
>> ageing transport infrastructure (which accentuates
                                                                                      2.1 Traffic congestion, competitiveness
   many of the other concerns listed above).                                          and liveability
                                                                                      The Bureau of Transport and Regional Economics has
These issues are of national concern because they impinge
                                                                                      estimated that road traffic congestion cost Australia
severely on what are the universal national goals of:
                                                                                      almost $10 billion nationally in 2005 and that this cost
>> economic competitiveness                                                           will double by 2020.12 All capital cities are affected, with
>> environmental sustainability and                                                   the Bureau estimating that congestion cost Sydney $3.5bn
>> social inclusion.                                                                  in 2005, Melbourne $3bn, Brisbane $1.2bn, Perth $0.9bn
                                                                                      and Adelaide $0.6bn, with smaller costs in other capital
All of the problems cited relate to transport in cities but
                                                                                      cities. These costs represent significant economic waste,
all except air pollution and congestion are also relevant to
                                                                                      adversely affecting industry competitiveness and reducing
regional and remote areas.
                                                                                      the liveability of our cities. The widespread incidence and
                                                                                      scale of congestion indicates a need for national solutions.
                                                                                      While congestion is not a new phenomenon, there is
                                                                                      a growing international recognition of its connections
                                                                                      to economic competitiveness and city liveability. This
                                                                                      is perhaps most obvious in relation to the added costs
                                                                                      congestion creates for freight transport and inventory
                                                                                      management, but is now increasingly being recognised
                                                                                      as important in relation to the growth of trade‑exposed
                                                                                      knowledge‑intensive activities, such as higher order
                                                                                      business and professional services, finance, high tech
                                                                                      manufactures and biotechnology. These activities typically
                                                                                      have many locational options and liveability for the skilled
                                                                                      staff employed in these sectors is a key determinant
                                                                                      of location.

9    Transport Canada (2008), Transportation in Canada: An Overview, Minister of Public Works and Government Services, Canada, p. 4.
10   U.S. National Surface Transportation Policy and Revenue Study Commission (2007), Transportation for Tomorrow: Report of the National Transportation Policy
     and Revenue Study Commission, Volume 1, December, p. 1.
11   MVA (2005), World Cities Research: Summary Report, Report prepared for the U.K. Commission for Integrated Transport, p. i.
12   Bureau of Transport and Regional Economics (2007), Estimating urban traffic and congestion cost trends if or Australian cities, Working Paper no. 79, Canberra.
Moving People Solutions for a growing Australia 13
These links are widely recognised. For example, the recent Road traffic volumes for person movement in Australia
US Transportation Research Board paper on Critical Issues have flattened off in recent years in Australian capital
in Transportation highlights the economic consequences cities. Figure 2.1 below, showing data for six Australian
of an ageing infrastructure stock for competitiveness13, capital cities, suggests that there was a distinct flattening
a theme echoed by the US National Surface Transportation in the growth profile for each city but particularly for
Policy and Revenue Study Commission in its recent the larger cities, from 2003–04. In terms of kilometres
report.14 More broadly, the links between transport travelled per capita, this slowdown is even more dramatic
infrastructure development and economic competitiveness (Figure 2.2). While car passenger kilometres increased
were recently highlighted in an Economist Intelligence by 20.8 per cent across the six cities shown in total, in
Unit report, Megacity Challenges, in which a survey across the decade from 1989–90 to 1999–2000, the growth rate
25 megacities revealed transportation infrastructure slowed to only 10.6 per cent over the ensuing eight years
development as the highest infrastructure priority for to 2007–08, with most of this growth being in the first half
enhancing economic competitiveness.15 of this period. Rising fuel prices are, no doubt, one factor
contributing to this pattern, with 2005–06 being the start
At a more local level, there is growing evidence that
of the recent period of high fuel prices. Average 2005–06
the accessibility of suburban sub‑centres is important
fuel prices were over 10 per cent above 2003–04 prices and
in helping to combat congestion, foster employment
2006–07 prices increased even faster. This flattening in
and residential growth in these locations. This is an
growth of car traffic in the capital cities will have slowed
important element in fostering more compact cities,
the growth in road congestion costs.
a widespread policy objective of many governments
internationally at present. Public transport is an important Figure 2.3 shows public transport patronage data, with
means of providing local/sub‑regional access to many the upwards patronage trends that have been apparent
such locations.16 since the early 90s receiving a solid boost from 2003–04,
again most noticeably in the larger cities. Public transport
An important aspect of road congestion is the high rate
patronage in the six cities shown, in total, increased
of cost increase for additional units of traffic growth
by 13.6 per cent between 1989–90 and 1999–2000 but
(high “marginal social costs of congestion” in economic
accelerated to grow by 24.9 per cent in the eight years
jargon). One implication of this cost relationship is
to 2007–08. Public transport has clearly gained market
that small reductions in congestion levels can generate
share from the car in the capital cities over this period.
large savings (benefits). For example, US research has
There have been many contributing factors behind this
calculated that marginal peak period congestion costs
rise including fuel price rises, increased public transport
for an urban freeway average 6–9 cents per vehicle mile
service levels, road congestion and environmental
when traffic travels faster than 50 mph, and up to 37 cents
concerns, and strongly growing CBD employment in some
per vehicle mile when traffic flows at less than 40 mph.17
cities. While the growth in congestion on road systems may
UK research has suggested that urban congestion costs
have slowed somewhat, this has been joined by growing
(in the UK) can be cut by over 40 per cent if congestion
congestion (crowding) on public transport systems as
pricing reduces urban traffic volumes by about 4 per cent.18
a consequence of this rapid growth in public transport
School holiday traffic levels in Australia typically involve
modal share.
slightly larger traffic reductions, illustrating the significant
congestion gains to be achieved from small reductions in The growth experience in Australian cities is unique, even
volumes. However, if the benefits of such a reduction in by global standards. Patronage growth on some urban rail
traffic volumes and associated congestion costs are to be systems in Australia over the last 5 years has been higher
sustained, measures are needed to limit any subsequent than observed in any other major system (Figure 2.4).
traffic generation caused by lower congestion costs.
Pricing solutions and capacity reductions are a way to
achieve this outcome, as discussed in Section 3.2 below.
13 United States Transportation Research Board (2006), Critical Issues in Transportation, Washington DC.
14 United States National Surface Transportation Policy and Revenue Study Commission (2007), Transportation for Tomorrow: Report of the National Surface
Transportation Policy and Revenue Study Commission, December.
15 Economist Intelligence Unit (nd)., Megacity challenges: a stakeholder perspective. Research project conducted by Globescan and MRC McLean Hazel. Sponsored
by Siemens.
16 Public transport also plays an important role in facilitating tourism, including in and around capital cities.
17 Herbert Levinson (1995), Freeway Congestion Pricing: Another Look, Transportation Research Record 1450, (www.trb.org) pp. 8–12.
18 Department for Transport (2004), Feasibility study of road pricing in the UK—Report, Appendix B: Modelling Results and Analysis, Report to the Secretary of
State, Table B3.14 Moving People Solutions for a growing Australia
Figure 2.1: Total car passenger kilometres for capital cities (FY1991–2008)
Billion passenger kms
50
45
40
35
30
25
20
15
10
5
0
1990 1991 1992 1993 1994 1995 1996 1997 1998 1999 2000 2001 2002 2003 2004 2005 2006 2007 2008
Sydney Melbourne Brisbane Adelaide Perth Hobart
Source: Bureau of Infrastructure, Transport and Regional Economics (2009), Australian Transport Statistics Yearbook 2009,
Department of Infrastructure, Transport, Regional Development and Local Government, Canberra.
Figure 2.2: Estimated car passenger kms per capita (FY1990–2008)
12,500
12,000
11,500
11,000
10,500
10,000
9,500
9,000
1990 1991 1992 1993 1994 1995 1996 1997 1998 1999 2000 2001 2002 2003 2004 2005 2006 2007 2008
Sydney Melbourne Brisbane Adelaide Perth
Source: Bureau of Infrastructure, Transport and Regional Economics (2009), Australian Transport Statistics Yearbook 2009,
Department of Infrastructure, Transport, Regional Development and Local Government, Canberra; Australian Bureau of Statistics (2009),
Regional Population Growth, Cat. no. 3218.0, ABS, Canberra;Moving People Solutions for a growing Australia 15
Figure 2.3: Public transport use in capital cities (FY1991–2008)
Billion passenger kms
8
7
6
5
4
3
2
1
0
1991 1992 1993 1994 1995 1996 1997 1998 1999 2000 2001 2002 2003 2004 2005 2006 2007 2008
Sydney Melbourne Brisbane Adelaide Perth Hobart
Source: Bureau of Infrastructure, Transport and Regional Economics (2009), Australian Transport Statistics Yearbook 2009,
Department of Infrastructure, Transport, Regional Development and Local Government, Canberra.
Figure 2.4: Rail patronage growth per annum in major international cities (2004–08)
Percent
12
10.5
10
8.2
8
6.4
6
4.6
4.3 4.2
4
3.3 3.2 3.1
2.6 2.6 2.6
2.1
2
0.9
0
Melbourne Perth Brisbane Singapore Vienna San New York Washington London Madrid Chicago Hong Sydney Adelaide
(Connex) (Transperth) (Citytrain) (SMRT) (Wiener Francisco City (WMATA) (TfL / LU) (Metro de (CTA) Kong (CityRail) (Trans
Linien) (BART) (NYCT) Madrid) (MTR)* Adelaide)
Note: *Domestic lines including KCRC East & West lines, excluding airport and cross-boundary
Source: Rail operator annual reports and statistics; Government statistics; L.E.K. Analysis16 Moving People Solutions for a growing Australia
Melbourne, Brisbane and Perth all stand out at both a The challenges of managing road congestion and city
national and international level. While fuel prices rises liveability are likely to be further exaggerated by strong
have been common across all cities, different local factors population growth anticipated for Australian cities. Recent
appear to be important also. In Melbourne a very strong projections prepared by Treasury show that Australia’s
increase (32 per cent between 2000 and 2008) in Central population will grow by c.63% over the next 40 years,
Business District employment has underpinned growth in instead of c.33% as estimated two years ago, to 35 million
train use in particular, and a 26 per cent increase in bus people by 2049.21 The increase is driven by higher fertility
service kilometres between 2005–06 and 2008–09 has been rates, a greater number of women of child‑bearing age, and
very important in driving high growth in bus patronage increased net migration.
(of 28 per cent over the same period). In Brisbane, there
In addition to the impact of overall population growth,
has been a rapid expansion of bus service kilometres,
Australia also faces a significant ageing of its population
while in Perth a major rail extension has been completed.
base. The number of Australians over 55 is expected to
Each of these cities has also made great efforts to integrate
increase from 5.6m to 10.6m between 2010 and 2050.22 Older
the various modes of transport, through changes to fares,
Australians without access to motor vehicles rely heavily
signage and improved interchanges and timetabling.
on public transport, and will be at increasing risk of social
The important conclusion emerging from this recent exclusion. Also, transport systems will need to continue to
experience is that public transport can help to ease adapt to cater for a larger number of elderly patrons. The
growing road congestion pressures if public transport continued roll out of many DDA measures (e.g. low floor
service levels are good enough and employment growth buses, lifts etc) will be beneficial in this regard.
is strong in major urban nodes. However, growing public
transport use has been accompanied by increasing
crowding on many services. Load breaches on Melbourne’s 2.2 Climate change (greenhouse
rail system have grown by over 500 per cent in three gas emissions)
years, as patronage numbers have continued their rapid
Australia is one of the world’s highest per capita emitters
growth19. If public transport is to continue its contribution
of greenhouse gases and our transport emissions are
to reducing congestion pressures, then investment in
particularly high. Globally, the transport sector is
increased capacity is vital.
responsible for almost 15 per cent23 of greenhouse gas
The same trend of a flattening off in urban car use emissions, which are implicated in climate change.
noted for Australian capital cities has been observed, Transport’s share in Australia is smaller because of the
for example, in the US. The most recently published US high emissions intensity of our coal‑based electricity
estimates of congestion (for 2007 conditions) prepared generation; however, our per capita GHG emissions from
by the Texas Transportation Institute (TTI) suggest that the transport sector are high. By way of example, per capita
road congestion (measured as traffic delay) was about transport GHG emissions for Brisbane are over three times
one per cent less in 2007 than in 2006 (but congestion those for London, while Melbourne’s emissions are twice
costs still increased in real terms, because of rising time those of London.
values).20 The TTI suggests that high fuel prices have been
Transport contributes about 14 per cent of Australian
the major influence on this development. Figure 2.5 shows
greenhouse gas emissions and emissions from the sector
that roadway vehicle kilometres travelled in the United
are growing faster than from any other sector, except
States for all vehicles is growing at a slower rate than
stationary energy. Australia’s 2006 transport emissions
that experienced in the 1980s. It is also possible that, in
were 27 per cent above 1990 levels (Figure 2.6) and, by
both Australian and US cities, the prevalence of urban
2020, transport emissions are projected to be about
congestion is itself starting to influence traveller behaviour
two‑thirds higher than in 1990, even allowing for some
and to slow growth in road use.
emission‑reducing initiatives (Figure 2.7).
19 Research by Professor Graham Currie at Monash University
20 Schrank, D and Lomax, T. (2009), Urban Mobility report, Texas Transportation Institute, July.
21 Reported in The Australian (18 September 2009) Population to now hit 35 million by 2049 http://www.theaustralian.com.au/news/nation/
population‑to‑now‑hit‑35‑million‑by‑2049/story‑e6frg6nf‑1225776279746. Accessed 7 December 2009.
22 Australian Bureau of Statistics (2008) ,Population Projections, Australia, Cat. no. 3222.0, ABS, Canberra;Moving People Solutions for a growing Australia 17
Road transport is easily the largest source of Australian cars for three years, this is unlikely to continue long term,
transport GHG emissions, accounting for 88 per cent of such that the CPRS should be expected to increase fuel
sectoral emissions in 2006 (Figure 2.7). While aviation prices over the long term, a necessary development if that
emissions are growing faster than those from road scheme is to provide improved price signals to road users
transport, the road transport contribution is so dominant to cut emissions. In addition to carbon pricing, this report
that it is still projected to account for 86 per cent of argues in Section 3 that a wide range of complementary
Australian transport emissions by 2020. measures will also be needed to make significant
reductions in transport GHG emissions.
The magnitude and growth rate of transport emissions
suggest that climate change mitigation policies are A recent survey of consumer attitudes to climate change
likely to have a very significant influence on national has demonstrated some interesting results in the area of
and international transport policies and programs in transport, with significant implications for Governments.
coming years. Consumers said they were most likely to reduce their
transport emissions by reducing their number of trips,
Stern24 and Garnaut25 have canvassed the need for high
switching to a more efficient vehicle or walking or cycling.
emitting developed countries to reduce greenhouse gas
Increased use of public transport was rated fourth on
emissions by 80 per cent by 2050, to help stabilise global
the list of actions. However, when asked what actions
temperature increases to 2 degrees C. This reduction target
Governments should be taking to reduce transport
has recently been legislated in the UK, in the Climate
emissions, over 60% of consumers nominated “improve
Change Act 2008. An 80 per cent target for high emitting
public transport”. (Figure 2.8)
developed countries received further impetus at the July
2009 G8 leaders’ meeting, where leaders agreed to a goal of
having industrialised nations reduce their greenhouse gas
2.3 Social inclusion
emissions by 80 per cent by 2050, as part of a worldwide
goal of a 50 per cent cut in such gases from all nations, rich It is well established that mobility is an important
and poor. influence on people’s ability to participate in society. Poor
mobility can be a significant contributing factor to social
Although Australia has currently adopted a 2050 target exclusion. In car dependent societies like Australia, the
of 60 per cent cut in emissions, this seems unlikely to be lack of car availability, in particular, is well known to be
sustainable for such a high emitting country, with a target a significant constraint on social inclusion and economic
of 80 per cent for 2050 (or higher) looking increasingly participation. The 2006 Australian Census, for example,
likely.26 Australia will need to achieve a dramatic change showed that:
in the trajectory of its transport GHG emissions for the
>> 13 per cent of people were aged under 18 and 4 per cent
sector to contribute to emission reductions in any way
were aged 80 or over, both groups likely to have low
approaching this magnitude. Section 3.2 and Appendix
access to cars;
1 of this report identify the nature and scale of transport
changes that Australia would need to achieve if it was to >> 10 per cent of households did not have a car;
aspire to cut its transport emissions by about 80 per cent >> 24 per cent of single person households did not have
by 2050. a car; and,
A Carbon Pollution Reduction Scheme (CPRS) is intended >> nearly 50 per cent of households had only one car.
to form the core of Australia’s efforts to reduce greenhouse These simple numbers suggest that transport is likely to be
gas (GHG) emissions and this will add, long term, to fuel a concern for significant numbers of Australians.
price pressures. For example, a commonly mentioned
future carbon price of about $A60/t27 is equivalent to an
increase of about 16c/L in fuel costs, comparable to some
of the changes in fuel prices seen in recent years. While the
Federal Government Carbon Pollution Reduction Scheme
has announced an excise tax offset to carbon prices for
23 World Resources Institute (2009), Climate Analysis Indicators Tool Version 6.0, Washington, DC.
24 Stern, N. (2006), Stern Review on the Economics of Climate Change, HM Treasury, London.
25 Garnaut, R. (2008), The Garnaut Climate Change Review Final Report, October.
26 The Intergovernmental Panel on Climate Change has consistently underestimated the rate of growth of GHG emissions and
emerging scientific evidence suggests climate stabilization may require GHG concentrations to be reduced to about 350ppm,
not 450ppm. These two considerations suggest that targets above 80 per cent may well emerge in coming years (particularly
for high emitting countries like Australia if equal per capita emissions were to become the basis for setting international targets).
27 McKinsey and Company (2008), Carbon Capture & Storage: Assessing the Economics, McKinsey Climate Change Initiative.18 Moving People Solutions for a growing Australia
Figure 2.5: Vehicle kilometres travelled—United States (1980–2006)
CAGR%
Trillions of VKT (1980–90) (90–00) (00–06)
5 3.5 2.5 1.6
4
4.1 2.7 2.9
3
2
2.6 2.2 (0.7)
1
0
1980 82 84 86 88 90 92 94 96 98 00 02 04 06
Total Urban Rural
Note: Years 1981–85 and 86–90 interpolated
Source: Federal Highway Administration (2009), Highway Statistics, U.S. Department of Transportation, Washington, DC.
Figure 2.6: Australian Greenhouse Gas Emissions (1990–2006)
Waste -11.4%
Industrial processes +17.7%
Fugituve emissions +18.1%
Land use
-70.7%
Transport +27.1%
Agruculture
+3.8%
Stationary energy
+47.3%
0 50 100 150 200 250 300 350
Emissions (Mt CO2-e)
1990 2006
Source: Australian Greenhouse Emissions Information System (2008) Australia’s National Greenhouse Accounts,
Department of Climate Change, CanberraMoving People Solutions for a growing Australia 19
Figure 2.7: Australian transport greenhouse gas emission projections (1990–2020F)
Emissions (Mt CO2-eq)
100
80
60
40
20
0
1990 1995 2000 2005 2010 2015 2020
Cars Trucks Light commercials Buses Aviation Rail Shipping
Source: Bureau of Infrastructure, Transport and Regional Economics (2009), Greenhouse Gas emissions from Australian Transport:
Projections to 2020, Working Paper 73, Department of Infrastructure, Transport, Regional Development and Local Government, Canberra
Figure 2.8: Consumer attitudes to transport emissions
Percent of total mentions*
1,666 1,080
100
Other Other
Build better walk and bicycle paths
Work closer to home
Provide incentives to switch to
80 electric/hybrid or other
Increase the use of public transport
Support the development of
more efficient cars
Increase the use of bicycle
60 and/or walking
40 Switch to a more fuel
efficient vehicle
Improve public transport
20
Reduce the number of
trips by better planning
0
In terms of reducing your surface transport What action do you think should be the
emissions, what would you be most likely to do? top priorities for the Government to from transport?
(Can choose more than one)
Note: n=1082; *1,666 is the number of mentions for all responses
Source: L.E.K. Survey and Analysis.20 Moving People Solutions for a growing Australia
No Way to Go: Transport and Social Disadvantage in Statistical analysis of the factors associated with a high
Australian Communities28 presents a range of Australian degree of risk of social exclusion identified mobility as a
examples supporting the links between mobility and significant contributor. When only a small number of trips
social inclusion, across a wide range of differentiating are made per day, an additional trip has high value.31 The
factors. For example, transport disadvantage is a common availability of adequate public transport services is the
problem for young people, especially in rural areas, and main way through which people at risk of social exclusion
for older Australians, especially as the capacity to drive because of transport disadvantage can be assisted to
diminishes. Lack of income is frequently a compounding reduce this risk. Service levels that can help meet this
factor. Physical capacities are also an important influence inclusion objective are considered in Section 3.2.
on mobility opportunities.
Box 2: The Importance of mobility for social capital
One important recent study29 has shown how urban
dwellers living in the outer suburbs are most vulnerable to A Monash University (Australian Research Council
the impact of high fuel prices and high mortgage interest supported) study into links between mobility, social
rates. In both urban fringe and regional areas the high level exclusion and well‑being asked survey respondents which
of car dependency means people have little choice but to activities they most commonly encountered difficulties in
incur high fuel costs if they wish to maintain lifestyles. The accessing. Visiting friends and relatives (22%), enjoyment
term “forced car ownership” has been used to describe (getting out and about—20%) and sports/leisure (18%) were
the most frequent responses overall. For those most at risk
the situation where low income households buy two or
of social exclusion, enjoyment (getting out and about) was
more cars to achieve the mobility levels they need, even
rated as the most frequent problem. These answers indicate
though this may consume a very large proportion of the
the importance respondents place on building their social
household budget.30 While the current lower petrol prices capital, which the study’s analysis has shown can be an
and interest rates have eased these pressures, the medium important way of reducing the risk of social exclusion.
to longer term outlook is for fuel prices to remain high,
under pressures such as peak oil (discussed further below
in Section 2.4). Research recently undertaken by the National Institute of
Another current study is finding significant links between Economic and Industry Research for the Australian Farm
mobility and social exclusion. This study has undertaken Institute32 shows that the typical rural and regional dweller
comprehensive surveys of personal characteristics and in Australia has much lower accessibility to services
travel behaviour of a sample of Melbourne and Latrobe than those living in metropolitan areas. Core services
Valley residents, finding that people at greater risk of being are typically available within a distance of 1.4 kilometres
socially excluded tend to engage in fewer activities and to in metropolitan areas, compared to over 30 kilometres
travel less. in rural Australia and townships (with obviously wide
variability). Prima facie, this data is strongly supportive
Two noteworthy characteristics from the Melbourne of a need to focus on access opportunities for rural and
sample reflect the relatively greater transport disadvantage regional Australia to enhance prospects of social inclusion,
faced by people living in outer suburbs. in addition to outer urban areas.
1. People living in outer suburbs make about the same
In regional areas, most people rely on the car for access
number of trips as those living in inner suburbs but
opportunities. All‑weather road access is a fundamental
travel almost twice as far in so doing (a function of
requirement for these people, to maximise opportunities
relatively low accessibility in outer areas).
for social inclusion. Public transport service provision is
2. Public transport service availability in outer Melbourne less in regional areas and often not available, especially in
is less than one‑third that in inner Melbourne. remote Australia. Community transport plays an important
role in regional areas in providing travel opportunities for
many people who are at risk of social exclusion.
28 Currie, G., Stanley, JR and Stanley, JK (2007), No Way to Go: Transport and Social Disadvantage in Australian Communities, Monash University e‑Press, Clayton.
29 Dodgson, J and Sipe, N (2006), Shocking the Suburbs: Urban Location, Housing Debt and Oil Vulnerability in the Australian City, Urban Research Program,
Research Paper No. 8, Griffith University, June.
30 Currie,G (2009), Australian Urban Transport and Social Disadvantage, Australian Economic Review Forum on Urban Transport, Vol 42, no. 2, pp 201–208.
31 The research suggests that an additional trip to a person at risk of social exclusion is worth about $20 on average, with higher values at lower income levels,
double the value that is currently used in transport evaluations. See Stanley. J.K., Hensher, D.A., Stanley, J.R, Currie, G., Greene, W and Vella‑Brodrick, D
(forthcoming), Social Exclusion and the Value of Mobility, Journal of Transport Economics and Policy.
32 National Institute of Economic and Industry Research (2009), Essential Services in Urban and Regional Australia—a Quantitative Comparison, Prepared for the
Australian Farm InstituteYou can also read