The context of REDD+ in Vietnam - Drivers, agents and institutions 2nd edition
←
→
Page content transcription
If your browser does not render page correctly, please read the page content below
OCCASIONAL PAPER

The context of REDD+ in Vietnam
Drivers, agents and institutions
2nd edition

Pham Thu Thuy
Hoang Tuan Long
Nguyen Dinh Tien
Dao Thi Linh Chi
Ngo Ha Chau
Pham Viet Hong
OCCASIONAL PAPER 196

The context of REDD+ in Vietnam
Drivers, agents and institutions

2nd edition

Pham Thu Thuy
CIFOR

Hoang Tuan Long
CIFOR

Nguyen Dinh Tien
CIFOR

Dao Thi Linh Chi
CIFOR

Ngo Ha Chau
Soka University of America

Pham Viet Hong
CIFOR

Center for International Forestry Research (CIFOR)
Occasional Paper 196
© 2019 Center for International Forestry Research
Content in this publication is licensed under a Creative Commons Attribution 4.0 International
(CC BY 4.0), http://creativecommons.org/licenses/by/4.0/
ISBN 978-602-387-121-6
DOI: 10.17528/cifor/007402
Pham TT, Hoang TL, Nguyen DT, Dao TLC, Ngo HC and Pham VH. 2019. The context of REDD+ in Vietnam: Drivers, agents
and institutions 2nd edition. Occasional Paper 196. Bogor, Indonesia: CIFOR.
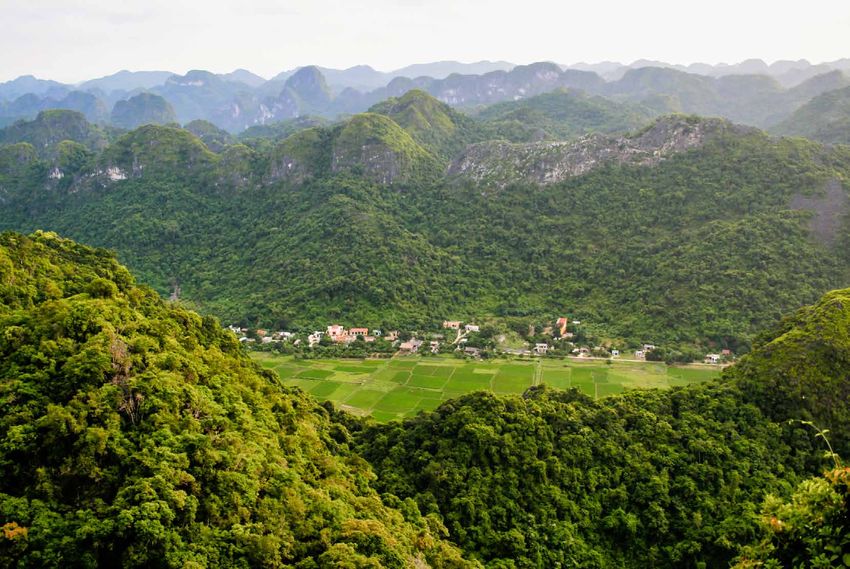
Photo by Terry Sunderland/CIFOR
Villages in Vietnam.
CIFOR
Jl. CIFOR, Situ Gede
Bogor Barat 16115
Indonesia
T +62 (251) 8622-622
F +62 (251) 8622-100
E cifor@cgiar.org
cifor.org
We would like to thank all funding partners who supported this research through their contributions to the CGIAR Fund.
For a full list of the ‘CGIAR Fund’ funding partners please see: http://www.cgiar.org/our-funders/
Any views expressed in this publication are those of the authors. They do not necessarily represent the views of CIFOR,
the editors, the authors’ institutions, the financial sponsors or the reviewers.iii Contents Abbreviations v Acknowledgments vii Executive summary viii Introduction x Methods xi 1 Analysis of the drivers of deforestation and degradation in Vietnam 1 1.1 Forest cover and historical overview of forest-cover change 1 1.2 Review of the main drivers of forest-cover change 2 1.3 Mitigation potential 6 2 Institutional environment and distributional aspects 11 2.1 Forest governance in Vietnam 11 2.2 Decentralization and benefit sharing 16 2.3 Rights: Ethnic minority rights and rights to carbon, land and trees 21 3 The political and economic context of deforestation and forest degradation in Vietnam 27 3.1 Vietnam’s political system and its macro economy 27 3.2 Political economy of drivers of deforestation and degradation 29 4 The climate change policy environment 35 4.1 The REDD+ national policy environment 35 4.2 Financial management mechanism of the National REDD+ Program 41 4.3 Government agencies responsible for REDD+ 45 4.4 REDD+ and ethnic minority people 45 4.5 Safeguards information and assessment 46 5 Implications for effectiveness, efficiency, and equity (3Es) in Vietnam 50 5.1 Effectiveness 50 5.2 Efficiency 50 5.3 Equity 51 Conclusions 52 References 53
iv

     List of figures, tables and boxes

     Figures
     1    Forest cover of Vietnam from 1943 to 2017                                            2
     2    The gross output of wood of Vietnam                                                  4
     3    Gross output of wood by economic activity category, 2012–2016                        4
     4    Cleared forest area and burnt areas of Vietnam from 1995 to 2016                     5
     5    Rice and maize production                                                           34
     6    National REDD+ Action Plan (NRAP) Theory of Change                                  40
     7    MRV system                                                                          41
     8    Potential financial sources for REDD+ Fund                                          43
     9    Scope of activities under proposed REDD+ Fund                                       43
     10   REDD+ Fund’s proposed disbursement channel                                          43
     11   Institutional setting of REDD+                                                      45

     Tables
     1    Forest area of Vietnam by forest type (ha)                                           1
     2    Forest area between 2005 and 2017                                                    3
     3    Land-use change in Vietnam, 2012–2017 (1000 ha)                                      3
     4    Contribution to GHG emissions mitigation from 1 January 2021 to 31 December 2030     7
     5    GHG mitigation and cost identified in the Initial National Communication             8
     6    GHG’s targets developed by MPI, MONRE and MARD                                       9
     7    International agreements signed by the Government of Vietnam                        11
     8    Major forest policies in Vietnam                                                    14
     9    Forest management structure and decision-making process                             16
     10   Fiscal decentralization between central and provincial level                        21
     11   Targets of Vietnam Forest Development Strategy                                      23
     12   Comparison of forest area by owner entities between 2005 and 2016                   23
     13   Economic indicators, 2014–2018                                                      27
     14   Plantation and export of coffee in Vietnam, 2012–2017                               31
     15   Plantation and export of rubber in Vietnam, 2010–2017                               31
     16   The largest world wood markets over first 6 months in 2017                          31
     17   Pros and cons of different markets                                                  32
     18   Timber volume                                                                       32
     19   Major policies that shaped REDD+ policy in Vietnam                                  35
     20   Comparison of NRAP 2017–2020 and NRAP 2021–2030                                     38
     21   Potential REDD+ funding and national program budgets                                42
     22   Challenges for accessing to international and national REDD+ finance                42
     23   Assessment criteria and activities funded through disbursement channels             44
     24   REDD+ financing sources, safeguard requirements and the proposed country response   48

     Boxes
     1    Five main components of Vietnam’s plan for the implementation of the Paris Agreement 7
     2    Objectives of the proposed REDD+ Fund                                                41
v Abbreviations 5MHRP 5 Million Hectare Reforestation Program AANZFTA ASEAN–Australia–New Zealand Free Trade Area AFTA AEAN Free Trade Area ACFTA ASEAN–China Free Trade Area ASEAN Association of Southeast Asian Nations BAU Business As Usual CDM Clean Development Mechanism CITES Convention on International Trade in Endangered Species of Wild Fauna and Flora CPC Commune People’s Committee CSO Civil Social Organization EAEU Eurasian Economic Union EIA Environmental Impact Assessment EU European Union FA/FLA Forest Allocation/Forest Land Allocation Program FCPF Forest Carbon Partnership Facility FDI Foreign Direct Investment FLEGT Forest Law Enforcement, Governance and Trade FMB Forest Management Board FORMIS Development of Management Information System for Forestry Sector FPD Binh Dinh Forest Protection Department FPDP Forest Protection and Development Plan FPIC Free, Prior and Informed Consent FREL/FRL Forest Reference Level FSC Forest Stewardship Council FTA Free Trade Agreement GCF Green Climate Fund GCS Global Comparative Study GDP Gross Domestic Product GHG Greenhouse Gas GSO General Statistics Office HAWA Handicraft and Wood Industry Association of Ho Chi Minh City INDC Intended Nationally Determined Contribution LULUCF Land Use, Land Use Change and Forestry LURC Land Use Rights Certificate MARD Ministry of Agriculture and Rural Development
vi

     MONRE      Ministry of Nature Resource and Environment
     MPI        Ministry of Planning and Investment
     MRV        Measurement, Reporting and Verification
     NDC        Nationally Determined Contributions
     NGO        Non-government Organization
     NRAP       National REDD+ Action Plan
     NRIP       National REDD+ Implementation Plan
     NRSC       National REDD+ Steering Committee
     NTFP       Non-timber Forest Product
     NTP-RCC    National Target Program to Respond to Climate Change
     ODA        Official Development Assistance
     PAM        Policies and Measures
     PES        Payments for Environmental Services
     PFES       Payment for Forest Environmental Service
     PLR        Policies, Laws and Regulations
     PRAP       Provincial REDD+ Action Plan
     RBP        Result Based Payment
     REDD+      Reduced Emissions from Deforestation and Degradation
     SIS        Safeguard Information System
     SOE        State Owned Enterprise
     SOI        Summary of Information
     TPP        Trans-Pacific Strategic Economic Partnership
     UNDP       United Nations Development Programme
     UNFCCC     United Nations Framework Convention on Climate Change
     UNREDD     United Nation – Reduced Emissions from Deforestation and Degradation
     USD        US Dollar
     VAT        Value Added Tax
     VICOFA     Vietnam Coffee and Cocoa Association
     VIFORES    Vietnam Timber and Forest Product Association
     VND        Vietnam Dong
     VNFF       Vietnam Forest Protection and Development Fund
     VNFOREST   Vietnam Administration of Forestry
     VNTLAS     Viet Nam Timber Legality Assurance System
     VPA        Voluntary Partnership Agreements
     VRO        Vietnam REDD+ Office
     WTO        World Trade Organization
vii
Acknowledgments
This work is part of the policy component of We would also like to express our special thanks
CIFOR’s Global Comparative Study (GCS; www. to Dr. Moira Moeliono (CIFOR), Mrs. Nguyen
forestsclimatechange.org/global-comparative-study-on- Thi Thu Thuy, Mr. Cao Hai Thanh, Mr. Nguyen
redd.html), led by Pham Thu Thuy. The authors applied Thanh Phuong, Ms. Ha Phuong (The State
methods and guidelines designed by Maria Brockhaus, Steering Committee Office for the Target Program
Monica Di Gregorio and Sheila Wertz-Kanounnikoff. on Sustainable Development and REDD+
implementation) and Dr. Vu Tan Phuong (Vietnam
We gratefully acknowledge the financial support Academy of Forest Science) for their inputs and
received from the Norwegian Agency for Development reviews of our report. Special thanks are due to all
Cooperation and International Climate Initiative. participants who agreed to take part in this study.viii
Executive summary
Vietnam is acknowledged to be REDD+ pioneer Forest governance. In the period 2012–2017,
country, having adopted REDD+ in 2009. The Vietnam witnessed major policy change in the
National REDD+ Action Plan (NRAP) was the first forestry sector; for example, the new Forestry and
to be approved, in 2012. Since then, the contextual Land Law. Since 2012, Vietnam has also signed
and institutional settings for REDD+ policies have important international treaties and agreements on
been refined. This paper is an updated version of trade, such as Voluntary Partnership Agreements
Vietnam’s REDD+ Country Profile, which was (VPAs) through the European Union’s (EU) Forest
first published by CIFOR in 2012 (Pham et al. Law Enforcement, Governance and Trade (FLEGT)
2012). It analyzed (i) drivers of deforestation and Action Plan and the Free Trade Agreement. These
degradation; (ii) forest governance; (iii) macro new policies have enhanced the role of the forestry
policies and the political economy of deforestation sector within the overall national economy and
and degradation; (iv) climate change and REDD+ provided a strong legal framework and incentives for
policies; and (v) implications of REDD+ outcomes forest-user groups and government agencies to take
in terms of effectiveness, efficiency and equity. In part in forest protection and development. At the
this second version, the authors have verified and same time, new market rules and international trade
updated the 2012 findings on REDD+ policies and patterns also pose significant challenges for Vietnam,
progress in Vietnam. We have captured changes where the domestic forestry sector is characterized
between 2012 and 2017 based on a review of by state-owned companies and a large number of
secondary data and interviews with stakeholders domestic firms that struggle to comply with these
who have engaged in REDD+ policy development new rules. Moreover, there is still a gap between
and implementation in Vietnam. policy and practice, as well as weak law enforcement
remaining a major problem. Evidence also shows
Drivers of deforestation and degradation. Our increasing efforts of government and international
findings show that forest cover has increased since communities to ground forestry policies in a
2012, but enhancing, or even maintaining, forest participatory decision-making processes. Policy
quality remains a challenge. Drivers of deforestation documents have fully recognized the need to give
and degradation in Vietnam, including legal civil society organizations (CSOs) and ethnic groups
and illegal logging, conversion of forest for political space and include them in decision making.
national development goals (e.g. hydropower Yet, participation remains token. Government
and infrastructure development), commercial provision for tenure security and carbon rights for
agriculture, weak law enforcement and weak local households are still being developed, with little
governance, have persisted since 2012 up to 2017. progress since 2012.
However, with a strong political commitment,
the government has made significant progress in Political economy of deforestation and
addressing major drivers, such as the expansion of degradation. As in many other countries, addressing
hydropower plants and rubber plantations. Other drivers of deforestation and degradation is a great
drivers have been recognized by the government in challenge in Vietnam because they do not always
the revised National REDD+ Program 2017, along align with national development goals. Despite a
with policies and measures (PAMs) to address them. strong political commitment from the government
However, the effectiveness of these PAMs depends to ban natural logging, along with the Communist
on funding resources and cross-sectoral coordination Party’s emphasis on how economic development
to address drivers that are mostly driven by sectors should not come at the expense of the environment,
outside of the forestry sector. national gross domestic product (GDP) is mainlyix
generated from exported agricultural commodities 3Es (effectiveness, efficiency, equity) outcomes
and furniture. This makes it difficult to transform of REDD+. The effectiveness of REDD+
political commitment into reality. policies in addressing drivers of deforestation
and degradation has not be proven, even
Climate change and REDD+ policies and progress. though the revised NRAP has recently been
Vietnam has approved a national climate change approved. However, the fact that drivers of
strategy, as well as other sectoral climate change deforestation and degradation are outside of
adaptation policies, since 2012. The national the forestry sector and have a strong link to
REDD+ strategy and REDD+ institutional setting national economic development goals points to
has been refined and revised over time. The year an uneasy pathway for REDD+. The business
2017 marks a more comprehensive program, case for REDD+ in Vietnam has not been
NRAP, that aims to directly tackle the drivers of proven, due to an uncertain carbon market,
deforestation and degradation, which were not increasing requirements from donors and
well defined in the previous version of the NRAP. developed countries, and high transaction
However, uncertain and complex international and implementation costs. The progress on
requirements on REDD+ and limited funding have developing safeguarding policies in Vietnam
weakened the government’s interest in and political between 2012 and 2017 affirms the government’s
commitment to REDD+. REDD+ policies in interest in pursuing an equitable REDD+
Vietnam have shown significant progress in terms implementation. However, equitable REDD+
of its monitoring, reporting and verification (MRV) policies also require a contextual, procedural and
systems, forest reference emission levels (FREL), distributive setting, as well as a more inclusive
and performance-based and benefit-sharing decision-making process. These are not fully in
mechanisms by taking into account lessons learnt place in Vietnam. Current efforts toward 3E
from its national Payment for Forest Environmental outcomes of REDD+ could be enhanced by
Services (PFES) Scheme. Nevertheless, safeguarding stronger political commitment to addressing
mechanisms and consultation processes require the drivers of deforestation from all sectors,
further support to meet the requirements and broader changes in policy framework that create
expectations of both international and national both incentives and disincentives for avoiding
stakeholders. Funding sources for REDD+ in deforestation and degradation, cross-sectoral
Vietnam are expected to move from bilateral and collaboration, and committed funding from both
international assistance to the Green Climate Fund. the government and developed countries.x
Introduction
For participating countries, many questions The aim of the country profiles is to inform
remain on how to effectively, efficiently and decision makers, practitioners and donors of the
equitably formulate and implement REDD+. opportunities and challenges of implementing a
Drivers of deforestation and degradation are REDD+ mechanism, and to support evidence-
often highly complex, and can form part of based REDD+ decision-making processes.
dense networks of economic and political
interests. Reducing emissions by preventing forest Vietnam is pioneering REDD+ country. It
degradation and deforestation can be seen as a already has a REDD+ institutional setting in
controversial approach in the context of national place, consisting of the State Steering Committee
development paradigms and existing policy for the Target Program on Sustainable Forest
frameworks and objectives. What are the political Development and REDD+ Implementation,
implications of a REDD+ mechanism? How national REDD+ network and REDD+ sub-
could it be implemented successfully at ground technical working groups. In 2012, Decision 799
level? Understanding the complex relationships approved the National REDD+ Action Plan; this
between drivers, agents and institutions within was recently revised through Decision 419/QD-
the national context is vital to ensuring effective TTg issued on 5 April 2017.
implementation of REDD+.
In 2012, CIFOR first published its Vietnam
The CIFOR’s project Global Comparative Study REDD+ Country Profile (Pham et al. 2012),
(GCS) on REDD+, together with its country which documented and analyzed the context,
partners, is compiling profiles of 14 countries to actors and institutional setting for REDD+ in
better understand the socio-economic context in Vietnam from 2008 to 2012. However, since
which REDD+ policies and processes emerge. 2012, both the international and national
The country profiles provide contextual analysis REDD+ policy arenas have changed rapidly.
on conditions that affect the REDD+ policy This has greatly influenced and reshaped the
environment in each country. They are based implementation of REDD+ in Vietnam.
on reviews of existing literature, national and Understanding these changes, as well as the
international data, legal reviews and selected underlying factors that led to them, is therefore
expert interviews. important in the future implementation of
REDD+. This second edition of the REDD+
The country profiles examine five areas: Country Profile aims to capture the changes since
• drivers of deforestation 2012 and discusses the outcomes of REDD+
• institutional environment and revenue in terms of their effectiveness, efficiency and
distribution mechanisms equitability. This edition follows the guidelines
• political economy of deforestation and forest set out in CIFOR’s GCS developed by Brockhaus
degradation et al. (2012). As this is the second edition, the
• political environment of REDD+ (actors, authors will not repeat the findings published in
events and processes) first edition, but only highlight changes since our
• implications of each country’s current REDD+ first report in 2012 and explain these changes and
design for effectiveness, efficiency and equity. their implications for REDD+ outcomes.xi
Methods
A wide range of methods was used to update the In-depth interviews: Fifteen in-depth
2012 Country Profile. interviews were conducted with representatives
of government agencies, donors, international
Legal review: Government policies related to and national NGOs, research institutes and
REDD+, the overall forestry sector and macro CSOs in July and August 2017. The aim
policies introduced since 2012 were reviewed to was to explore stakeholders’ perceptions and
capture changes over time (if any) in the REDD+ experiences in relation to REDD+ progress,
institutional setting in Vietnam. opportunities and constraints influencing
REDD+ operation in Vietnam since 2012.
Literature review: Reports from a range of sources,
including government agencies, donors, international A consultation workshop: Twenty-four
agencies, non-governmental organizations (NGOs), leading organizations working on REDD+ in
civil society organizations (CSOs), media and Vietnam participated in a workshop in Hanoi.
international journals, were analyzed to identify the The aim of the workshop was to obtain
progress, challenges and opportunities for REDD+ feedback from stakeholders on the findings of
implementation in Vietnam since 2012. this study.1 Analysis of the drivers of deforestation
and degradation in Vietnam
1.1 Forest cover and historical the large area of forest plantation, forests that
overview of forest-cover change are certified by the Forest Stewardship Council
(FSC) are still limited. By 2016, only 220,000 ha
The total forest area of Vietnam increased gradually of plantation forests were certified, equivalent to
from 13,118,800 ha in 2008 to 14,415,381 5.3% of the total planted area.
ha in 2017 (Table 1). In 2017, 71% of forest
area in Vietnam was natural forest and the rest Figure 1 shows the forest cover of Vietnam from
was plantation. While the natural forest area of 1943 to 2017. Since our last Country Profile
Vietnam has declined over time (Table 1), the in 2012, the forest cover has increased from
plantation area has increased. Vietnam is thus one 40.10% to 41.45%. However, the quality of
of the very few developing tropical countries that natural forests continues to decrease, through
went through a forest transition, shifting from fragmentation and degradation. (UNREDD
declining to expanding forests at a national scale 2013). The natural forest area categorized as
(Matthews et al. 2014). Although the 5-Million- rich forest decreased by 10.2% in a period of
Hectare Reforestation Program (5MHRP), a 6 years from 1999 to 2005, and the amount of
national reforestation program began in 1998, medium quality forest declined by 13.4% over
ended in 2010, the National Forest Protection and the same period (Nguyen and Dang 2013). By
Development Plan and other policies (see Chapters 2012, rich, closed-canopy forests constituted
2 and 4) have helped Vietnam to achieve net only 4.6% of the total forest cover. Indeed,
reforestation over the last 5 years. The majority of the biodiverse lowland forests, have mostly
this impressive growth is the result of the expansion disappeared, particularly mangroves (UNREDD
of large-scale timber plantations, which accounts 2013). Forest-cover change, however, varied
for a quarter of all forest cover (FAO 2015). widely among regions due to specific socio-
However, as Pham (2017) highlighted, despite economic and environmental factors.
Table 1. Forest area of Vietnam by forest type (ha)
Total forest area Natural forest area Plantation forest area New plantation forest area
Year
(1000 ha) (1000 ha) (1000 ha) (1000 ha)
2008 13,118.8 10,348.6 2,770.2 342.7
2009 13,258.7 10,338.9 2,919.8 No data
2010 13,388.1 10,304.8 3,083.3 357.1
2011 13,515.1 10,285.4 3,229.7 377.0
2012 13,862.0 10,423.8 3,438.2 398.4
2013 13,954.4 10,398.1 3,556.3 396.0
2014 13,796.5 10,100.2 3,696.3 414.1
2015 14,0618 10,175.5 3,886.3 540.9
2016 14,377.6 10,242.1 4,135.5 No data
2017* 14,415.4 10,236.4 4,179.0 No data
Source: GSO (2017a); *MARD (2018a)2 | Pham Thu Thuy, Hoang Tuan Long, Nguyen Dinh Tien, Dao Thi Linh Chi, Ngo Ha Chau and Pham Viet Hong
50
45
40
Forest cover (%) 35
30
25
20
15
10
5
0
1943 1976 1980 1985 1990 1995 2000 2003 2006 2010 2012 2017
Year
Figure 1. Forest cover of Vietnam from 1943 to 2017
Source: Bach Thanh (2017)
Natural forest regrowth was highest in the households is still far from the original plan in
northern mountain provinces, especially over the which the government wants to transfer areas
period 1993–2003, while deforestation continued managed by ineffective state-owned companies to
in the Central Highlands and Southeast Region. households and communities. A large area of forest
Forest plantations increased most in mid-elevation taken from state-owned forest enterprises has not
provinces. This is because the government gave been transferred to communities (Do 2015).
significant support to reforesting bare land in the
north, while the timber industry mainly harvested According to Do (2015), a large area of
from the Central Highlands and Southeast remaining forests is not yet allocated to any
Region, where forests were still rich. Natural entity but currently managed by Commune
forests increased in areas designated as national People’s Committees.
parks and protected areas, while natural forest
outside these areas tended to decrease or stagnate
(Cochard et al. 2016). Natural forest regeneration 1.2 Review of the main drivers of
is difficult due to the isolation of the remaining forest-cover change
rich natural forest patches. Therefore, the carbon
stock enhancement in Vietnam is mainly due to 1.2.1 Direct drivers
forest plantations and regeneration of secondary
forests programs, (UNREDD 2013). Yet, between In 2012, our first Country Profile (Pham et
2010 and 2017, the forest area reserved for al. 2012) identified four main direct causes
biodiversity conservation or special-use forests of deforestation in Vietnam: (i) conversion to
has increased, while protected forest decreased in agriculture (particularly to industrial perennial
2016 (Pham 2017). crops); (ii) infrastructure development; (iii)
unsustainable logging (notably illegal logging);
Between 2005 and 2017, the forest area managed and (iv) forest fires. Most researchers from 2012
by state forest enterprises was reduced by more to 2017 reported similar findings and observed no
than 1.2 million hectares in line with government positive changes in the occurrence and impacts of
strategies to reduce ineffective state-owned these drivers. For example, Vu et al. (2014), Do
enterprises (SOEs) and allow more forest land for (2015) and Yang et al. (2016) found that logging
communities and households to leverage social (both legal and illegal), forest-land conversion for
support in forest protection and development infrastructure development, including hydropower
(Table 2). While the forest area managed by plants and aquaculture development, and
communities in 2017 has doubled since 2005, commercial crops are still the major causes of forest
the total area managed by communities and loss in Vietnam.The context of REDD+ in Vietnam | 3
Table 2. Forest area between 2005 and 2017
Forest categories 2005 2016 2017
Total forested area 12,616,700 14,377,682 14,415,381
I. By origin
Natural 10,283,173 10,242,141 10,236,415
Planted 2,333,526 4,135,541 4,178,966
II. By function
Special use 1,929,304 2,137,332 2,141,324
Protection 6,199,682 4,537,852 4,567,106
Production 4,487,714 6,672,056 6,765,936
Other N/A 1,030,442 941,015
Source: MARD (2005, 2017 and 2018a)
Table 3. Land-use change in Vietnam, 2012–2017 (1000 ha)
Type 2012 2013 2014 2015 2016 2017*
Agricultural land 26,371.5 26,822.9 27,281 27,302.2 27,284.9 26,898.14
Agricultural production 10,210.8 10,231.7 11,505.4 11,530.1 11,526.8 11,506.8
land
Paddy land 4,097.1 4,078.6 4,146.3 4,143.1 4,136.2 3,918.13
Forestry land 15,405.8 15,845.2 14,927.5 14,923.5 14,377.6 14,415.3
Aquaculture land 710 707.9 798.5 797.7 797.3 756.57
Source: GSO (2017a); GSO (2016)
Land conversion for agriculture Legal logging: Data from Vietnamnews.vn (2016b)
shows that about 300,000 ha of natural forest was
Agriculture is the main source of emissions and is harvested during 2010–2014. However, logging in
responsible for as much as 38.5% of greenhouse gas natural forests is mainly selective cutting. According
emissions, half of which come from rice cultivation. to Bui Chinh Nghia (2018), only 18,000 m3 timber
were harvested from plantation forest in 2017.
Between 2012 and 2017, the forest area slightly
declined, mainly due to conversion of forest land Figure 3 shows the gross output of wood by
to permanent trees (fruit trees) and infrastructure economic activity category from 2012 to 2016. The
construction (roads) (Table 3). However, with total gross output of wood increased from 5,251,000
Decision 419/QD-TTg dated 5 April 2017, m3 in 2012 up to 10,267,600 m3 in 2016. The
the Prime Minister commanded the Ministry of highest proportion of timber is produced by non-
Natural Resources and Environment (MONRE) state enterprises and other stakeholders, followed
to continue its review and adjust the land-use by state enterprises and then the foreign-investment
master plan and land-use plans to ensure the sector. Total wood production has tended to
target of 16.24 million hectares of forest land was increase steadily over time. The highest increase was
achieved by 2020. production by non-state enterprises. In 2016, this
production by non-state actors rose to 8,361,200
Logging m3, up 141% on 2012 and 32% on 2015.
Vietnam is increasing timber imports to meet Illegal logging: Deforestation processes in the
domestic demand and export goals. The gross output Central Highlands and Southeast Region were
of wood of Vietnam has slowly increased since 2003 mainly driven by cash crop expansion (coffee,
(Figure 2). rubber) and associated growth of immigration4 | Pham Thu Thuy, Hoang Tuan Long, Nguyen Dinh Tien, Dao Thi Linh Chi, Ngo Ha Chau and Pham Viet Hong
12000
Volume of wood (1000 m3) 10000
8000
6000
4000
2000
0
1995
2015
1996
1997
1998
1999
2000
2001
2002
2003
2004
2005
2006
2007
2008
2009
2010
2011
2012
2013
2014
2016
Year
Figure 2. The gross output of wood of Vietnam
Source: GSO 2017b
12000
10267.6
10000
9199.2
8361.2
8000 7701.4
Production (1000 m3)
6344.4
5908
6000 5251 5245.5
3940.6
4000 3460.3
2733.8
2356
1721.4 1890.6 1812.2
2000
69.3 76.8 99.9 121 94.2
0
2012 2013 2014 2015 2016
Year
TOTAL State Non-State: Foreign invested sector
Figure 3. Gross output of wood by economic activity category, 2012–2016
Source: GSO (2017b)
and population. Recent data trends indicated limits (VPA). However, there has been little progress
to further forest expansion, and logging within in regulating illegal timber imports. After the
high-quality natural forests reportedly remains a Decision No.82/2006/NĐ-CP dated August 10,
widespread problem (Cochard et al. 2016). The 2006, and Circular No.40/2013/TT-BNNPTNT
Vietnamese government has made some progress dated September 5, 2013, the list of wild fauna and
in tackling illegal logging and associated trade flora banned or limited for international trading
through agreements with Laos and Cambodia with special conditions was updated in Circular
and ratifying voluntary partnership agreements 04/2017/TT-BNNPTNT, February 24, 2017.The context of REDD+ in Vietnam | 5
Trade data discrepancies and analysis of trade 1995 and 2013 shows a gradual decrease over
flows indicate that illegal trade remains a serious time, the area slightly increased between 2013
problem in Vietnam (Saunders 2014). Although, and 2016. According to provincial interviewees,
in 2016, the Prime Minister requested that natural this increase was mainly due to drier seasons
forests be closed, illegal logging is still rampant and climate, and better data collection, with the
in the Central Highlands (Vietnamnet.vn 2017). application of improved technology that captures
Forest Trends (Sikor and To 2013) also found that fire-damaged areas more clearly and precisely.
despite the government’s political commitment
to reducing illegal logging and more effectively 1.2.2 Indirect drivers
enforcing the law, illegal logging is still widespread
in Vietnam with a range of actors from large-scale In 2012, Pham et al. (2012) found that indirect
and powerful connected networks to small-scale drivers of deforestation and degradation in
operators carrying out these illegal activities. Vietnam included the growing demand for forest
and agricultural products, ineffective management
Forest fire of state forest enterprises, weak governance at
local level, and weak land administration. These
In Vietnam, an average of 5,082 ha of forest was indirect drivers still operate, as confirmed by
burned each year from 2002 to 2010. In general, authors such as Van Khuc et al. (2018), Do
the area of forest lost fluctuates but follows a (2015) and Matthews et al. (2014). Do (2015),
downward trend. In 2016, about 3,320.8 ha of however, added other indirect drivers, such as
forest area was reported to have been lost to fire lack of recognition for local rights. The centrally
(Figure 4). Most of the fires occurred in plantation managed forest governance system excludes
and production forests, where harvesting of local people from participating in the decision
non-timber forest products (NTFPs), mainly making, denies them access to forest rights and
honey, inadvertently leads to fires. Slash-and-burn their forest-dependent livelihood (Ngo and
practices caused 60.8% of fires, and hunting, Mahdi, 2017). Furthermore, the Government of
honey and wood collecting led to 18% of fires; Vietnam (2017a) highlighted problems of social
5% were caused by accident or negligence, and conflict amongst households within communities,
11.2% had other causes (MARD 2010; Pham et amongst neighboring communities, and weak
al. 2012). While the forest area burned between monitoring and evaluation capacity.
25000
20000
Area (1000 ha)
15000
10000
5000
0
14
el. 5
16
07
08
09
10
11
12
13
03
04
05
06
99
00
01
02
95
96
97
98
1
20
20
20
20
20
20
20
20
20
20
20
20
20
20
20
20
20
19
19
19
19
19
Pr
Year
Area of fired forest Area of destroyed forest
Figure 4. Cleared forest area and burnt areas of Vietnam from 1995 to 2016
Source: GSO (2017b)6 | Pham Thu Thuy, Hoang Tuan Long, Nguyen Dinh Tien, Dao Thi Linh Chi, Ngo Ha Chau and Pham Viet Hong
In policy discourses, deforestation is often linked to Change to mark its commitment to reducing global
‘poor’ and ‘ethnic minority’ households and their GHG emissions and pursuing adaptation efforts
unsustainable practices, such as the expansion of (Box 1). Its Nationally Determined Contribution
coffee production (and other agricultural activities) (NDC) under the Paris Agreement states that the
into forest areas. However, Trædal and Vedeld (2017) country is working toward an 8% GHG emissions
demonstrate no clear linkages between poverty levels reduction compared to business as usual (BAU)
and unsustainable practices. In fact, the poorest by 2030, with the possibility of surpassing that
segments were found to deforest the least. The ways benchmark to reach 25% with international support.
in which current PES and REDD+ approaches are Vietnam’s national plan for implementation of its
designed do not provide appropriate solutions to NDC identified 68 primary, cross-sector activities,
address the underlying dimensions of these issues which include both adaptation and mitigation
(Trædal and Vedeld 2017). efforts. In 2016, the government issued Decision
No.2053/QD-TTg dated October 28, 2016, on the
Furthermore, the changes in the Land Law Plan for Implementation of the Paris Agreement on
2013 have contributed to a lower level of land Climate Change. This decision is based on:
conversion, as other underlying economic drivers • International Treaty Law No. 108/2016/QH13
have remained constant. Three distinct trends dated April 9, 2016
in the political economy of land conversion in • Resolution No.24-NQ/TW dated June 3,
Vietnam have emerged since 2012 (Wells-Dang et 2013, by the 7th Session of the 11th Central
al. 2016). First, the revision of the Land Law points Committee, on active response to climate
toward a re-centralization of authority to rein in change, enhancing resource management and
inconsistencies and shortcomings in Vietnam’s land environmental protection
policies that were widely viewed as risking social • Resolution No.08/NQ-CP in January 23,
stability. A second trend deals with changes in 2014, by the government, on the program to
Vietnamese agriculture that place increasing pressure execute Resolution No. 24-NQ/TW on active
on smallholder farmers. A third external force, responses to climate change, enhancing resource
with more uncertain effects, is Vietnam’s ongoing management and environmental protection
process of international and regional integration, in • Decision No. 1393/QD-TTg dated September
particular, its participation in trade and investment 25, 2012, by the Prime Minister, on approval of
agreements. The combination of these trends the Green Growth Strategy
suggests that the apparent stagnation in compulsory • Notice No.13/TB -VPCP dated January 1, 2016,
land requisition linked to the passage of the Land by the government, on the concluding remarks of
Law may be temporary in nature, and consequently Deputy Prime Minister Hoang Trung Hai on the
land-related disputes are likely to remain a key National Target Program to Respond to Climate
feature of Vietnamese society for some years to Change and Green Growth
come. The apparent slower pace of land conversion • Official Letter No.191/VPCP-QHQT, dated
and other real estate transactions, even in a context February 1, 2016, on the Prime Minister’s
of rapid economic growth, may thus be temporary as participation in Conference of the Parties (COP)
officials and business interests find their way around 21, and the outcomes of COP21 in France and
the law, and may possibly even result from a glut of visits to the Kingdom of Belgium and EU
of land from past deals, given a less active market. • Notice No.69/TB-VPCP by the Government
If the market picks up again, unresolved problems, Office Conclusions of Prime Minister Nguyen
such as state-determined land prices and mechanisms Xuan Phuc at the 12th meeting of National
for compensation and resettlement in cases of Committee for Climate Change, dated
compulsory requisition, will again rise to the fore. April 24, 2016.
The National Communications conducted by
1.3 Mitigation potential MONRE explored 18 mitigation options, including
9 options for the energy sector, 6 for forestry
Vietnam’s greenhouse gas (GHG) emissions sector and 3 for the agricultural sector (Table 4).
are relatively low in the global context, but are The mitigation potential from forestry sector is
increasing rapidly and will likely triple by 2030 if 3,221.6 million tCO2e accounting for the largest
no mitigation options are undertaken. In 2016, percentage of overall national mitigation potential
Vietnam ratified the Paris Agreement on Climate (Table 5).The context of REDD+ in Vietnam | 7
Box 1. Five main components of Vietnam’s plan for the implementation of the Paris Agreement
1. Mitigation of GHG emissions: Voluntary and compulsory mitigation activities in accordance with the
requirements of the Paris Agreement to achieve emission mitigation targets listed in the Intended
Nationally Determined Contribution (INDC) and to take advantage of the opportunity to develop the
economy in a low-carbon direction.
2. Adaptation to climate change: Adaptation activities, as committed to in the INDC, to improve
community resilience and conserve the livelihoods of citizens.
3. Implementation resources: Activities to develop human resources, develop and transfer technologies,
and mobilize financial resources to ensure fulfillment of commitments determined in the INDC and to
take advantage of opportunities for country development presented by the Paris Agreement.
4. Transparency system (monitoring, reporting, verification (MRV) system): To monitor and
supervise the mitigation of GHG emissions, adaptation to climate change and to ensure adequate
implementation resources.
5. Institutions and policies: To develop and revise legal documents, provide technical guidance; define
responsibilities of ministries, sectors and localities, and enhance coordination in handling regional and
inter-sectoral issues to ensure good implementation of the Paris Agreement.
Table 4. Contribution to GHG emissions mitigation from 1 January 2021 to 31 December 2030
Type of
GHG emissions reduction compared to the BAU
contribution
Coverage The entire economy, including the following sectors:
1. Energy
a. Fuel combustion:
−− Energy industries
−− Manufacturing industries and construction
−− Transport
−− Others: residential, agriculture and commercial services.
b. Fugitive emissions:
−− Coal mining
−− Natural gas and oil.
2. Agriculture
• Enteric fermentation
• Manure management
• Rice cultivation
• Agriculture soils
• Prescribed burning of savannas
• Field burning of agricultural residues.
3. Land Use, Land Use Change and Forestry (LULUCF)
• Forest land
• Cropland
• Grassland
• Wetlands
• Settlements
• Other land.
4. Waste
• Solid waste landfills
• Industrial wastewater
• Domestic wastewater
• Human waste
• Waste incineration.
continued on next page8 | Pham Thu Thuy, Hoang Tuan Long, Nguyen Dinh Tien, Dao Thi Linh Chi, Ngo Ha Chau and Pham Viet Hong
Table 4. Continued
BAU scenario Vietnam’s BAU scenario for GHG emissions was developed based on the assumption of
economic growth in the absence of climate change policies. The BAU is based on 2010 (the
latest year of the national GHG inventory) and includes the energy, agriculture, waste and
LULUCF sectors.
GHG emissions in 2010: 246.8 million tCO2e
Projections for 2020 and 2030 (not including industrial
processes):
•• 2020: 474.1 million tCO2e
•• 2030: 787.4 million tCO2e
Unconditional With domestic resources, by 2030, Vietnam will reduce GHG
contribution emissions by 8% compared to BAU, in which:
•• Emission intensity per unit of GDP will be reduced by 20%
•• compared to the 2010 levels
•• Forest cover will be increased to 45% coverage.
Conditional The above mentioned 8% contribution could be increased to 25% if international
contribution support is received through bilateral and multilateral cooperation, as well as through the
implementation of new mechanisms under the Global Climate Agreement, in which emission
intensity per unit of GDP will be reduced by 30% compared to 2010 levels.
Source: Vietnam INDC (2016)
Table 5. GHG mitigation and cost identified in the Initial National Communication
Mitigation potential Mitigation cost
Sector Options
(million tCO2e) (USD/tCO2e)
Energy Developing solar energy 26.1 6.01
sector Developing geothermal power 29.2 5.15
Wind power stations 34 4.64
Replacing coal-fired boilers in industry 10.2 3.65
Replacing oil-fired boilers in industry 3.4 -3.65
Improved coal cooking stoves 73 -4.15
Lean burn engines in transportation 21.9 -6.78
Improving efficiency of industrial motors 70 -7.19
Replace incandescent light bulbs with compact 16 -8.31
fluorescent light lamps
Total 283.8
Forestry Short-rotation reforestation 445.8 0.85
Long-rotation reforestation 496.1 0.61
Planting protection forests and special use forest 325.8 0.6
Scattered tree planting 278.7 0.29
Combination of forest rehabilitation and 372.6 0.25
delineation for regeneration
Protection of forest 1302.6 0.07
Total 3221.6
Agricultural Water management 105 13.12
Producing processed animal feed 8 5.19
Utilization of biogas 27.3 3.41
Total 140.3
Total 3645.7
Source: GreenID (2014)The context of REDD+ in Vietnam | 9
The government also issued Decision 419/QD- Green Growth Strategy, while the MONRE is the
TTg, dated 5 April 2017, on approval of the coordinating agency on GHG trade. By regulation,
National Action Program on the reduction of MONRE is the national focal point responsible
GHG emissions through reduction of deforestation for implementing the United Nations Framework
and forest degradation, sustainable management Convention on Climate Change (UNFCCC) and
of forest resources, and conservation and Kyoto Protocol, and is in charge of coordinating the
enhancement of forest carbon stocks (REDD+) activities of all ministries, sectors and provinces in
by 2030. For the period 2017–2020, the plan managing and implementing the National Target
aims to contribute to reducing GHG emissions Program to Respond to Climate Change (NTP-
through REDD+ activities; expand the forest RCC). NTP-RCC and the Vietnam Green Growth
cover to 42% and reach 14.4 million hectares of Strategy have different reduction targets but were
forest by 2020. For the period 2021–2030, the both approved by the Prime Minister in the form
plan aims to stabilize the natural forest area to the of decisions and thus have high enforceability.
same level as 2020, and increase forest cover up Such a situation causes confusion that influences
to 45% of the national territory, contributing to resource allocation. Clearly, there is a lack of
realizing the national target of reducing total GHG coordination between these two ministries in GHG
emissions by 8% by 2030 compared with BAU, as mitigation policies.
committed to in the Paris Agreement on Climate
Change. This contribution may increase to 25% According to stakeholders’ interviews, these three
with international support. reduction targets developed by three ministries are
inconsistent and based on a high uncertainty of
Under umbrella policies, major GHG emission- GHG inventories (Table 6). Different reference
related policies with different objectives and targets levels are used for the same time period. No
have been developed by different ministries: assessment of impact from implementation of GHG
Ministry of Agriculture and Rural Development targets on national development as part of the target
(MARD); Ministry Of Natural Resources and development has been made. The portfolio of actions
Environment (MONRE); Ministry of Planning to achieve the goals, however, is quite broad. These
and Investment (MPI) and sectors (see Table 4). would be described in the program or plan and in
more detail in a circular guiding the implementation.
The GHG emission targets mentioned in the Relevant agencies and stakeholders have insufficient
different legal documents are inconsistent. For technical capacity to implement the portfolio of
example, the reduction target set by the Study actions. Financing to implement these actions poses
on Management of Greenhouse Gas Emissions, critical issues that greatly influence the feasibility of
Management of Business of Carbon Credits does implementation. Although the national budget is an
not match with the Study on GHG Reduction in entry point, there is not yet a budget for this item.
Agriculture and Rural Area (20% versus 16%). Additionally, there is no monitoring system in place
Moreover, the MPI is the lead on the Vietnam to measure and verify implementation progress.
Table 6. GHG’s targets developed by MPI, MONRE and MARD
MPI target MONRE target MARD target
Target Reduce GHG emissions Reduce GHG emission by 20% by 2020
by 8–10%; by 2030.
Weaknesses Targets are not in line Unrealistic, and some interviewees Unrealistic and uncertain
with those of MONRE, stated that it described reduction as a large reduction in GHG
and are actually higher potential rather than reduction goals. emissions is expected to come
than other sectoral In setting the target, 2010 was selected from increasing afforestation.
targets for example as the base year and only policies Additionally, the baseline
target on energy that were issued after 2010 were reduction target was set
efficiency. considered in setting reduction target. higher than that applied
Targets by MONRE are set against the for Clean Development
2005 level and are therefore unrealistic. Mechanism (CDM) projects.
Source: Adapted from GreenID (2014)10 | Pham Thu Thuy, Hoang Tuan Long, Nguyen Dinh Tien, Dao Thi Linh Chi, Ngo Ha Chau and Pham Viet Hong
The development of a reduction target of all experts in GHG inventory at ministry and
three ministries has not involved consultation or sector levels. According to our government
participation of different government agencies interviewees, there is also a limited number
and has not involved cross-sectoral collaboration. of research, assessment and verification of
country specific emission factors. A focal agency
The national GHG inventory is constrained by responsible for the national inventory’s data
a lack of reliable of data and poor data collection collection, analysis, verification and updating has
processes. GreenID (2014) found that GHG not been established or designated. No archiving
inventories are broad and are associated with system been has developed and there is no a
high uncertainty. There is a shortage of technical quality control system in place.2 Institutional environment and
distributional aspects
2.1 Forest governance in Vietnam Two types of international agreements have been
signed: climate change agreements and trade
2.1.1 International agreements agreements. Climate change agreements will be
discussed later in this chapter and in Chapter 4,
The Government of Vietnam has recently signed but we focus on trade agreement in this section
a large number of important international and later in Chapter 3 for two reasons. First,
agreements (Table 7). While some see this as a these trade agreements have direct influence
sign of reform, Bach Thanh (2017) argues that on drivers of deforestation and degradation, as
it might be more due to politicians leveraging outlined in Chapter 1. Second, it is not only
international trade agreements to advance their the political economy of Vietnam but also the
own policy preferences. Thus, some of the political economy of the partners in the different
agreements might even be counterproductive. agreements that influences climate change.
Table 7. International agreements signed by the Government of Vietnam
International
Year Objectives
agreements/treaties
Nov 2011 Vietnam–Chile Free Trade Vietnam commits to dropping 87.8% the tariff rates (equivalent to 91.22%
Agreement (VCFTA) as of 2007) for Chile for 15 years. In exchange, Chile will eliminate tariffs
on goods accounting for 99.62% of the export value of Vietnam as of
2007 within 10 years; 81.8% export value and 83.54% of tariffs would be
eliminated immediately.
Aug 2014 The ASEAN–Australia– The aim of AANZFTA is sustainable economic growth in the region
New Zealand Free Trade by providing more liberal, facilitative and transparent market and
Area (AANZFTA) investment regimes among the 12 signatories to the Agreement.
Mar 2015 Vietnam–Laos Trade Apart from the Association of Southeast Asian Nations (ASEAN), Laos also
Agreement benefits from reciprocal access under the trade agreement between Laos
and Vietnam. There are 32 tariff lines with the 50% rate of the Common
Effective Preferential Tariff Scheme for the ASEAN Free Trade Area (AFTA),
while all other products are 0% rate, except for 155 tariff lines which fall
under the General Exceptions List of Vietnam.
May 2015 Vietnam–Korea Free Trade Vietnam has committed to add 265 tariff lines, with an import turnover
Agreement (VKFTA) from Korea of USD 917 million.
Korea’s commitment includes 506 items, of which 4 items have a current
most-favored nation rate of 0%. The other 502 items on which Korea
has agreed to eliminate the tariff have a total import turnover from
Vietnam of USD 324 million. Korea has pledged to provide eliminate
tariffs and quotas for key export commodities of Vietnam, such as fishery
products (frozen and canned shrimp, crab, fish), agricultural products
(garlic, ginger, honey, red beans and sweet potatoes, tropical fruits) and
industrial goods (textiles, garments and mechanical products).
continued on next page12 | Pham Thu Thuy, Hoang Tuan Long, Nguyen Dinh Tien, Dao Thi Linh Chi, Ngo Ha Chau and Pham Viet Hong
Table 7. Continued
International
Year Objectives
agreements/treaties
May 2015 Vietnam–Eurasian Vietnam has committed to open the market for about 90% of total tariff
Economic Union (EAEU) lines within a 10-year tariff reduction schedule. Tariff will be eliminated
Free Trade Agreement for products in the priority list of EAEU at the entry into force, including
agricultural commodities (such as beef, dairy products and wheat flour).
After 3–5 years, these will include processed meat and fish, electrical
machinery, machinery used in agriculture. Five years after entering
into force the products will include pork and chicken. For some special
products, tariff elimination will be no earlier than 2027 for petroleum, and
no longer than 10 years for iron and steel.
EAEU will also eliminate the tariff rate for approximately 90% of all tariff
lines. It will immediately eliminate 59% of total tariff lines. The import
tariff rate will be eliminated on agriculture, forestry and fishery products
of Vietnam (with a tariff quota of 10,000 tons) and some industrial goods,
such as rubber products, wood and furniture.
Nov 2015 ASEAN–China Free Trade The Framework Agreement on Comprehensive Economic Cooperation
Area (ACFTA) between ASEAN and China (the ACFTA Agreement) includes provisions
on economic cooperation. In November 2015, in a joint effort to move
ASEAN–China relations to a higher level, Parties agreed to sign on the
Protocol to Amend the Framework Agreement on Comprehensive
Economic Co-operation and Certain Agreements thereunder between the
ASEAN and the People’s Republic of China (the Protocol).
2016 The Law on Signing, This affirms Vietnam’s strict commitment to agreements that it has signed
Joining and Implementing with other countries, international organizations and foreign parties.
International Treaties or
International Treaties Law
Nov 2018 Trans-Pacific Strategic By eliminating or reducing 18,000 tariff lines on industrial as well as
Economic Partnership agricultural products, the TPP will provide greater access to major
(TPP) markets, especially the United States and Japan, and will boost the export
of some major product categories in which Vietnam enjoys comparative
advantages including forestry products.
The agreement elevates other TPP countries’ commitments and
brings them closer to those in the United States by ensuring measures
are taken to prevent illegal logging and associated trade. The TPP’s
Environment Chapter includes commitments to combat trade in illegally
harvested timber, including species protected under the Convention
on International Trade in Endangered Species of Wild Fauna and Flora
(CITES), as well as any other species taken or harvested illegally, regardless
of its source country. These commitments will be fully enforceable and
subject to dispute settlement, including trade sanctions. Other TPP
provisions establish commitments to fighting corruption, which is often a
key factor in the failure of countries’ forest governance schemes.
Oct 2016 Paris Agreement with Vietnam plans to reduce GHG emissions by 8% by 2030 and, with adequate
Resolution No. 93/NQ-CP support from the international community, is aiming at 25% reduction.
on 31 October
May 2017 Voluntary Partnership In order to issue FLEGT licenses as required by the VPA, Vietnam will build
Agreements (VPA) on existing national initiatives in forest governance to develop a robust
timber legality assurance system (VNTLAS). It commits to improving
transparency, accountability, legislative clarity and other aspects of
governance. VNTLAS will have the following elements: legality definition,
supply chain controls, verification of compliance, FLEGT licensing, internal
inspections and a feedback mechanism, and independent evaluation.
The scope of the VPA covers all export markets, as well as the domestic
market. Once the VNTLAS is operating as described in the VPA, Vietnam
will issue FLEGT licenses to timber products it exports to the EU.The context of REDD+ in Vietnam | 13
These international agreements brought both Vietnam’s experience also underscores the potential
opportunities and challenges for the country’s downside of trade and investment liberalization
economy, as well as forestry sector. without concomitant efforts to address domestic
institutions and standards. Efforts must be made
Opportunities. Some of these agreements have to ensure domestic players also capture a slice
helped to create legal reforms, improved legal of the gains. Indeed, the TPP’s focus on quality
clarity and improved the decision-making institutions and standards made the agreement
process to make it become more participatory. appealing to Vietnam, despite the difficulty of
For example, MARD introduced a new circular complying with a host of commitments on labor,
on timber supply chain controls, which brought environmental protection and SOEs. Vietnam
together previously scattered regulations into has a history of leveraging engagement with the
a more coherent framework. The VPA process international economic system – including joining
also increased the level of public disclosure of the WTO and signing major FTAs – to support
information through the Vietnamese NGO difficult domestic restructuring. These have been
FLEGT network, as well as policy dialogues more pretext than driving force; many in Vietnam
between state, non-state actors and the private would note that far more laws and regulations were
sector. These new international agreement have passed than were technically required to meet these
also helped Vietnam’s exports increased fourfold international commitments (Busch 2017).
from USD 45 billion in 2006 to USD 190 billion
in 2016. Over the same period, merchandize 2.1.2 National forestry policies and legal
trade as a share of GDP expanded from 127% in framework
2006 to 173% in 2016 (Busch 2017).
Since 2012, the Government of Vietnam has issued
Challenges. While the overall economy might many new (forestry) policies that significantly
improve, Vietnamese enterprises, which change the governance of the forestry sector (Table 8).
lacked competitiveness, did not gain much
from international agreements, such as WTO The above policies and laws are important for
ascension (Busch 2017). The potential collapse guiding the implementation of REDD+ and
of the TPP during early 2017 was a great emphasizing the need to avoid converting very poor
disappointment domestically, as those pushing natural forests to other land purposes, such as rubber
for further economic renovation had pinned and agricultural crops. In line with these policies, the
their hopes on the commitments and assistance Vietnamese government has allocated a budget for
they could expect under the TPP. Over the past sustainable forest management, forest protection and
15 years, Vietnam’s private sector has struggled development, reduction of deforestation and forest
to compete as the economy has become more degradation, conservation and enhancement of
open internationally (Busch 2017). The lack of forest carbon stock, as well as encouraging the legal
sufficient progress on tackling institutional and timber trade and enhancing added value for forest
policy impediments, such as expanding financial products. These policies show the government’s
inclusion or creating more effective land rights, quick responses and political commitment for forest
has reinforced the trend. Vietnam’s various protection. As a result, violations of law and illegal
FTAs and international trade arrangements also logging have been reduced and the management
make it difficult for the government to extend and protection of forest has been strengthened.
subsidies or special treatment to its small and The number of violations of the state regulations
medium-sized enterprises (SMEs), for example. on forest protection and development decreased by
Export-oriented foreign investment has been 21% in 2017, the damaged forest area decreased
attracted by an open trade regime and stable 71%, in comparison to 2016. However, the current
investment framework, but this has also limited forest policies framework still has major drawbacks.
incentives to build linkages to local suppliers
and service providers. The productivity and Inconsistent policies. One persistent problem is
share of domestic value of Vietnamese firms have the inconsistency among government policies,
actually declined as its economic integration which impedes effective forest protection
has increased. Addressing this is the primary in Vietnam. For example, in 2016, the government
economic challenge for Vietnamese policymakers issued a decision on the closure of forests.
today (Busch 2017). However, according to Ngo (2017), the forestYou can also read