Yellowstone Grizzly Bear Investigations 2011 - Report of the Interagency Grizzly Bear Study Team - National Park ...
←
→
Page content transcription
If your browser does not render page correctly, please read the page content below
Yellowstone Grizzly Bear Investigations 2011
      Report of the Interagency Grizzly Bear Study Team

                                                  Photo courtesy of Gary Pollock
Data contained in this report are preliminary and subject to change.
Please obtain permission prior to citation. To give credit to authors,
please cite the section within this report as a chapter in a book. Below
is an example:
Cain, S. 2012. Grand Teton National Park recreational use. Page
45 in F.T. van Manen, M.A. Haroldson, and K. West, editors.
Yellowstone grizzly bear investigations: annual report of the
Interagency Grizzly Bear Study Team, 2011. U.S. Geological
Survey, Bozeman, Montana, USA
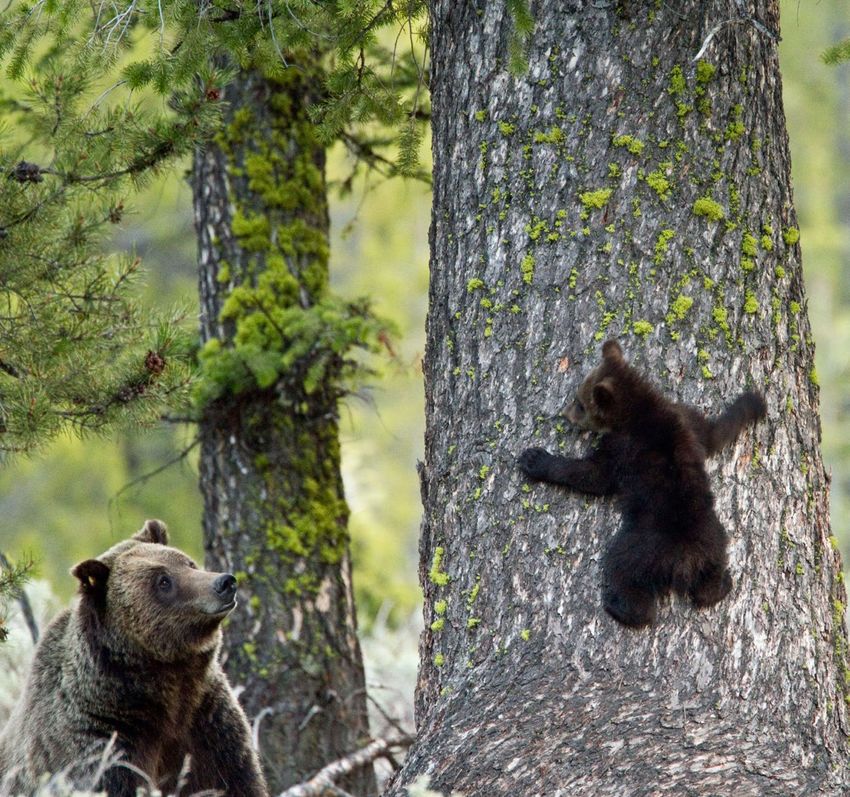
Cover photo: Bear 610 watches as one of her cubs climbs a tree. See “Cub Adoption Documented
in Grand Teton National Park.” Photo courtesy of Gary Pollock.
YELLOWSTONE GRIZZLY BEAR INVESTIGATIONS
Annual Report of the Interagency Grizzly Bear Study Team
                                2011

                        U.S. Geological Survey
                 Wyoming Game and Fish Department
                         National Park Service
                     U.S. Fish and Wildlife Service
                    Montana Fish, Wildlife and Parks
                          U.S. Forest Service
                  Idaho Department of Fish and Game
Eastern Shoshone and Northern Arapaho Tribal Fish and Game Department

   Edited by Frank T. van Manen, Mark A. Haroldson, and Karrie West

                    U.S. Department of the Interior
                       U.S. Geological Survey
                                2012
Table of Contents
INTRODUCTION..............................................................................................................................................       1
     This Report.............................................................................................................................................    1
     History and Purpose of the IGBST.........................................................................................................                   2
     Previous Research...................................................................................................................................        3

RESULTS AND DISCUSSION..........................................................................................................................                 4
     Bear Monitoring and Population Trend..................................................................................................                      4
		          Marked Animals..........................................................................................................................             4
		          Assessing Trend and Estimating Population Size from Counts of
		          Unduplicated Females.................................................................................................................               10
		          Cub Adoption Documented in Grand Teton National Park........................................................                                        16
		          Occupancy of Bear Management Units by Females with Young...............................................                                             18
		          Observation Flights.....................................................................................................................            19
		          Telemetry Relocation Flights......................................................................................................                  22
		          Estimating Sustainability of Annual Grizzly Bear Mortalities...................................................                                     23
     Key Foods Monitoring...........................................................................................................................            29
		          Spring Ungulate Availability and Use by Grizzly Bears in Yellowstone
		          National Park..............................................................................................................................         29
		          Spawning Cutthroat Trout...........................................................................................................                 32
		          Grizzly Bear Use of Insect Aggregation Sites Documented from Aerial
		          Telemetry and Observations.......................................................................................................                   36
		          Whitebark Pine Cone Production................................................................................................                      39
		          Use of Diminished Whitebark Pine Resources by Adult Female Grizzly Bears
		          in the Taylor Fork Area of the Gallatin National Forest, Montana, 2011...................................                                           41
     Habitat Monitoring.................................................................................................................................        45
		          Grand Teton National Park Recreational Use.............................................................................                             45
		          Yellowstone National Park Recreational Use.............................................................................                             46
		          Trends in Elk Hunter Numbers within the Grizzly Bear Recovery Zone
		          Plus the 10-mile Perimeter Area.................................................................................................                    47
     Grizzly Bear-Human Conflicts in the Greater Yellowstone Ecosystem.................................................                                         48

LITERATURE CITED........................................................................................................................................        53

Appendix A: Monitoring Whitebark Pine in the Greater Yellowstone Ecoregion: 2011
Annual Report Summary.................................................................................................................................... 60

Appendix B: 2011 Grizzly Bear Habitat Monitoring Report.................................................................. 66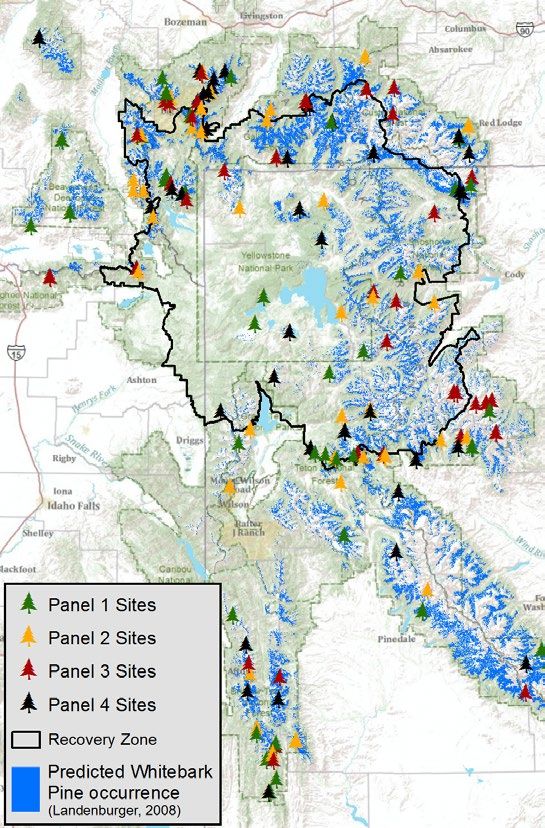
regard to potential impacts of whitebark pine (Pinus
             Introduction                                     albicaulis) decline on grizzly bears and vacated the
                                                              delisting rule (Greater Yellowstone Coalition v. State
(Mark A. Haroldson and Frank T. van Manen,                    of Wyoming, No. 09-36100 [9th Cir. 2011]). Although
Interagency Grizzly Bear Study Team)                          the change in status was upheld, we continue to
                                                              follow monitoring protocols established under the
This Report                                                   Revised Demographic Recovery Criteria (USFWS
        This Annual Report summarizes results of              2007b) and the demographic monitoring section of the
grizzly bear (Ursus arctos horribilis) monitoring             Final Conservation Strategy for the Grizzly Bear in
and research conducted in the Greater Yellowstone             the Greater Yellowstone Area (USFWS 2007c). The
Ecosystem (GYE) by the Interagency Grizzly Bear               IGBST will continue reporting on an array of required
Study Team (IGBST) during 2011. The report                    monitoring programs. These include both population
also contains a summary of nuisance grizzly bear              and habitat components. Annual population
management actions.                                           monitoring includes:
        The IGBST continues to work on research                   • Monitoring unduplicated females with COY
questions associated with counts of unduplicated                      and estimating total population size for the
females with cubs-of-the-year (COY). These counts                     entire GYE based on the model-averaged
are used to estimate population size, which are then                  Chao2 estimate of females with COY (see
used to establish annual mortality limits. Previous                   “Assessing Trend and Estimating Population
research demonstrated these counts are biased low                     Size Using Counts of Unduplicated Females”).
so the IGBST examined alternative techniques to                   • Monitoring the distribution of females with
estimate the number of unduplicated females with                      young of all ages and having a target of at least
COY. Results of an investigation into an approach                     16 of 18 Bear Management Units (BMUs)
using sequential clustering of female with COY                        within the Recovery Zone (i.e., Primary
sightings combined with Bayesian methods and                          Conservation Area (PCA)) occupied at least 1
ancillary data resampling was presented at a workshop                 year in every 6, and no 2 adjacent BMUs can
of study team members and quantitative ecologists in                  be unoccupied over any 6-year period (see
July 2011.                                                            “Occupancy of Bear Management Units by
        Although the method had promise, it was                       Females with Young”).
complex and depended on the assumption that the true              • Monitoring all sources of mortality for
density of female grizzly bears with COY within the                   independent (≥2 years old) females and males
ecosystem is known, information which we currently                    within the entire GYE. Mortality limits are set
lack. Population estimates varied considerably                        at ≤9% for independent females and ≤15% for
based on a range of inputs for the underlying density                 independent males from all causes. Mortality
and workshop participants concluded they could                        limits for dependent young are ≤9% for known
not support this approach at this time. The group                     and probable human-caused mortalities (see
considered an alternative approach based on a mark-                   “Estimating Sustainability of Annual Grizzly
recapture population estimate using sightings of radio-               Bear Mortalities”).
collared females with COY. The group endorsed this
approach in large part because it has the potential to                During 2011, demographic monitoring results
produce an unbiased estimate for the annual number of         triggered a Demographic Review, which entailed a
females with COY in the GYE. Work on this method              reanalysis of survival and fecundity for grizzly bear in
continued through 2011 and final results are expected         the GYE using data obtained during 2002–2011. The
at the end of 2012.                                           finding triggering the review provided evidence of a
        The grizzly bear was removed from protection          change in trajectory of annual estimates of females
under the Endangered Species Act on 30 April 2007             with COY (USFWS 2007b:page 8, number 19; also
(U.S. Fish and Wildlife Service [USFWS] 2007a) but            see “Assessing Trend and Estimating Population
relisted by a District Court order in 2009. During            Size Using Counts of Unduplicated Females” in
November 2011, the U.S Court of Appeals for the               this report). The Demographic Review was held in
9th Circuit upheld the lower court decision with              February 2012 in conjunction with a workshop on

                                                          1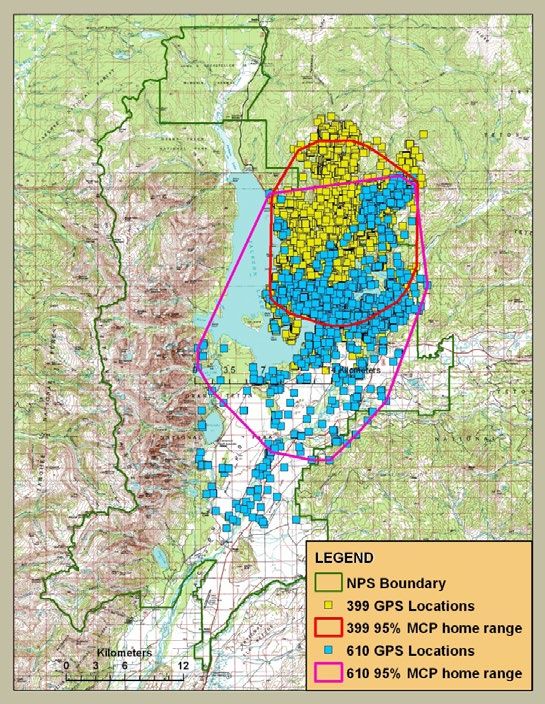
population estimation and mortality limits. Results of         1997–2000 showed a decline in cutthroat trout
the review are expected to be available during summer          use by grizzly bears when compared to earlier
2012.  Briefly, results indicated that annual population       work conducted by Reinhart (1990) in 1985–1987.
growth rate for the period 2002–2011 was stable (0%/           Consequently, the IGBST started a 3-year study to
year) to slightly increasing (2%/year), compared with          determine if spawning cutthroat trout continue to be
annual growth rates for the period 1983–2001 of 4              an important food for bears, or if the trout population
to 7% (Schwartz et al. 2006c). Our hypotheses for              has declined to the level that bears no longer use
potential causes of this change in population trajectory       this resource. If trout are no longer a useful food
include 1) density-dependent effects, 2) decline in            resource, we want to determine what geographical
available resources (i.e., whitebark pine decline), or         areas and alternative foods bears are using and if
3) a combination of density dependence and changes             those foods are an adequate replacement to maintain
in available resources. Additional work to evaluate            a healthy population. This project began in 2007 and
intrinsic and extrinsic factors influencing population         field work was completed in 2009. Two graduate
trend is planned for 2012.                                     students and several field technicians worked on this
         Habitat monitoring includes documenting the           research program.  One of these students finished
abundance of the 4 major foods throughout the GYE              her dissertation (Fortin 2011, available at https://
including winter ungulate carcasses, cutthroat trout           research.wsulibs.wsu.edu:8443/xmlui/bitstream/
(Oncorhynchus clarkii) spawning numbers, bear use              handle/2376/3011/Fortin_wsu_0251E_10250.
of army cutworm moth (Euxoa auxiliaris) sites, and             pdf?sequence=1) and has submitted 1 manuscript for
whitebark pine cone production. These protocols                publication. Her results indicate that cutthroat trout
have been monitored and reported by the IGBST for              are no longer an important food for grizzly bears
several years and are reported here. Additionally, we          living in the vicinity of Yellowstone Lake, and much
continue to monitor the health of whitebark pine in the        of that loss has been made up by feeding on neonate
ecosystem in cooperation with the Greater Yellowstone          elk (Cervus elaphus). The second student is expected
Whitebark Pine Monitoring Working Group. A                     to finish his dissertation in early 2012.
summary of 2011 monitoring is also presented                            The annual reports of the IGBST
(Appendix A). The protocol has been modified to                summarize annual data collection. Because
document mortality rate in whitebark pine from all             additional information can be obtained after
causes, including mountain pine beetle (Dendroctonus           publication, data summaries are subject to change.
ponderosae).                                                   For that reason, data analyses and summaries
         Although monitoring requirements under the            presented in this report supersede all previously
Conservation Strategy (USFWS 2007c) do not apply               published data. Descriptions of the study area and
since the GYE grizzly bear population was relisted,            sampling techniques are reported by Blanchard (1985),
the U.S. Forest Service will continue to report on             Mattson et al. (1991a), and Haroldson et al. (1998).
items identified in the Conservation Strategy including
changes in secure habitat, livestock allotments, and           History and Purpose of the IGBST
developed sites from the 1998 baseline levels in each                  It was recognized as early as 1973 that in
BMU subunit. This year, the 4th report detailing               order to understand the dynamics of grizzly bears in
this monitoring program is provided (Appendix B).              the GYE, there was a need for a centralized research
This report documents 1) changes in secure habitat,            group responsible for collecting, managing, analyzing,
open motorized access route density, and total                 and distributing information. To meet this need,
motorized route density inside the PCA; 2) changes             agencies formed the IGBST, a cooperative effort
in number and capacity of developed sites inside the           among the U.S. Geological Survey, National Park
PCA; 3) changes in number of commercial livestock              Service, U.S. Forest Service, U.S. Fish and Wildlife
allotments, changes in the number of permitted                 Service, and the state wildlife agencies of Idaho,
domestic sheep animal months inside the PCA, and               Montana, and Wyoming. The Eastern Shoshone and
livestock allotments with grizzly bear conflicts during        Northern Arapaho Tribal Fish and Game Department
the last 5 years.                                              formally joined the study team in 2009. The
         Results of DNA hair snaring work conducted            responsibilities of the IGBST are to: (1) conduct
on Yellowstone Lake (Haroldson et al. 2005) during             short- and long-term research projects addressing

                                                           2
information needs for bear management; (2) monitor              C. Hockenbary, S. Thompson, C. Whitman; National
the bear population, including status and trend,                Park Service: E. Albers, T. Bernacchi, D. Blanton,
numbers, reproduction, and mortality; (3) monitor               A. Bramblett, J. Carnes, L. Clarke, T. Coleman, S.
grizzly bear habitats, foods, and impacts of humans;            Consolo Murphy, M. Cromp, C. Daigle-Berg, N.
and (4) provide technical support to agencies and other         Derene, S. Dewey, S. Gunther, B. Helms, N. Herring,
groups responsible for the immediate and long-term              F. Madsen, P. Navaille, L. Quall, M. Renteria, J.
management of grizzly bears in the GYE. Additional              Sacklin, D. Smith, B. Speeg, D. Stahler, A. Tallian,
details can be obtained at our web site (http://www.            N. Welch, P.J. White, S. Wolff, B. Whitman; Montana
nrmsc.usgs.gov/research/igbst-home.htm).                        Fish, Wildlife and Parks: N. Anderson, S. Brozovich,
        Quantitative data on grizzly bear abundance,            D. Fagone, R. Gosse, C. Kline, J. Paugh, J. Ramsey,
distribution, survival, mortality, nuisance activity, and       M. Ross, S. Sheppard, J. Smith, J. Smolczynski, S.
bear foods are critical to formulating management               Stewart; Montana State University: S. Cherry, M.
strategies and decisions. Moreover, this information            Higgs; Wyoming Game and Fish: G. Anderson, K.
is necessary to evaluate the recovery process. The              Bales, M. Boyce, D. Brimeyer, B. Brown, R. Clapp,
IGBST coordinates data collection and analysis on an            C. Clark, D. Clause, C. Daubin, J. Davis, B. DeBolt,
ecosystem scale, prevents overlap of effort, and pools          D. Ditolla, L. Ellsbury, T. Fagan, T. Fergus, G. Fralick,
limited economic and personnel resources.                       M. Garcia, A. Johnson, T. Kreeger, B. Kroger, D.
                                                                Lasseter, S. Lockwood, B. Long, J. Longobardi, J.
Previous Research                                               Lund, D. McWhirter, K. Mills, D. Moody, J. Olsen,
         Some of the earliest research on grizzlies             C. Queen, S. Werbelow, D. Wilckens, M. Withroder;
within Yellowstone National Park was conducted by               Idaho Fish and Game: T. Fletcher, T. Imthurn, J.
John and Frank Craighead. The book, “The Grizzly                Koontz, G. Losinski, L. Meates, H. Miyasaki, A.
Bears of Yellowstone” provides a detailed summary of            Sorenson, T. Wendt; U.S. Forest Service: J. Chutz,
this early research (Craighead et al. 1995). With the           B. Davis, J. Harper, T. Matza, A. Pils, D. Probasco,
closing of open-pit garbage dumps and cessation of              D. Tyers; Pilots and Observers: B. Ard, S. Ard, H.
the ungulate reduction program in Yellowstone                   Leach, J. Martin, J. Ortman, K. Overfield, T. Schell,
National Park in 1967, bear demographics (Knight and            D. Stinson, R. Stradley; Wildlife Services: M. Foster,
Eberhardt 1985), food habits (Mattson et al. 1991a),            J. Rost; Shoshone and Arapaho Tribes: K. Smith,
and growth patterns (Blanchard 1987) for grizzly                B. Snyder Jr., W. Thayer, B. Warren; USFWS: P.
bears changed. Since 1975, the IGBST has produced               Hnilicka, M. Mazur. Without the collection efforts,
annual reports and numerous scientific publications             contributions, and dedication of all these people, the
summarizing monitoring and research efforts within              information contained within this report would not be
the GYE (for a complete list visit our web page http://         available.
www.nrmsc.usgs.gov/research/igbst-home.htm).                             Finally, we acknowledge the important
As a result, we now know much about the historic                contributions of Dr. Charles Schwartz, who retired in
distribution of grizzly bears within the GYE (Basile            the fall of 2011 after 14 years as Study Team leader.
1982, Blanchard et al. 1992), movement patterns                 A lot of good science in support of grizzly bear
(Blanchard and Knight 1991), food habits (Mattson               conservation in the GYE was accomplished under his
et al. 1991a), habitat use (Knight et al. 1984), and            leadership.
population dynamics (Knight and Eberhardt 1985,
Eberhardt et al. 1994, Eberhardt 1995, Schwartz et
al. 2006c). Nevertheless, monitoring and updating
continues so that status can be reevaluated annually.
         This report truly represents a “study team”
approach. Many individuals contributed either
directly or indirectly to its preparation. To that end,
we have identified author(s). We also wish to thank
the following individuals for their contributions
to data collection, analysis, and other phases of
IGBST research; U.S. Geological Survey: J. Ball,

                                                            3
There were 46 management captures of 46
  Results and Discussion                                         individual bears in the GYE during 2011 (Tables 1 and
                                                                 2), including 18 females (10 adult) and 28 males (19
                                                                 adult). Twenty-four individual bears (10 female, 14
Bear Monitoring and Population Trend                             male), were relocated due to conflict situations (Table
                                                                 1). There were 21 (7 female, 14 male) management
Marked Animals (Mark A. Haroldson and Chad                       removals. One bear (subadult female) captured in a
Dickinson, Interagency Grizzly Bear Study Team; and              management situation was released on site when the
Dan Bjornlie, Wyoming Game and Fish Department)                  mother and sibling could not be captured. One adult
                                                                 male initially captured at a management trap site was
        During the 2011 field season, 86 individual              relocated and subsequently captured at a research trap
grizzly bears were captured on 107 occasions                     site.
(Table 1), including 27 females (18 adult), 59 males                     We radio-monitored 92 individual grizzly
(44 adult). Forty individuals were new bears not                 bears during the 2011 field season, including 29 adult
previously marked.                                               females (Tables 2 and 3). Forty-eight grizzly bears
        We conducted research trapping efforts for               entered their winter dens wearing active transmitters.
591 trap days (1 trap day = 1 trap set for 1 day) in the         Five additional bears not found during the fall (Sep-
GYE. During research trapping operations we had 61               Nov) are considered missing (Table 3). Since 1975,
captures of 41 (9 female, 32 male) individual grizzly            689 individual grizzly bears have been radiomarked in
bears for a trapping success rate of 1 grizzly capture           the GYE.
every 9.7 trap days.

Table 1. Grizzly bears captured in the Greater Yellowstone Ecosystem during 2011.
Beara Sex       Age       Date       General locationb                 Capture type   Release siteb         Agencyc
668   Male      Adult     05/03/11   Greybull River, Pr-WY             Management     Bear Cr, State-WY     WYGF
669   Male      Subadult 05/07/11    Bufalo Fork, Pr-WY                Management     Mormon Cr, SNF        WYGF
624   Male      Adult     05/07/11   Grass Cr, State-WY                Management     Removed               WYGF
670   Male      Adult     05/11/11   Clark's Fork River, Pr-WY         Management     Bear Cr, State-WY     WYGF
671   Male      Adult     05/12/11   Clark's Fork River, Pr-WY         Management     Bear Cr, State-WY     WYGF
                          07/09/11   Dry Lake Cr, BTNF                 Research       On site               WYGF
672   Female    Subadult 05/14/11    Little Rock Cr, Pr-WY             Management     Mormon Cr, SNF        WYGF
673   Male      Adult     06/10/11   Papoose Cr, Pr-MT                 Research       On site               IGBST
674   Male      Adult     06/18/11   Pacific Cr, GTNP                  Research       On site               IGBST
G168 Male       Adult     06/20/11   South Fork Dick Cr, SNF           Research       On site               WYGF
G169 Male       Adult     06/21/11   Francs Fork, SNF                  Research       On site               WYGF
659   Male      Adult     06/24/11   Pacific Cr, GTNP                  Research       On site               IGBST
G170 Male       Subadult 06/26/11    Dick Cr, SNF                      Research       On site               WYGF
675   Male      Adult     06/27/11   Francs Fork, SNF                  Research       On site               WYGF
676   Female    Subadult 07/03/11    Marsh Cr, BTNF                    Management     On site               WYGF
677   Male      Adult     07/07/11   Papoose Cr, Pr-MT                 Research       On site               IGBST
678   Female    Adult     07/09/11   Grizzly Cr, BTNF                  Research       On site               WYGF
679   Male      Adult     07/13/11   Lizard Cr, GTNP                   Research       On site               IGBST
360   Female    Adult     07/15/11   Papoose Cr, Pr-MT                 Research       On site               IGBST

                                                             4
Table 1. Continued.
Beara Sex      Age      Date       General locationb            Capture type   Release siteb        Agencyc
G146 Male      Adult    07/16/11   Fish Cr, BTNF                Management     Removed              WYGF
G171 Male      Subadult 07/18/11   Dry Lake Cr, BTNF            Research       On site              WYGF
Unm   Female   Adult    07/18/11   Buttermilk Cr, Pr-MT         Management     Removed              MTFWP
680   Female   Subadult 07/20/11   Wyoming Cr, CTNF             Research       On site              IDFG
                        08/10/11   Wyoming Cr, CTNF             Research       On site              IDFG
                        08/20/11   Porcupine Cr, CTNF           Research       On site              IDFG
681   Male     Adult    07/26/11   Buck Cr, GNF                 Research       On site              IGBST
                        08/09/11   Buck Cr, GNF                 Research       On site              IGBST
                        08/18/11   Buck Cr, GNF                 Research       On site              IGBST
623   Male     Adult    07/26/11   Owl Cr, Pr-WY                Management     Reef Cr, SNF         WYGF
G152 Female    Adult    07/27/11   Wagon Cr, BTNF               Management     Removed              WYGF
682   Male     Adult    07/29/11   Dutch Joe Cr, BTNF           Management     Mormon Cr, SNF       WYGF
Unm   Male     Subadult 08/01/11   Bridge Cr, YNP               Management     Removed              YNP
683   Male     Subadult 08/04/11   Eldridge Cr, GNF             Research       On site              IGBST
                        08/08/11   Eldridge Cr, GNF             Research       On site              IGBST
                        08/10/11   Eldridge Cr, GNF             Research       On site              IGBST
593   Male     Adult    08/06/11   Wyoming Cr, CTNF             Research       On site              IDFG
416   Female   Adult    08/07/11   Deadhorse Cr, GNF            Research       On site              IGBST
G111 Female    Adult    08/07/11   South Fork Shoshone, Pr-WY   Management     Removed              WYGF
Unm   Male     Subadult 08/08/11   South Fork Shoshone, Pr-WY   Management     Removed              WYGF
Unm   Female   Subadult 08/08/11   South Fork Shoshone, Pr-WY   Management     Removed              WYGF
684   Male     Adult    8/11/11    Wyoming Cr, CTNF             Research       On site              IDFG
                        8/18/11    Wyoming Cr, CTNF             Research       On site              IDFG
685   Male     Adult    08/15/11   Crow Cr, WRR                 Research       On site              WYGF/WRR
586   Male     Adult    08/15/11   Crow Cr, WRR                 Research       On site              WYGF/WRR
686   Female   Adult    08/18/11   Eldridge Cr, GNF             Research       On site              IGBST
687   Male     Adult    08/18/11   Hominy Cr, CTNF              Research       On site              IGBST
G172 Male      Adult    08/18/11   Crow Cr, WRR                 Research       On site              WYGF
611   Male     Adult    08/20/11   Hominy Cr, CTNF              Research       On site              IGBST
377   Male     Adult    08/24/11   Strawberry Cr, BTNF          Management     Removed              WYGF
636   Male     Adult    08/28/11   Green River, BTNF            Management     Removed              WYGF
G173 Male      Adult    08/26/11   Middle Crow Cr, WRR          Research       On site              WYGF
524   Male     Adult    08/29/11   Wiggins Fork, SNF            Management     Mormon Cr, SNF       WYGF
G174 Male      Subadult 09/01/11   Warm Springs Cr, Pr-WY       Management     Clarks Fork River, SNF WYGF
423   Female   Adult    09/01/11   Sunlight Cr, Pr-WY           Management     Calf Cr, CTNF        WYGF
155   Male     Adult    09/02/11   Otter Cr, YNP                Research       On site              IGBST
281   Male     Adult    09/04/11   Cascade Cr, YNP              Research       On site              IGBST
                        09/06/11   Cascade Cr, YNP              Research       On site              IGBST
                        09/07/11   Cascade Cr, YNP              Research       On site              IGBST
                        09/08/11   Cascade Cr, YNP              Research       On site              IGBST
                        09/14/11   Alum Cr, YNP                 Research       On site              IGBST
                        09/17/11   Sour Cr, YNP                 Research       On site              IGBST

                                                          5
Table 1. Continued.
Beara Sex      Age      Date       General locationb            Capture type   Release siteb        Agencyc
394   Male     Adult    09/04/11   Cascade Cr, YNP              Research       On site              IGBST
                        09/06/11   Cascade Cr, YNP              Research       On site              IGBST
                        09/15/11   Cascade Cr, YNP              Research       On site              IGBST
                        09/16/11   Otter Cr, YNP                Research       On site              IGBST
546   Male     Adult    09/09/11   Bear Cr, Pr-MT               Management     Removed              WS/MTFWP
550   Male     Adult    09/11/11   Sunlight Cr, Pr-WY           Management     Removed              WYGF
211   Male     Adult    09/15/11   Cascade Cr, YNP              Research       On site              IGBST
                        09/16/11   Otter Cr, YNP                Research       On site              IGBST
                        09/19/11   Alum Cr, YNP                 Research       On site              IGBST
G120 Male      Adult    09/20/11   Wind River, SNF              Management     Removed              WYGF
448   Female   Adult    09/21/11   Arnica Cr, YNP               Research       On site              IGBST
                        10/02/11   Arnica Cr, YNP               Research       On site              IGBST
                        10/04/11   Arnica Cr, YNP               Research       On site              IGBST
688   Male     Subadult 09/21/11   Arnica Cr, YNP               Research       On site              IGBST
321   Female   Adult    09/22/11   Sour Cr, YNP                 Research       On site              IGBST
                        09/29/11   Sour Cr, YNP                 Research       On site              IGBST
689   Male     Subadult 09/22/11   Sour Cr, YNP                 Research       On site              IGBST
690   Female   Subadult 09/23/11   North Fork Shoshone, Pr-WY   Management     Squirrel Cr, CTNF    WYGF
Unm Female     Adult    09/28/11   Sour Cr, YNP                 Management     Removed              YNP/IGBST
Unm Male       Subadult 09/29/11   Sour Cr, YNP                 Management     Removed              YNP/IGBST
Unm Male       Subadult 09/29/11   Sour Cr, YNP                 Management     Removed              YNP/IGBST
691   Male     Subadult 09/30/11   Wolf Cr, Pr-MT               Management     Bear Cr, GNF         WS/MTFWP
692   Female   Subadult 10/04/11   South Fork Shoshone, Pr-WY   Management     Blackrock Cr, BTNF   WYGF
693   Female   Adult    10/04/11   Alum Cr, YNP                 Research       On site              IGBST
589   Male     Adult    10/04/11   Bridge Cr, YNP               Research       On site              IGBST
694   Female   Adult    10/07/11   Clarks Fork Yellowstone, Pr-WY Management   Boone Cr, CTNF       WYGF
337   Female   Adult    10/09/11   Clarks Fork Yellowstone, Pr-WY Management   Squirrel Cr, CTNF    WYGF
G175 Female    Subadult 10/09/11   Clarks Fork Yellowstone, Pr-WY Management   Squirrel Cr, CTNF    WYGF
G176 Female    Subadult 10/09/11   Clarks Fork Yellowstone, Pr-WY Management   Squirrel Cr, CTNF    WYGF
G177 Female    Subadult 10/09/11   Clarks Fork Yellowstone, Pr-WY Management   Squirrel Cr, CTNF    WYGF
517   Female   Adult    10/14/11   South Fork Shoshone, Pr-WY   Management     Bailey Cr, BTNF      WYGF
G178 Male      Subadult 10/13/11   South Fork Shoshone, Pr-WY   Management     Bailey Cr, BTNF      WYGF
G179 Male      Subadult 10/13/11   South Fork Shoshone, Pr-WY   Management     Bailey Cr, BTNF      WYGF
204   Male     Adult    10/15/11   Flat Mountain Cr, YNP        Research       On site              IGBST
G141 Male      Adult    10/17/11   Pine Cr, Pr-MT               Management     Removed              WS/MTFWP
541   Female   Adult    10/17/11   Flat Mountain Cr, YNP        Research       On site              IGBST
465   Male     Adult    10/19/11   South Fork Shoshone, Pr-WY   Management     Reef Cr, SNF         WYGF
Unm Male       Adult    10/21/11   Box Cr, BTNF                 Management     Removed              WYGF
695   Male     Subadult 10/28/11   Gibbon River, YNP            Research       On site              IGBST
628   Female   Adult    10/30/11   South Fork Shoshone, Pr-WY   Management     Removed              WYGF
566   Male     Adult    10/30/11   Gibbon River, YNP            Research       On site              IGBST
515   Male     Adult    10/30/11   Gibbon River, YNP            Research       On site              IGBST

                                                           6
Table 1. Continued.
Beara Sex Age Date General locationb Capture type Release siteb Agencyc
696 Male Adult 11/04/11 Pat O'Hara Cr, Pr-WY Management Gulf Cr, CTNF WYGF
666 Female Adult 11/06/11 Wind River, Pr-WY Management Removed WYGF
552 Male Adult 11/11/11 Pat O'Hara Cr, Pr-WY Management Sheffield Cr, BTNF WYGF
Unm Male Adult 11/11/11 South Fork Shoshone, State-WY Management Removed WYGF
a
Unm = unmarked.
b
BTNF = Bridger-Teton National Forest, CTNF = Caribou-Targhee National Forest, GNF = Gallatin National Forest, GTNP = Grand Teton National
Park, SNF = Shoshone National Forest, YNP = Yellowstone National Park, Pr = private.
c
IDFG = Idaho Fish and Game; IGBST = Interagency Grizzly Bear Study Team, USGS; MTFWP = Montana Fish, Wildlife and Parks; WRR = Wind
River Reservation; WS = Wildlife Services; WYGF = Wyoming Game and Fish; YNP = Yellowstone National Park.
Bear 673 at capture site, 2011. IGBST photo.
7Table 2. Annual record of grizzly bears monitored, Table 3. Grizzly bears radio monitored in the Greater
captured, and transported in the Greater Yellowstone Yellowstone Ecosystem during 2011.
Ecosystem since 1980. Monitored
Total captures
Number Individuals Out of Into Current
Year monitored trapped Research Management Transports Bear Sex Age Offspringa den den Status
1980 34 28 32 0 0 155 M Adult No Yes Active
1981 43 36 30 35 31 204 M Adult No Yes Active
1982 46 30 27 25 17 211 M Adult No Yes Active
1983 26 14 0 18 13 227 M Adult Yes No Cast
1984 35 33 20 22 16 281 M Adult No Yes Active
1985 21 4 0 5 2 315 F Adult Not seen Yes No Cast
1986 29 36 19 31 19 321 F Adult 1 yearling No Yes Active
1987 30 21 15 10 8 323 M Adult Yes No Cast
1988 46 36 23 21 15 332 F Adult None Yes Yes Active
1989 40 15 14 3 3 337 F Adult 3 COY Yes Yes Active
1990 35 15 4 13 9 360 F Adult None No No Cast
1991 42 27 28 3 4 394 M Adult No Yes Active
1992 41 16 15 1 0 400 M Adult Yes Yes Active
1993 43 21 13 8 6 416 F Adult None No Yes Active
1994 60 43 23 31 28 423 F Adult None No Yes Active
1995 71 39 26 28 22 448 F Adult None Yes Yes Active
1996 76 36 25 15 10 465 M Adult No Yes Active
1997 70 24 20 8 6 481 F Adult None Yes Yes Active
1998 58 35 32 8 5 493 M Adult No No Cast
1999 65 42 31 16 13 515 M Adult No Yes Active
2000 84 54 38 27 12 517 F Adult None Yes Yes Active
2001 82 63 41 32 15 524 M Adult No Yes Active
2002 81 54 50 22 15 526 M Adult Yes No Cast
2003 80 44 40 14 11 533 F Adult Not seen Yes No Cast
2004 78 58 38 29 20 541 F Adult None No Yes Active
2005 91 63 47 27 20 552 M Adult No Yes Active
2006 92 54 36 25 23 556 M Adult Yes No Cast
2007 86 65 54 19 8 566 M Adult Yes Yes Active
2008 87 66 39 40 30 586 M Adult No No Cast
2009 97 79 63 34 25 587 M Adult Yes No Cast
2010 85 95 36 75 52 589 M Adult Yes No Cast
2011 92 86 61 46 24 593 M Adult No Yes Active
594 M Adult Yes No Cast
611 M Adult No Yes Active
613 F Adult Not seen No No Cast
8Table 3. Continued. Table 3. Continued.
Monitored Monitored
Out of Into Current Out of Into Current
Bear Sex Age Offspringa den den Status Bear Sex Age Offspringa den den Status
618 M Adult Yes No Cast 676 F Subadult No Yes Active
620 F Adult 2 yearlings Yes No Cast 677 M Adult No Yes Active
622 M Adult Yes No Cast 678 F Adult None No Yes Active
623 M Adult No Yes Active 679 M Adult No No Missing
627 F Adult 2 2-year-olds Yes Yes Active 680 F Subadult No Yes Active
628 F Adult None Yes No Removed 681 M Adult No Yes Active
630 M Adult Yes No Cast 682 M Subadult No Yes Active
631 F Adult Not seen Yes No Missing 683 M Adult No Yes Active
636 M Adult Yes No Cast 684 M Adult No Yes Active
643 M Adult Yes No Cast 685 M Adult No Yes Active
644 M Adult Yes No Cast 686 F Adult None No Yes Active
645 F Adult None Yes Yes Active 687 M Adult No Yes Active
647 M Subadult Yes No Cast 688 M Subadult No Yes Active
648 M Adult Yes No Cast 689 M Subadult No Yes Active
650 F Adult Not seen Yes No Cast 690 F Subadult No Yes Active
653 M Subadult Yes No Cast 691 M Subadult No No Missing
655 M Subadult Yes No Cast 692 F Subadult No Yes Active
656 M Subadult Yes No Cast 693 F Adult No Yes Active
657 M Subadult Yes No Cast 694 F Subadult No Yes Active
658 F Adult 2 COY Yes Yes Active 695 M Subadult No Yes Active
659 M Adult Yes Yes Active 696 M Adult No No Missing
661 F Adult 1 COY Yes Yes Active
662 F Adult None Yes Yes Active
663 F Adult None Yes Yes Active
664 M Adult Yes No Cast
665 F Adult None Yes No Cast
666 F Adult None Yes No Removed
667 F Adult Not seen Yes No Cast
668 M Adult No No Cast
669 M Subadult No No Cast
670 M Adult No No Cast
671 M Adult No No Missing
672 F Subadult No Yes Active
673 M Adult No Yes Active
674 M Adult No No Cast
675 M Adult No No Cast
9Assessing Trend and Estimating Population Size Thus the population size at time zero is estimated as
from Counts of Unduplicated Females (Mark A.
Nˆ 0 exp(βˆ 0 ) and the rate of population change is
=
Haroldson, Interagency Grizzly Bear Study Team)
λˆ exp(βˆ ) , giving Nˆ=
estimated as= i Nˆ 0 λˆ yi . The
Methods quadratic model:
Under the Revised Demographic Recovery Ln( Nˆ Chao 2 ) =β 0 + β1 yi + β 2 yi2 + ε i ,
Criteria (USFWS 2007b) of the Grizzly Bear
Recovery Plan (USFWS 1993), IGBST is tasked is included to detect changes in trend. Model
with estimating the number of females with COY, AIC (Akaike Information Criterion) will favor the
determining trend in this segment of the population, quadratic model if the rate of change levels off or
and estimating size of specific population segments to begins to decline (IGBST 2006, Harris et al. 2007).
assess sustainability of annual mortalities. The area This process smoothes variation in annual estimates
within which the revised criteria apply for counting that result from sampling error or pulses in numbers
females with COY and mortalities is referenced of females producing cubs due to natural processes
in Figure 1 of the Revised Demographic Criteria (i.e., process variation). Some changes in previous
(USFWS 2007b). However, the area referenced in model-averaged estimates for unduplicated females
this figure is incorrect on its western and northern
boundaries in Montana and will be corrected with an with COY ( Nˆ MAFC ) are expected with each additional
erratum (C. Servheen, U.S. Fish and Wildlife Service, year of data. Retrospective adjustments to previous
personal communication). Specific procedures used to estimates are not done (IGBST 2006). Demographic
accomplish the above mentioned tasks are presented in Recovery Criterion 1 (USFWS 2007b) specifies a
IGBST (2005, 2006) and Harris et al. (2007). Briefly, minimum requirement of 48 females with cubs for
the Knight et al. (1995) rule set is used to differentiate the current year ( Nˆ MAFC ). Model-averaged estimates
an estimate for the number of unique females with below 48 for 2 consecutive years will trigger a biology
COY ( Nˆ Obs ) and tabulate sighting frequencies for each and management review, as will a shift in AIC that
family. We then apply the Chao2 estimator (Chao favors the quadratic model (i.e., AICc weight > 0.50,
1989, Wilson and Collins 1992, Keating et al. 2002, USFWS 2007a).
Cherry et al. 2007) Given the assumption of a reasonably stable
sex and age structure, trend for the females with COY
represents the rate of change for the entire population
f 2 − f1
Nˆ Chao 2= m + 1 , (IGBST 2006, Harris et al. 2007). It follows that
2( f 2 + 1) estimates for specific population segments can be
where m is the number of unique females sighted derived from the Nˆ MAFC and the estimated stable age
randomly (i.e., without the aid of telemetry), f1 is the structure for the population. Estimates for specific
number of families sighted once, and f2 is the number population segments and associated confidence
families sighted twice. This estimator accounts for intervals follow IGBST (2005, 2006). Thus, the total
individual sighting heterogeneity and produces an number of females ≥2 years old in the population is
estimate for the total number of females with COY estimated by
present in the population annually.
Next, we estimate trend and rate of change Nˆ MAFC
(λ) for the number of unique females with COY in Nˆ females 2+ = ,
(0.289*0.77699)
the population from the natural log (Ln) of the annual
Nˆ Chao 2 estimates using linear and quadratic regressions where 0.289 is the proportion of females ≥4 years old
with model averaging (Burnham and Anderson 2002). accompanied by COY from transition probabilities
(IGBST 2005), and 0.77699 is the ratio of 4+ female
The linear model for Ln( Nˆ Chao 2 ) with year (yi) is: to 2+ females in the population (IGBST 2006). Using
the model averaged results in these calculations has
Ln( Nˆ Chao 2 ) =β 0 + β1 yi + ε i . the effect of putting the numerator ( Nˆ MAFC ) on the
10same temporal scale as the denominator (i.e., mean where 2.04 is the mean number of COY/litter
transition probability and ratio) which smoothes (Schwartz et al. 2006a) and 0.638 is the mean survival
estimates and alleviates extreme variation which are rate for COY (Schwartz et al. 2006b). Estimates of
likely uncharacteristic of the true population (IGBST uncertainty associated with parameters of interest
2006, Harris et al. 2007). The number of independent were derived from the delta method (Seber 1982:7) as
aged males is given by described in IGBST (2006).
Nˆ males 2+ = Nˆ females 2+ *0.63513 , 2011 Results
where 0.63513 is the ratio of independent We documented 134 verified sightings of
males:independent females (IGBST 2006). The females with COY during 2011 within the area where
number of dependent young is estimated by the revised demographic criteria apply (Fig. 1). Most
observations were obtained opportunistically via
Nˆ dependent
= {Nˆ MAFC , t + [( Nˆ MAFC , t −1 )(0.638)]}2.04 ground observers (62.7%), with aerial observation
young
providing 36.5% of sightings (Table 4). Only 37% of
Fig. 1. Distribution of 134 observations of 39 (indicated by unique symbols) unduplicated female grizzly bears with cubs-of-
the-year (COY) in the Greater Yellowstone Ecosystem during 2011. The outer dark blue line represents the boundary for
conservation management within which females with COY are counted for estimation of trend and population size. Known
and probable mortalities are also counted within this line for evaluation of sustainable mortality. The inner red and yellow
boundaries indicate the Yellowstone grizzly bear Recovery Zone and National Park Services lands, respectively.
11Table 4. Method of observation for female grizzly bears with cubs-of-the-year sighted in the Greater
Yellowstone Ecosystem during 2011.
Method of observation Frequency Percent Cumulative percent
Fixed wing – other researcher 7 5.2 5.2
Fixed wing – observation 31 23.1 28.4
Fixed wing - telemetry 11 8.2 36.6
Ground sighting 84 62.7 99.3
Trap 1 0.7 100.0
Total 134 100.0
the observations of 5 unique females occurred within in an IGBST Workshop Summary that we expect
the boundaries of Yellowstone National Park. This will be available during Summer 2012. However,
result is much lower than the 74% of the observations stated briefly, we use vital rates derived from grizzly
and 20 unique females that were sighted in the bears radio monitored during the period 2002–2011
Park during 2010. We were able to differentiate 39 and repeated analyses used previously (Schwartz et
unduplicated females from the 134 sightings using al. 2006c) to estimate the population trajectory (λ).
the rule set described by Knight et al. (1995). Total Results indicate that trajectory has changed and the
number of COY observed during initial sightings was population growth rate for the recent period is now
74 and mean litter size was 1.90 (Table 5). There were stable to slightly increasing. This corroborates the
13 single cub litters, 17 litters of twins, and 9 litters of
results indicated by our Nˆ Chao 2 regression analysis,
triplets seen during initial observations (Table 5).
and is in contrast to estimated growth rates of 4–7%
One-hundred twenty-three observations of 39
per years during the decades of the 1980s and 1990s
families were obtained without telemetry (Table 6).
(Schwartz et al. 2006c). We hypothesized these
Using the sighting frequencies associated with these
changes in population growth may be attributed
families our 2011 Nˆ Chao 2 = 47 (Table 6). The model- to 1) density-dependent effects, 2) declines in key
food resource such as whitebark pine seeds, or 3) a
averaged point estimate ( Nˆ MAFC ) was 56 (95% CI
combination of density-dependent effects and resource
45–68) and exceeded the demographic objective of
decline.
48 specified in the demographic criteria for the GYE
(USFWS 2007a). Our 2011 estimated population size
derived from Nˆ MAFC was 593 (Table 7).
We use the annual Nˆ Chao 2 for the period
1983–2011 (Table 6) to estimate the rate of population
change (Fig. 2) for female with COY segment of the
population. For the first time since we began using
an information-theoretical approach and competing
linear and quadratic models, AICc weights (Table 8)
exhibited more support for the quadratic (51%) than
the linear (49%) model. However, the estimated
quadratic effect (-0.00110, SE = 0.00067) was not
significant (P = 0. 11554). As required in the Revised
Demographic Criteria (USFWS 2007b), this result
triggered a demographic review. This review took Female grizzly with 2 COY on buried bison carcass in
place in February 2012 and results will be reported Cottongrass Creek, YNP, 30 Aug 2011. Photo courtesy of Steve
Ard.
12Table 5. Number of unduplicated females with cubs-of-the-year ( Nˆ Obs ), litter frequencies, total number
of cubs, and average litter size at initial observation for the years 1983–2011 in the Greater Yellowstone
Ecosystem.
Litter sizes
Total 1 2 3 4 Total # Mean litter
Year N̂ Obs sightings cub cubs cubs cubs cubs size
1983 13 15 6 5 2 0 22 1.69
1984 17 41 5 10 2 0 31 1.82
1985 9 17 3 5 1 0 16 1.78
1986 25 85 6 15 4 0 48 1.92
1987 13 21 1 8 4 0 29 2.23
1988 19 39 1 14 4 0 41 2.16
1989 16 33 7 5 4 0 29 1.81
1990 25 53 4 10 10 1 58 2.32
1991a 24 62 6 14 3 0 43 1.87
1992 25 39 2 12 10 1 60 2.40
1993 20 32 4 11 5 0 41 2.05
1994 20 34 1 11 8 0 47 2.35
1995 17 25 2 10 5 0 37 2.18
1996 33 56 6 15 12 0 72 2.18
1997 31 80 5 21 5 0 62 2.00
1998 35 86 9 17 9 0 70 2.00
1999 33 108 11 14 8 0 63 1.91
2000 37 100 9 21 7 0 72 1.95
2001 42 105 13 22 7 0 78 1.86
2002 52 153 14 26 12 0 102 1.96
2003 38 60 6 27 5 0 75 1.97
2004 49 223 14 23 12 0 96 1.96
2005 31 93 11 14 6 0 57 1.84
2006 47 172 12 21 14 0 96 2.04
2007 50 335 10 22 18 0 108 2.16
2008 44 118 10 28 6 0 84 1.91
2009 42 117 10 19 11 2 89 2.12
2010 51 286 15 23 12 1 101 1.98
2011 39 134 13 17 9 0 74 1.90
a
One female with unknown number of cubs. Average litter size was calculated using 23 females.
13Table 6. Annual estimates for the numbers of females with cubs-of-the-year in the Greater Yellowstone
Ecosystem grizzly bear population, 1983–2011. The number of unique females observed ( Nˆ Obs ) includes
those located using radio-telemetry; m gives the number of unique females observed using random sightings
only; and Nˆ Chao 2 gives the nonparametric bias-corrected estimate, per Chao (1989). Also included are f1, the
number of families sighted once, f2, the number of families sighted twice, and an annual estimate of relative
sample size ( n Nˆ Chao 2 ), where n is the total number of observations obtained without the aid of telemetry.
Year Nˆ Obs m f1 f2 Nˆ Chao 2 n n Nˆ Chao 2
1983 13 10 8 2 19 12 0.6
1984 17 17 7 3 22 40 1.8
1985 9 8 5 0 18 17 0.9
1986 25 24 7 5 28 82 3
1987 13 12 7 3 17 20 1.2
1988 19 17 7 4 21 36 1.7
1989 16 14 7 5 18 28 1.6
1990 25 22 7 6 25 49 2
1991 24 24 11 3 38 62 1.6
1992 25 23 15 5 41 37 0.9
1993 20 18 8 8 21 30 1.4
1994 20 18 9 7 23 29 1.3
1995 17 17 13 2 43 25 0.6
1996 33 28 15 10 38 45 1.2
1997 31 29 13 7 39 65 1.7
1998 35 33 11 13 37 75 2
1999 33 30 9 5 36 96 2.7
2000 37 34 18 8 51 76 1.5
2001 42 39 16 12 48 84 1.7
2002 52 49 17 14 58 145 2.5
2003 38 35 19 14 46 54 1.2
2004 49 48 15 10 58 202 3.5
2005 31 29 6 8 31 86 2.8
2006 47 43 8 16 45 140 3.3
2007 50 48 12 12 53 275 5.1
2008 44 43 16 8 56 102 1.8
2009 42 39 11 11 44 100 2.3
2010 51 51 11 9 56 256 4.6
2011 39 39 14 10 47 123 2.6
14Table 7. Estimates and 95% confidence intervals Table 8. Parameter estimates and model selection
(CI) for population segments and total grizzly bear results from fitting the linear and quadratic models
population size for 2011 in the Greater Yellowstone
Ecosystem. for Ln( Nˆ Chao 2 ) with years for the period 1983–2011.
95% CI
Standard
Estimate Variance Lower Upper Model Parameter Estimate Error t value Pr(>t)
Independent females 248 472.1 205 290 Linear
Independent males 157 340.9 121 194 β0 2.94920 0.08889 33.17797Cub Adoption Documented in Grand Teton National Grizzly #399 was first encountered during
Park (Steve Cain and Kate Wilmot, Grand Teton a 2001 research capture as a 5-year-old. She was
National Park; and Mark A. Haroldson, Interagency captured 7 more times through 2005 and wore radio
Grizzly Bear Study Team) collars for a total of 55 months (VHF 13 mos, GPS
42 mos) during that time. Her home range, estimated
During summer 2011, grizzly bear #610 using a 95% minimum convex polygon (MCP) and
adopted one of her mother’s COY in Grand Teton GPS locations (n = 7,690) collected from 5 May
National Park (GTNP). Grizzly #610’s mother is 2003 to 25 August 2006, was centered approximately
bear #399, well known because she often forages and on Pilgrim Mountain, about 8 km north of Jackson
rests within 100 m of park roads in full view of park Lake Lodge (Fig. 3). Since 2008, direct observations
visitors. Grizzly #610 is from #399’s 2006 litter and indicate her range has expanded to include southern
is also a well known habituated bear. As an adult reaches of the park to the Gros Ventre River. She was
she established a home range largely overlapping observed with 1 COY in May 2004 that apparently did
her mother’s (Fig. 3). In spring of 2011, both bears not survive the summer and 3 COY in 2006 which all
emerged with COY, #399 with 3 and #610 with 2. The survived to weaning in 2008. She was not observed
adult females were identifiable by ear tags (399 = red, with cubs again until 2011.
610 = yellow), their home ranges, habituated behavior, Grizzly #610 was first captured as a 3-year-
and individual markings (399 has an identifying scar old during 2009 black bear research trapping in the
on her nose). In late July #610 was observed with 3 southern end of GTNP. At that time she was presumed
COY and a few days later #399 with only 2. The extra and later confirmed through genetic analyses to be
cub stayed with #610 all summer, and DNA analyses #399’s daughter. She was recaptured but not handled
later confirmed that one of #610’s 3 cubs was #399’s later that year and cast her first and only radio collar
by birth. to date in August 2010. Her 95% MCP home range
estimated using GPS locations collected from 27
June 2009 to 2 August 2010 (n = 2,192) overlapped
399’s home range and was centered on the Willow
Flats area, immediately west of Jackson Lake Lodge
(Fig. 3). During fall 2011 she expanded this area by
making additional movements to the south including
the Moose-Wilson road corridor, Blacktail Butte, and
Antelope Flats areas, all within GTNP.
In an attempt to obtain DNA samples and
confirm origin of the suspected adopted COY, we
set up hair snares in 2 areas frequented by #610,
one with a wire at cub height (~25 cm) and a second
wire at adult height (~60 cm), another with just 1
wire at cub height. We baited the sites with small
amounts of pronghorn (Antilopcapra americana)
or elk blood, rumen contents, organs, or skeletal
muscle rubbed on trees and downed logs within each
hair corral and deployed remote cameras focused
on these areas. Photographs of an adult grizzly bear
with yellow ear tags accompanied by 3 COY verified
that on 20 October 2011 grizzly #610 and 3 cubs
visited our 1-wire site (Fig. 4). Subsequent DNA
analyses of hair samples we collected from this time
period to 20 microsatellite sites was conducted by
Wildlife Genetics International (WGI, Nelson, British
Fig. 3. Grizzly bear s #399 and #610 GPS locations and home
Columbia, Canada). Including previous DNA results
ranges in Grand Teton National Park, Wyoming. from bears #399 and #610 among these samples and
16using simple Mendelian inheritance (i.e., shared alleles of “bears intensely fighting” in an area frequented by
at every marker between parent and offspring) the both bear families.
relationship among the 3 COY was perfectly resolved Various forms of altruistic parenting (behavior
and confirmed the identity of all 4 bears, including one that benefits the recipient at the expense of the
of bear #399’s cubs travelling with bear #610. benefactor) occur in at least 120 mammal and 150 bird
In bears, adoption is generally believed to species (Riedman 1982). One adoption hypothesis
result from traumatic events that separate family suggests an individual’s behavior toward relatives
groups. Researchers John and Frank Craighead influences its overall genetic fitness (Riedman 1982).
observed cub adoption during the 1960s in This line of reasoning would predict that bears would
Yellowstone National Park (YNP), where threatening be more likely to adopt related young. But while
encounters with other bears at garbage dumps were documenting adoptions is difficult enough, discerning
common (Craighead et al. 1995). In the YNP 2007 relationships among the players in the wild is usually
cub adoption reported by Haroldson et al. (2008), the not possible. In both this case and the YNP 2007
adoption of 2 cubs was reported to have possibly been event, the adopting parent was the daughter of the
preceded by an antagonistic encounter with wolves. adopted cub’s mother, and thus also the adopted cub’s
In the present case, though simply anecdotal, just prior sister, which is consistent with this “inclusive fitness”
to the cub switch, park residents reported the sounds (Hamilton 1964) hypothesis.
Fig. 4. Remote camera photo of grizzly bear #610 (ear tag visible) and 3 COY at a hair snare (horizontal wire visible in upper
middle of frame) site taken on 20 Oct 2011 in Grand Teton National Park, WY. GTNP photo.
17Occupancy of Bear Management Units (BMU) by Recovery Criteria (USFWS 2007b) state that 16 of the
Females with Young (Shannon Podruzny, Interagency 18 BMUs must be occupied by young on a running
Grizzly Bear Study Team) 6-year sum with no 2 adjacent BMUs unoccupied.
Sixteen of 18 BMUs had verified observations
Dispersion of reproductive females throughout of female grizzly bears with young during 2011
the ecosystem is assessed by verified observations (Table 9). Eighteen of 18 BMUs contained verified
of female grizzly bears with young (COY, yearlings, observations of females with young in at least 4 years
2-year-olds, and/or young of unknown age) by BMU. of the last 6-year (2006–2011) period.
The requirements specified in the Demographic
Table 9. Bear Management Units in the Greater Yellowstone Ecosystem occupied by females with young
(cubs-of-the-year, yearlings, 2-year-olds, or young of unknown age), as determined by verified reports, 2006–
2011.
Number of
years occupied
Bear Management Unit 2006 2007 2008 2009 2010 2011 2006–2011
1) Hilgard X X X X X X 6
2) Gallatin X X X X X X 6
3) Hellroaring/Bear X X X X X 5
4) Boulder/Slough X X X X X 5
5) Lamar X X X X X X 6
6) Crandall/Sunlight X X X X X X 6
7) Shoshone X X X X X X 6
8) Pelican/Clear X X X X X X 6
9) Washburn X X X X X 5
10) Firehole/Hayden X X X X X X 6
11) Madison X X X X X X 6
12) Henry’s Lake X X X X X X 6
13) Plateau X X X X 4
14) Two Ocean/Lake X X X X X X 6
15) Thorofare X X X X X X 6
16) South Absaroka X X X X X X 6
17) Buffalo/Spread Creek X X X X X X 6
18) Bechler/Teton X X X X X X 6
Annual count of occupied BMUs 16 17 18 18 18 16
18Observation Flights (Karrie West, Interagency Grizzly 1.95 hours (Table 10). Three hundred twenty-three
Bear Study Team) bear sightings, excluding dependent young, were
recorded during observation flights. This included
Two rounds of observation flights were 7 radio-marked bears, 262 solitary unmarked bears,
conducted during 2011. Forty-seven Bear Observation and 54 unmarked females with young (Table 10).
Areas (BOAs; Fig. 5) were surveyed during Round Observation rate was 2.02 bears/hour for all bears.
1 (15 Jun–17 Aug) and 35 BOAs during Round 2 One hundred eight young (59 COY, 27 yearlings,
(21 Jul–29 Aug). Observation time was 89 hours and 22 2- or 3-year-olds) were observed (Table 11).
for Round 1 and 71 hours for Round 2; average Observation rates were 0.34 females with young/hour
duration of flights for both rounds combined was and 0.18 females with COY/hour (Table 10).
Fig. 5. Observation flight areas within the Greater Yellowstone Ecosystem, 2011. The numbers represent the 38 Bear
Observation Areas. Those units too large to search during a single flight were further subdivided into 2 units. Consequently,
there were 48 search areas.
19Table 10. Annual summary statistics for observation flights conducted in the Greater Yellowstone Ecosystem,
1998–2011.
Bears seen
Observation rate
Marked Unmarked (bears/hour)
Number Average Total
Observation Total of hours/ With With number of All With With
Date period hours flights flight Lone young Lone young groups groups young COYa
1998b Round 1 73.6 37 2.0 1 2 54 26 83 1.13
Round 2 75.4 37 2.0 2 0 68 18 88 1.17
Total 149.0 74 2.0 3 2 122 44 171 1.15 0.31 0.19
1999b Round 1 79.7 37 2.2 0 0 13 8 21 0.26
Round 2 74.1 37 2.0 0 1 21 8 30 0.39
Total 153.8 74 2.1 0 1 34 16 51 0.33 0.11 0.05
2000 b
Round 1 48.7 23 2.1 0 0 8 2 10 0.21
Round 2 83.6 36 2.3 3 0 51 20 74 0.89
Total 132.3 59 2.2 3 0 59 22 84 0.63 0.17 0.12
2001 b
Round 1 72.3 32 2.3 0 0 37 12 49 0.68
Round 2 72.4 32 2.3 2 4 85 29 120 1.66
Total 144.7 64 2.3 2 4 122 41 169 1.17 0.31 0.25
2002b Round 1 84.0 36 2.3 3 0 88 34 125 1.49
Round 2 79.3 35 2.3 6 0 117 46 169 2.13
Total 163.3 71 2.3 9 0 205 80 294 1.80 0.49 0.40
2003 b
Round 1 78.2 36 2.2 2 0 75 32 109 1.39
Round 2 75.8 36 2.1 1 1 72 19 93 1.23
Total 154.0 72 2.1 3 1 147 51 202 1.31 0.34 0.17
2004b Round 1 84.1 37 2.3 0 0 43 12 55 0.65
Round 2 76.6 37 2.1 1 2 94 38 135 1.76
Total 160.8 74 2.2 1 2 137 50 190 1.18 0.32 0.23
2005 b
Round 1 86.3 37 2.3 1 0 70 20 91 1.05
Round 2 86.2 37 2.3 0 0 72 28 100 1.16
Total 172.5 74 2.3 1 0 142 48 191 1.11 0.28 0.13
2006 b
Round 1 89.3 37 2.4 2 1 106 35 144 1.61
Round 2 77.0 33 2.3 3 1 76 24 104 1.35
Total 166.3 70 2.3 5 2 182 59 248 1.49 0.37 0.27
2007b Round 1 99.0 44 2.3 2 1 125 53 181 1.83
Round 2 75.1 30 2.5 0 4 96 20 120 1.60
Total 174.1 74 2.4 2 5 221 73 301 1.73 0.45 0.29
2008 b
Round 1 97.6 46 2.1 2 1 87 36 126 1.29
Round 2 101.5 45 2.3 2 3 185 53 243 2.39
Total 199.1 91 2.2 4 4 272 89 369 1.85 0.47 0.23
2009 b
Round 1 90.3 47 1.9 1 0 85 21 107 1.19
Round 2 93.6 47 2.0 2 0 157 34 193 2.06
Total 183.9 94 2.0 3 0 242 55 300 1.63 0.30 0.15
2010b Round 1 101.1 48 2.1 0 2 93 22 117 1.16
Round 2 93.3 46 2.0 0 0 161 41 202 2.16
Total 194.4 94 2.1 0 2 254 63 319 1.64 0.33 0.20
2011 b
Round 1 88.9 47 1.9 2 1 153 31 187 2.10
Round 2 71.0 35 2.0 4 0 109 23 136 1.92
Total 159.8 82 1.9 6 1 262 54 323 2.02 0.34 0.18
a
COY = cub-of-the-year.
b
Dates of flights (Round 1, Round 2): 1998 (15 Jul–6 Aug, 3–27 Aug); 1999 (7–28 Jun, 8 Jul–4 Aug); 2000 (5–26 Jun, 17 Jul–4 Aug); 2001 (19
Jun–11 Jul, 16 Jul–5 Aug); 2002 (12 Jun–22 Jul, 13 Jul–28 Aug); 2003 (12 Jun–28 Jul, 11 Jul–13 Sep); 2004 (12 Jun–26 Jul, 3 Jul–31 Aug); 2005
(4 Jun–26 Jul, 1 Jul–31 Aug); 2006 (5 Jun–9 Aug, 30 Jun–28 Aug); 2007 (24 May–2 Aug, 21 Jun–14 Aug); 2008 (12 Jun–26 Jul, 1 Jul–23 Aug);
2009 (26 May–17 Jul, 8 Jul–27 Aug); 2010 (8 Jun–22 Jul, 10 Jul–24 Aug); 2011 (15 Jun–17 Aug, 21 Jul–29 Aug).
20Table 11. Size and age composition of family groups seen during observation flights in the Greater
Yellowstone Ecosystem, 1998–2011.
Females with 2-year-olds
Females with cubs-of-the-year Females with yearlings or young of unknown age
(number of cubs) (number of yearlings) (number of young)
Year Round 1 2 3 1 2 3 1 2 3
1998a Round 1 4 10 4 0 4 2 1 2 1
Round 2 0 7 3 2 4 1 0 1 0
Total 4 17 7 2 8 3 1 3 1
1999a Round 1 2 1 1 0 1 2 1 0 0
Round 2 2 2 0 0 3 1 0 1 0
Total 4 3 1 0 4 3 1 1 0
2000a Round 1 1 0 0 0 0 0 0 1 0
Round 2 3 11 1 1 2 0 0 2 0
Total 4 11 1 1 2 0 0 3 0
2001a Round 1 1 8 1 1 0 0 0 0 1
Round 2 14 10 2 4 2 1 0 0 0
Total 15 18 3 5 2 1 0 0 1
2002a Round 1 8 15 5 3 2 0 0 0 1
Round 2 9 19 9 2 4 2 0 1 0
Total 17 34 14 5 6 2 0 1 1
2003a Round 1 2 12 2 2 6 2 3 3 0
Round 2 2 5 3 2 5 0 2 0 1
Total 4 17 5 4 11 2 5 3 1
2004a Round 1 4 1 3 1 1 0 2 0 0
Round 2 6 16 7 4 7 0 0 0 0
Total 10 17 10 5 8 0 2 0 0
2005a Round 1 5 5 3 2 3 1 0 1 0
Round 2 4 4 1 3 6 3 5 2 0
Total 9 9 4 5 9 4 5 3 0
2006a Round 1 8 12 7 4 2 2 1 0 0
Round 2 5 11 2 2 1 0 2 2 0
Total 13 23 9 6 3 2 3 2 0
2007a Round 1 7 21 9 8 6 0 2 1 0
Round 2 2 6 6 3 2 3 0 2 0
Total 9 27 15 11 8 3 2 3 0
2008a Round 1 3 10 0 9 5 2b 6 2 0
Round 2 9 21 3 7 8 3 3 2 0
Total 12 31 3 16 13 5 9 4 0
0
2009a Round 1 0 6 4 2 3 1 3 1
1
Round 2 6 11 1 3 7 1 4 1
1
Total 6 17 5 5 10 2 7 1
2010a Round 1 2 7 2 2 6 1 4 0 0
Round 2 10 10 7 5 4 3 1 4 3
Total 12 17 9 7 10 4 5 4 3
2011a Round 1 4 8 3 3 6 1 2 2 3
Round 2 2 8 4 2 2 1 1 3 0
Total 6 16 7 5 8 2 3 5 3
a
Dates of flights (Round 1, Round 2): 1998 (15 Jul–6 Aug, 3–27 Aug); 1999 (7–28 Jun, 8 Jul–4 Aug); 2000 (5–26 Jun, 17 Jul–4 Aug); 2001 (19
Jun–11 Jul, 16 Jul–5 Aug); 2002 (12 Jun–22 Jul, 13 Jul–28 Aug); 2003 (12 Jun–28 Jul, 11 Jul–13 Sep); 2004 (12 Jun–26 Jul, 3 Jul–31 Aug); 2005
(4 Jun–26 Jul, 1 Jul–31 Aug); 2006 (5 Jun–9 Aug, 30 Jun–28 Aug); 2007 (24 May–2 Aug, 21 Jun–14 Aug); 2008 (12 Jun–26 Jul, 1 Jul–23 Aug);
2009 (26 May–17 Jul, 8 Jul–27 Aug); 2010 (8 Jun–22 Jul, 10 Jul–24 Aug); 2011 (15 Jun–17 Aug, 21 Jul–29).
b
Includes 1 female with 4 yearlings.
21You can also read