TRANSPORT STRATEGY 2030 - City of Melbourne
←
→
Page content transcription
If your browser does not render page correctly, please read the page content below
TRANSPORT STRATEGY 2030
CONTENTS

                                                                          Foreword                                                                          3         Implementation                                                                 106

                                                                          Executive Summary                                                                 4         Policy summary                                                                 108

                                                                          Vision 2030                                                                       8         Implementation plan                                                             110

                                                                          Context                                                                         20          Walking and Station Precincts map                                               112

                                                                          Context map                                                                     22          Public Transport map                                                            114

                                                                          Policy alignment                                                                25          Bikes map116

                                                                          Challenges and opportunities                                                    26          Motor Vehicles map118

                                                                          Strategy development28                                                                      2030 Proposed Integrated Network map120

                                                                          Theme 1: A Safe and Liveable City                                               30          Appendices                                                                      122

                                                                          Challenges and opportunities                                                    32          References                                                                      122

                                                                          Outcomes 1-4                                                                    34          Glossary123

                                                                          Theme 2: An Efficient and Productive City                                       60          Evidence-based public transport planning126

                                                                          Challenges and opportunities                                                    62

                                                                          Outcomes 5-9                                                                    64

A CONNECTED CITY
                                                                          Theme 3: A Dynamic and Adaptable City                                           88

                                                                          Challenges and opportunities                                                    90

                                                                          Outcomes 10-13                                                                  92

In a connected city, all people and goods can move to,
from and within the city efficiently. Catering for growth
and safeguarding prosperity will require planning for
an efficient and sustainable transport network.

Acknowledgement of Traditional Owners                                     Disclaimer
The City of Melbourne respectfully acknowledges the Traditional Owners    This report is provided for information and it does not purport to be complete. While care has been taken to ensure the content in the report is accurate, we cannot
                                                                          guarantee it is without flaw of any kind. There may be errors and omissions or it may not be wholly appropriate for your particular purposes. In addition, the publication
of the land, the Boon Wurrung and Woiwurrung (Wurundjeri) people          is a snapshot in time based on historic information which is liable to change. The City of Melbourne accepts no responsibility and disclaims all liability for any error, loss or
of the Kulin Nation and pays respect to their Elders, past and present.   other consequence which may arise from you relying on any information contained in this report.

                                                                             To find out how you can participate in the decision-making process for City of Melbourne’s current and
                                                                             future initiatives, visit melbourne.vic.gov.au/participate
melbourne.vic.gov.au
FOREWORD FROM THE LORD MAYOR
                           OF MELBOURNE AND COUNCILLOR

                           Transport Strategy 2030
                           Melbourne is one of the most beautiful cities in the world.           This strategy has been shaped by many voices. Expert
                           It is known for its hospitality, culture, arts, sport and, of         background papers have informed the project and more
                           course, as an important business and education centre for             than 1800 people and organisations contributed feedback.
                           our state and country.                                                Importantly, this strategy focuses on achieving the right
                                                                                                 balance between modes of transport.
                           The City of Melbourne’s Transport Strategy 2030 recognises
                           how important our transport choices are to ensure people              Successful and vibrant cities need high-quality
                           can move freely around our city.                                      transport connections.

                           As modes of transport change with technology so do the
                           choices Melburnians make to get around our city. Planning
                           needs to keep pace with this change and that is why we
                           have developed this strategy.

                           We have heard that our people are voting with their feet.
                           Nearly 90 per cent of journeys within the city are made on            Cr Frances Gilley
                           foot. As such, we are planning how to create more space               Sally Capp
                           for people to walk, talk, meet or sit under a tree and enjoy          Transport
                                                                                                 Lord MayorStrategy Foreword               24/09/19
                           Melbourne’s coffee with friends or colleagues.                        City of Melbourne

                                                                                                 Cr Nicolas Frances Gilley
                                                                                                 Chair of the Transport and
                                                                                                 Aboriginal City portfolios

                           Image 1: Little Collins Street during the weekday lunchtime closure

2   melbourne.vic.gov.au                                                                                                       Transport Strategy 2030       3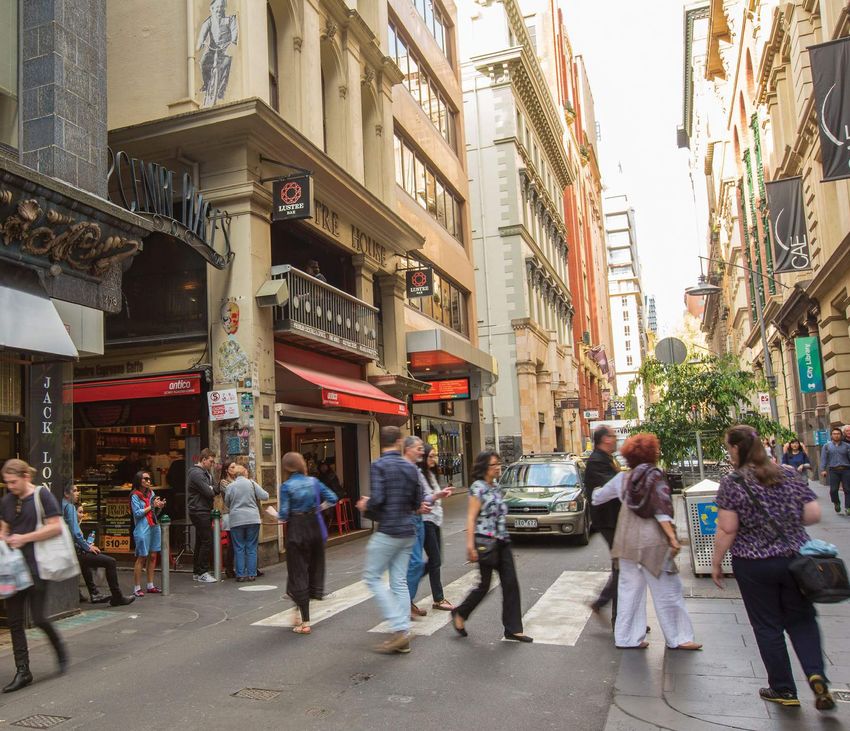
EXECUTIVE SUMMARY

This chapter provides an introduction and
overview of the strategy.

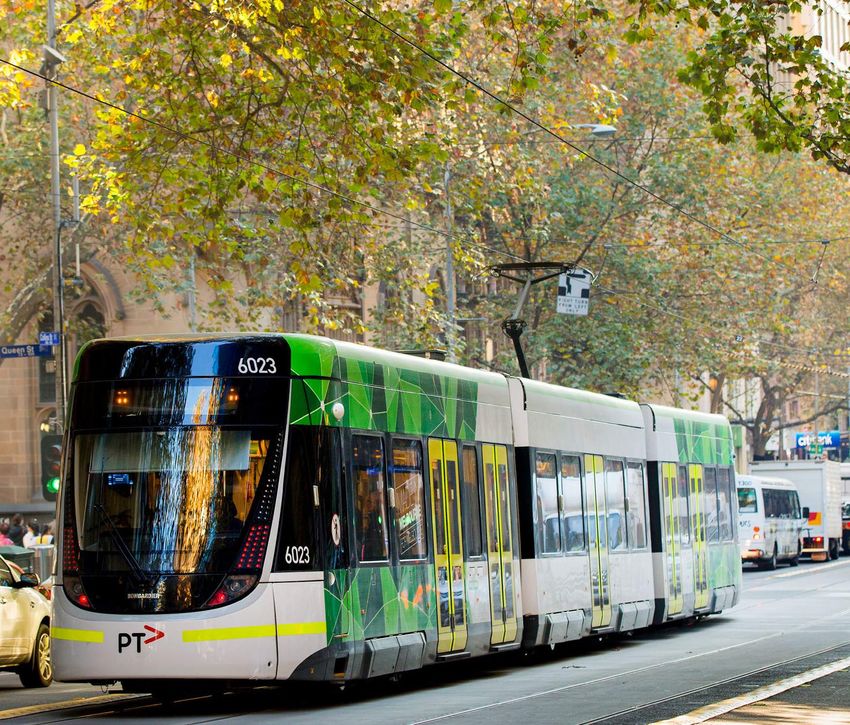
Image 2: Tram on Collins Street

4      melbourne.vic.gov.au                 Executive Summary | Transport Strategy 2030   5
TRANSPORT STRATEGY 2030
Melbourne’s central city has the largest Our municipality has seen significant change as a result of
growth in population and jobs over recent decades. In 2016
concentration of Victoria’s key economic, there were 150,000 more trips to work in the municipality
social and cultural assets. It is the centre of each weekday compared to 2001.
the state’s transport network. The way that people travel has also changed. More people
Victoria’s economic prosperity is reliant on a productive travel to work in the municipality by train than by car.
central city. It is the part of our state where the demand More people are walking, riding bikes and catching public
for travel is greatest and where walking, cycling and public transport than ever before. The share of car trips to work
transport do the heavy lifting. More than 900,000 people has decreased by 25 per cent since 2001 and the number of
– residents, workers and visitors – move into and within the vehicles entering the Hoddle Grid, the centre of the city, has
municipality every day. This makes our municipality unique reduced by 14 per cent since 2014.
and our transport challenges complex.
With Victorian Government investment in public transport
including the delivery of projects such as the Metro
The daily population is estimated to grow to Tunnel, car dependency will continue to decrease as more
approximately 1.4 million by 2036 convenient transport alternatives become available.
Figure 1: Melbourne LGA daily population estimates and forecasts Walking is critical to the success of the central city
2011–2036 economy. Eighty-nine per cent of all trips which start and
Daily population by year
finish within the Hoddle Grid are made on foot. These
Total forecast daily population walking trips allow people to easily connect, do business
1,500,000
(change from 2011)
1,401,000
and share knowledge through face-to-face interactions.
(+598,000) The safety, security and comfort of people is critical to
1,200,000 Visitors maintaining Melbourne’s liveability and reputation.
415,000
(+175,000)
Footpath congestion is a serious concern in parts of the
900,000 Students central city. When more than 290,000 people converge at
125,000
(+66,000) central city rail stations each weekday, crowds of people
build up on the footpaths and at intersections within
600,000
Workers the station precincts. Streets can sometimes feel hostile
549,000
(+175,000) and unsafe. The municipality also has the highest rate of
300,000
pedestrian road trauma in Victoria.
Residents
263,000 By 2036, the number of people moving around our
(+163,000)
municipality each day will increase to 1.4 million. To remain
2011 2016 2021 2026 2031 2036
globally competitive and maintain our reputation as a great
city to do business, live and work, our growing population
The share of trips to work by public needs streets and public spaces which are welcoming, safe,
comfortable and move people efficiently. Our footpaths
transport has increased significantly must be wide, comfortable and unobstructed places for
Figure 2: Journey to work by mode 2001–2016 (ABS 2017) walking, knowledge exchange and enjoying the city.
Bikes must play a more significant role in the transport
60
60%
network. The huge potential for more trips to be made by
Public transport mode share
bicycle is possible with the right infrastructure. Putting in
place safe, connected
Privatebicycle
vehiclelanes
mode willshare
encourage more
trips to be made by bicycle, including people who don't
50
50% currently ride. Bicycle trips are low-cost for users and
government, they improve the efficiency of the transport
Mode share
network and benefit society more broadly.
40
40% The city also needs an efficient and reliable public transport
network which meets the needs of our fast-growing
population and our business community.
30
30% To achieve this, we need to move more people in the
2001 2006 2011 2016 same amount of street space, make our existing transport
2001 2006 2011 2016 infrastructure work harder and commit to sustained
Public transport mode share investment in walking, cycling and public transport. There
Private vehicle mode share is significant potential to boost the contribution of each of
these modes.
Image 3: People walking through Bourke Street Mall
6 melbourne.vic.gov.au Executive Summary | Transport Strategy 2030 7
VISION

    Walking on our streets and laneways        To deliver this vision we will
    will be safe and comfortable with          invest in:
    expansive unobstructed footpaths,
    seating and substantial tree                • creating a safe and
    canopy coverage.                              liveable city
    We will extend Melbourne’s
                                                • fostering an efficient
    renowned laneway culture linking the
    ‘Little' streets. Our future laneways
                                                  and productive city
    will be places for people, knowledge
                                                • encouraging a dynamic
    exchange and hospitality, walking,
    meeting, eating and drinking.
                                                  and adaptive city.

    Melbourne will be Australia’s premier
    bicycle city. More people will be
    confident to ride with a connected
    network of safe and protected
    bicycle lanes and high-quality bicycle
    parking facilities.

    Our train stations will be international
    gateways to our city – iconic public
    spaces celebrating arrival to our city     By 2030, this strategy will:
    for hundreds of thousands of people,
    with seamless interchange between           • reduce by half the
    transport modes that is intuitive             number of people killed
    and easy.                                     or seriously injured on
    Public transport will be safe,
                                                  our streets
    accessible, fast and frequent.
                                                • reduce by half the
    Private vehicle access to the city will       proportion of central
    be prioritised for efficient deliveries,      city through-traffic
    servicing and for people who need to
    use a car.                                  • increase public
                                                  transport, walking and
    We will embrace the future with
    smart city and micromobility trials
                                                  cycling mode share to
    that deliver public benefit.                  70 per cent of all trips

    Disruption will be co-ordinated,            • increase proportion
    managed and communicated.                     of women cycling to
                                                  40 per cent.

8     melbourne.vic.gov.au                       Executive Summary | Transport Strategy 2030   9
A SAFE AND LIVEABLE CITY
Safe, walkable streets support the knowledge economy, which is dependent on face-to-
face interaction and the sharing of ideas and information. Cities with streets which support By 2030 we will: We will also:
convenient, comfortable and safe transport have healthier populations and a more equitable
society. Streets designed for people attract investment and promote economic growth. • Develop a Future Streets Framework to • Work with the Victorian Government to
design and deliver streets in the Hoddle apply a maximum speed limit of 40 km/h
Many aspects of the strategy will be implemented through our day-to-day operations. Grid based on the 2030 Proposed on local roads across inner Melbourne.
See Policies 1–14 for more. Integrated Network established in
• Work with the Victorian Government to
this strategy.
enable a further 40 km of high quality,
• Deliver priority footpath widenings across physically protected bicycle lanes on key
the municipality to reduce overcrowding. state-managed roads.
Outcome 1. Safe streets for people
• Convert parts of ‘Little’ streets into • Work with the Victorian Government
1.1 Redesign streets in the Hoddle Grid p.34 pedestrian-priority zones with lower to trial a protected intersection and, if
speed limits. successful, implement where appropriate.
1.2 Reallocate more space to people walking in the city p.35
30 • Free up space for people walking by • Work with the Victorian Government
1.3 Design safe and accessible streets for everyone p.36
providing an initial 300 additional and Yarra Trams to develop agreed
1.4 Adopt a strategic approach to managing footpath obstructions p.38 on‑street motorcycle parking bays and design principles for tram stops which
refocussing bicycle parking off the are integrated with the streetscape and
1.5 Prioritise public transport, walking and cycling during disruption p.40
footpath in busy areas. Evaluate the minimise crowding.
1.6 Proactively facilitate a permeable street network p.40 reduction in pedestrian congestion.
1.7 Deliver physically protected environments for people through innovative urban design p.40 • Investigate opportunities to increase
1.8 Reduce vehicle speed limits to improve safety for all p.42 off‑street parking for bicycles
and motorcycles.
Outcome 2. Safe streets for bike riding • Introduce new measures to prohibit non-
2.1 Deliver our proposed network of protected bicycle lanes into and through the central city p.44 fixed obstacles in busy areas to increase
space for walking.
2.2 Make every street safer for cycling p.47
• Deliver formal and informal crossings
2.3 Make intersections safer for cycling p.47 each year, particularly in urban renewal
3. Safe streets for confident cycling
2.4 Allocate more space to motorcycles p.48 areas, around schools and where
connections in the walking network are
poor.
Outcome 3. Transport interchanges as welcoming people‑places
• Work with the Victorian Government
3.1 Transform precincts around major transport interchanges into welcoming places for people p.50
to pilot lower speeds in areas of high
3.2 Design tram stops which are seamlessly integrated into streets p.51 pedestrian activity to improve safety. For
example, on the ‘Little’ streets such as
3.3 Support new clean and green bus streets p.51
4. Better integrate public transport with our streets
Flinders Lane and Chinatown.
• Deliver 50 km of connected, physically
Outcome 4. Fewer non-essential vehicles in the municipality
protected bicycle lanes over 10 years
4.1 Reduce central city through‑traffic p.52 to improve safety and get more people
riding each day.
4.2 Capture the benefits of road bypass projects p.54
• Produce strategic plans and deliver
4.3 Ensure access for people with disabilities as well as essential vehicles p.54
capital works for major station precincts,
4.4 Focus land development around public transport p.55 including Southern Cross, Flinders Street,
7. Fewer private vehicles in the Melbourne municipality
4.5 Review off-street parking policies p.56 Parliament and Flagstaff stations.
4.6 Increase the use of car share p.58 • Review off-street parking policies to
support better outcomes in all spatial
planning in the municipality..
• Deliver a new car share policy that
aims to support car share growth in
consultation with stakeholders.
Image 4: Flinders Lane
10 melbourne.vic.gov.au Executive Summary | Transport Strategy 2030 11
AN EFFICIENT AND PRODUCTIVE CITY
The efficient movement of people and goods is critical to the function of our city. Economic
growth and productivity is powered by efficient transport. The walking economy has been By 2030 we will: We will also:
key to the success of the central city as a place to do business, visit and live.
• Deliver community programs to get more • Reduce delay to people walking,
Many aspects of the strategy will be implemented through our day-to-day operations. people riding bikes. riding bikes, on buses and on trams by
See Policies 15–35 for more. • Identify and implement changes to kerb
working with the Victorian Government
to optimise traffic signal cycle times,
space management to improve efficiency.
starting in the Hoddle Grid.
• Implement short-term parking
• Improve travel times and reliability by
management measures to improve access
Outcome 5. Reduced delay for people using efficient transport working with the Victorian Government
and efficiency, including investigation of a
5.1 Optimise traffic signals to reduce waiting times p. 64 to prioritise the on-road tram and
demand-responsive parking pricing pilot.
bus network.
5.2 Reduce travel times and increase reliability of trams and buses p. 65 • Monitor construction disruption, consider
• Collaborate with the Victorian
5.3 Reduce incidences of vehicles blocking intersections to prevent delays to all modes p. 67 opportunities to test new transport
Government to develop and endorse
6. Reduce delays for people walking, riding bikes and using public transport
conditions and avoid reverting to the
a Central City Transport Framework,
Outcome 6. More people riding bikes original conditions if positive change
recognising the importance of the central
is demonstrated.
6.1 Deliver community programs to get more people riding bikes p. 68 city as the hub of the Victoria’s transport
network.
6.2 Support a review of the road rules to support safe and efficient cycling p. 69
6.3 Improve use of lighting to increase safety p. 69
8. More people riding bikes
6.4 Support the growth of e-bikes for moving people and goods p. 70
Outcome 7. Use kerb space more efficiently
7.1 Proactively manage kerb space to boost efficiency and productivity p .72
7.2 Improve on-street parking access and efficiency through demand-responsive pricing p .73
7.3 Encourage innovative, low-impact approaches to freight p. 74
7.4 Support efficient port logistics p. 75
Outcome 8. Efficient and reliable public transport for everyday life
8.1 Advocate for investment to increase inner-city rail capacity p. 76
8.2 Support a transition to ‘turn-up-and-go’ public transport p. 77
8.3 Support a review and redesign of tram and bus routes to increase capacity and efficiency p. 78
8.4 Enable a fully accessible public transport system p. 76
8.5 Support improvements to public transport safety and user experience p. 78
8.6 Integrate bikes and public transport, particularly at stations p. 78
8.7 Support establishing a rapid, high-frequency orbital network, beginning with buses p. 80
10. Go anywhere, anytime public transport for everyday life
8.8 Support improvements to boost public transport capacity during peak times p. 82
8.9 Support improving regional rail p. 82
8.10 Support improving airport public transport p. 82
Outcome 9. Integrated transport planning for Victoria
9.1 Support the development of a Central City Transport Framework p. 84
9.2 Support sustainable outcomes from major city‑shaping projects p. 84
9.3 Support early delivery of integrated transport for urban renewal areas p. 85
9.4 Leverage construction disruption to capture benefits of behaviour change p. 85
11. Better transport planning for Victoria
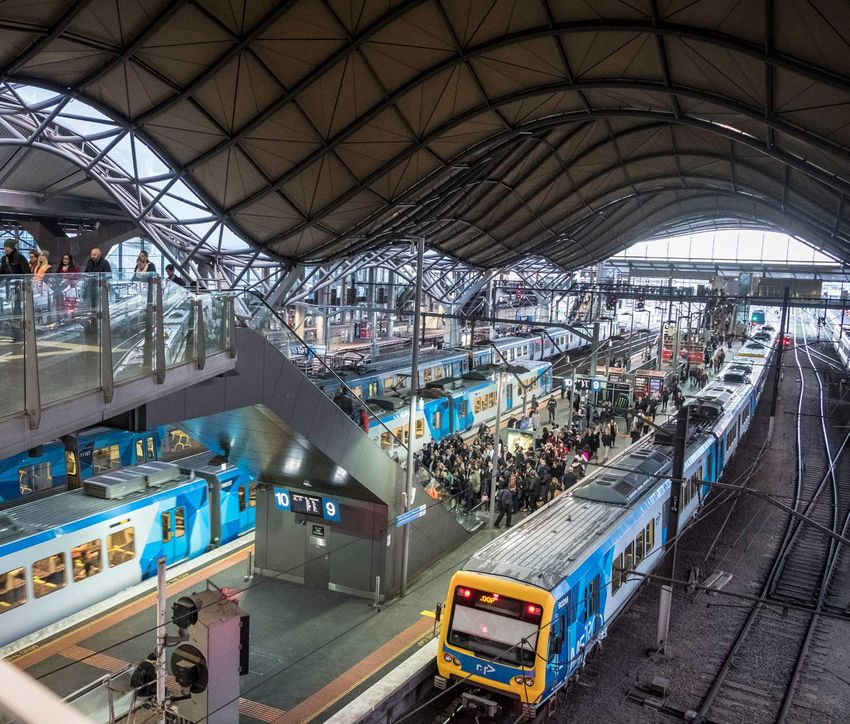
9.5 Support transparent transport performance data and indicators p. 86 Image 5: Southern Cross Station
12 melbourne.vic.gov.au Executive Summary | Transport Strategy 2030 13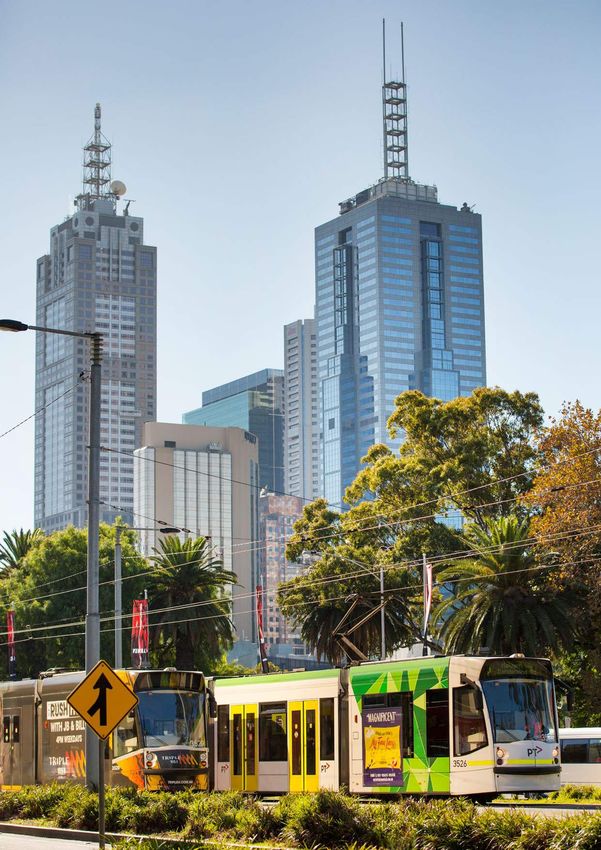
A DYNAMIC AND ADAPTIVE CITY

As our population grows and transport challenges become more complex, there are real
opportunities for technology, trials and innovative policy to be part of the solution. Our                                                                                      By 2030 we will:                                We will also:
streets, public spaces and transport network must be adapted to meet the travel demands
of the future while ensuring we continue to put people first in a liveable, prosperous and                                                                                      •    Trial technology to enable innovative      •    Advocate for regulatory or legislative
                                                                                                                                                                                     use of kerbside space, including                changes to ensure new transport
sustainable Melbourne.                                                                                                                                                               micromobility trials.                           technology benefits the city in line with
Many aspects of the strategy will be implemented through our day-to-day operations.                                                                                                                                                  this strategy.
                                                                                                                                                                                •    Enable a transition to zero-emissions
See Policies 36-48 for more.                                                                                                                                                         transport by advocating for lower carbon   •    Support and facilitate technology trials
                                                                                                                                                                                     intensity of motor vehicles and electric        which align with this strategy and the
                                                                                                                                                                                     vehicles powered by renewable energy            objectives of the Transport Integration
                                                                                                                                                                                     in line the Climate Change Mitigation           Act 2010. Undertake evaluations to
                                                                                                                                                                                     Strategy 2018.                                  understand impacts and opportunities.
                                                                   Outcome 10. New technologies deliver net community benefit
                                                                                                                                                                                •    Continue a public conversation             •    Support enhanced legal protections
                                                                   10.1 Advocate for regulation of micromobility services                                             p.92
                                                                                                                                                                                     about road pricing reform. This will            of vulnerable road users from
                                                                   10.2 Support a review of airspace regulations to protect amenity, privacy and equity               p.93          be supported by evidence, and in                the risks of motor vehicles and
                                                                   10.3 Support trials to test new technology and evaluate performance and impacts                    p.93          collaboration with government,                  autonomous technology.
                                                                                                                                                                                     community, experts and stakeholders.
                                                                   10.4 Support the integration of transport services through technology                              p.93

     12. New technologies deliver net community benefit
                                                                   10.5 Support regulation to protect accessibility and equity                                       p.94
                                                                   10.6 Investigate the use of sensor technology to improve transport performance                    p.94

                                                                   Outcome 11. Vehicle automation supporting a people‑focussed city
                                                                   11.1   Capture the road safety potential of vehicle automation to protect vulnerable road users   p.96
                                                                   11.2 Mitigate and manage the impacts of autonomous vehicles                                       p.96
                                                                   11.3 Use technology to enable reallocation of space currently used for car parking                 p.97
     13. Capture benefits of vehicle innovation

                                                                   Outcome 12. Zero-emissions transport
                                                                   12.1 Support electric vehicles powered by renewable energy                                        p.98
                                                                   12.2 Prioritise lower emissions for commercial vehicles and freight                               p.98
                                                                   12.3 Support stronger vehicle emissions standards                                                 p.100
     14. Zero transport emissions
                                                                   12.4 Support electric car charging in buildings and minimise on‑street charging                   p.100

                                                                   Outcome 13. Equitable and efficient transport pricing
                                                                   13.1 Advocate for a road user pricing system which improves transport equity and efficiency       p.102
                                                                   13.2 Support a national road-revenue sharing agreement to secure road maintenance funds           p.104
                                                                   13.3 Support effective public transport pricing to manage demand                                  p.104
     15. Transition to equitable and efficient transport pricing

                                                                                                                                                                              Image 6: Princes Bridge

14                          melbourne.vic.gov.au                                                                                                                                                                                    Executive Summary | Transport Strategy 2030   15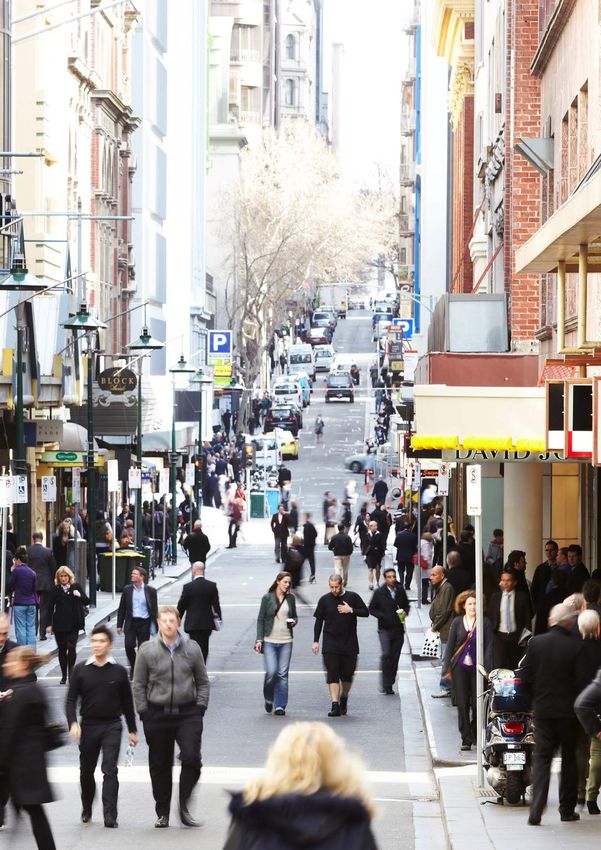
TARGETS

By 2030 we will:                                                                                             LONG-TERM
                                                                      INDICATOR             CURRENT   2030
                                                                                                               (2040)
    • Reduce by half the number of people killed or
      seriously injured on streets in the municipality,               Fatalities and
      and eliminate deaths and serious injuries by 2040               serious injuries in    231 1    –50%      0
                                                                      the municipality
    • Reduce by half the proportion of central city
      through-traffic to 21 per cent, down from                       Hoddle Grid
      43 per cent in 2018                                             through-traffic
                                                                                            43%2      21%      10%
    • Increase public transport, walking and cycling                  Public transport,
      mode share to 70 per cent of all trips                          walking and

    • Increase the proportion of women cycling to                     cycling mode          64%3      70%     75%
      40 per cent from 24 per cent in 2019.                           share, all trips in
                                                                      the municipality
                                                                      Proportion of
                                                                      women cycling
                                                                      into the central
                                                                                            24%4      40%     50%
                                                                      city

                                                                     Image 7: Jim Stynes Bridge

1
    Crashstats, Victorian Government 2018
2
    Central City Origin-destination Survey, City of Melbourne 2018
3
    Victorian Integrated Survey of Travel and Activity 2015–16, Victorian Government 2017
4
    Bi-annual Cordon Count, City of Melbourne 2019

16       melbourne.vic.gov.au                                                                                            Executive Summary | Transport Strategy 2030   17
2030 PROPOSED
INTEGRATED
NETWORK
Melbourne's transport network in 2030 as
proposed by this strategy.
Proposed/
Existing
Key: future
Pedestrian-priority zone
Protected bicycle route
Slow zone for bikes
Traffic-calmed bike street
Train station
Train station - investigate relocation
Full-time bus priority
Tram
Rail
Melbourne Metro 1 (Metro Tunnel) 0 500 1,000 m
N
Melbourne Metro 2
Traffic bypass
Map 1: Combined map of all proposals
18 melbourne.vic.gov.au Executive Summary | Transport Strategy 2030 19CONTEXT This chapter considers how people are moving in our city, the transport issues people face and future challenges and opportunities for transport in Melbourne. Image 8: The intersection of Swanston and Lonsdale streets 20 melbourne.vic.gov.au Context | Transport Strategy 2030 21
0 500 1,000 m
N
THE CENTRE OF VICTORIA’S
TRANSPORT NETWORK
Parkville Carlton
1980
North 560
1540
1210 1600
Across Melbourne, investment
Flemington 1240 2520
870
in transport is being planned 740
for and delivered. This new
infrastructure will impact how Macaulay 3080
people and goods move into Kensington 2100
and around Greater Melbourne
and our municipality:
Delivery 1680
660
• Metro Tunnel Arden
• High Capacity Metro Trains Carlton
• Level Crossing Removal
220 310
Project
North 330
• West Gate Tunnel Melbourne
West 710
• Streamlining Hoddle Street
Melbourne
• Port Rail Shuttle
• Regional Rail Revival 370
2580 12,300 1900
• Inland Rail
570
15,500
East 900
Planning Melbourne
8,700
• Level Crossing Removal
Project Central
• Suburban Rail Loop City
Melbourne 2280
• Airport Rail Link 1140
20,800 24,100
• Tram network extensions Docklands
• North East Link, including
810
Transport in the municipality
Doncaster Busway Southbank
Each day, more than 900,000 people
• Western Rail Plan move into, within and through the
6000
Employment Precinct 1120 municipality. Sixteen metropolitan
• Fast Rail to Geelong Lorimer
(Fishermans Bend) South 460 train lines, six regional train lines,
• City Loop reconfiguration Wharf 22 tram routes and 28 bus routes
converge in Melbourne’s central city.
• Central City Freight 630
Consolidation Centre 500
• Western Interstate Freight
Terminal Port Melbourne
Key:
Central city Road – Victorian Government People moved (weekday 8–9am):
Tram route CityLink (privately-operated) Station exits
Bus route Under construction: Tram passengers
South
Yarra
Passenger rail Metro Tunnel (due 2025) Bicycle riders
Train station West Gate Tunnel (due 2022) Vehicle occupants
Map 2: Context map
22 melbourne.vic.gov.au Context | Transport Strategy 2030 23ROLES AND RESPONSIBILITIES POLICY ALIGNMENT
Who is responsible for transport? Integrated planning Working together for a world- Intersections
City of Melbourne The Transport Integration Act 2010 (TIA) is Victoria’s class transport network Improving the people flow at signalised intersections is
key to reducing footpath congestion and improving the
principal transport statute. Its core focus is integration and efficiency of movement throughout the city. We will work
The City of Melbourne manages, operates and funds some The City of Melbourne commits to working with the Victorian
sustainability. It requires integrated planning of transport with the Victorian Government improve traffic signal
aspects of the transport network in inner Melbourne. We are Government to deliver the world-class, efficient, safe and
as a single system performing multiple tasks, rather than operations and timing.
primarily responsible for local roads and we design, deliver reliable transport network needed for a growing Melbourne.
as separate transport modes. Planning is also required to
and maintain most of the city’s public spaces, footpaths, consider the use of surrounding land and its intensity. This will be especially important in places where the Trials and pilots
streets, bicycle lanes and paths in parks and gardens. transport roles of the Victorian Government and the City of We support trialling and testing changes to the design
Under the TIA, integrated planning is the responsibility of Melbourne intersect:
Victorian Government and operation of our streets and transport infrastructure in
all levels of government. The City of Melbourne and the
• The rail network and stations are managed by the partnership with the Victorian Government.
Victorian Government are required to makes decisions
The Victorian Government is responsible for most aspects based on the TIA’s objectives and principles. The objectives Victorian Government and are major gateways to the
of planning, building, managing and operating transport in are to achieve: central city. When the thousands of people come by rail
Melbourne through its various agencies and contractors. This each day, they arrive on to streets managed by the City
The Transport Strategy has been informed by key
includes the public transport network, arterial roads and all • social and economic inclusion of Melbourne.
traffic signals. policies and legislation:
• economic prosperity • The city’s hard-working and iconic trams run on many
The City of Melbourne works closely with Victorian City of Melbourne streets. The stops are integrated into Victorian Government
• environmental sustainability streets and footpaths we manage and maintain.
Government agencies, authorities and operators to gain
approvals for projects, to advocate for change and influence • integration of transport and land use • Most streets in the city are local streets managed by • Plan Melbourne 2017
good outcomes for our municipality. the City of Melbourne, while signalised intersections are
• efficiency, coordination and reliability • Infrastructure Plan 2018
managed and operated by the Victorian Government.
• safety, health and wellbeing. • Victorian Cycling Strategy 2018
It is critical that we work constructively with the Victorian
• Movement and Place in Victoria 2019
Government to ensure a seamless, integrated transport
system and respond together to the challenges and • Network Development Plan – Metropolitan
complexities of moving more people within the same Rail 2012
Street trees are amount of space.
managed by the Footpaths are • Victorian Freight Plan 2018
City of Melbourne. managed by the Major transport projects and disruption
• Towards Zero 2016
City of Melbourne. Metro Tunnel construction and other major transport and
building projects will disrupt existing travel patterns in • Climate Change Act 2017
many ways. We will work with the Victorian Government to • Transport Integration Act 2010.
manage disruption and accommodate people safely and
comfortably during construction.
City of Melbourne
Public transport and public realm interface
On-street parking • Future Melbourne 2026
is managed by the The Victorian Government is progressively increasing public
transport capacity by purchasing larger vehicles, investing • Council Plan 2017–2021
City of Melbourne. Trams are operated
in infrastructure, making the system more efficient and • Transport Strategy 2012
by Yarra Trams
moving towards a ‘turn-up-and-go’ service. The passenger
under contract
experience extends beyond the public transport vehicle and • Walking Plan 2014
from the Victorian
Arterial roads onto the streets and footpaths around stations and stops.
Government. • Places for People 2015
are managed We must work together to ensure these public spaces are
by the Victorian welcoming and adapted to match the aspirations for an • Bicycle Plan 2016
Government. efficient, modern public transport system.
• Last Kilometre Freight Plan 2016
Safety
• Motorcycle Plan 2015
As Melbourne becomes busier and more people gather at
Signalised • Road Safety Plan 2013
our transport hubs, ensuring the safety of people in the
intersections central city becomes a greater challenge. We will work with • Road Management Plan 2017
are managed the Victorian Government to ensure our streets are designed
by the Victorian to keep people safe and minimise overcrowding. • Climate Change Mitigation Strategy 2018
Local streets
Government. • Climate Change Adaptation Strategy 2017
are owned and More cycling
managed by the • Urban Forest Strategy 2014
City of Melbourne. Increasing cycling uptake will reduce congestion on our
streets and trams. We support investment in safer, lower- • Access Docklands 2013
Figure 3: Road management roles and responsibilities
stress, better-connected bicycle routes in line with the
Victorian Cycling Strategy. We will work with the Victorian • Central Melbourne Design Guide 2018
Government to deliver on our shared goals for cycling and
• City of Melbourne Design Standards.
make it a real option for more people.
24 melbourne.vic.gov.au Context | Transport Strategy 2030 25CHALLENGES AND OPPORTUNITIES
The following challenges and opportunities were
identified by City of Melbourne analysis and
Many people don’t feel confident to ride a bicycle
Network efficiency City disruption and transformation
Cycling is good for our health and environment. It is cheap,
community feedback and reinforced through fun and flexible while requiring relatively little space in a Congestion Major project disruption
independent research. The strategy proposes a series of busy city. While there is an extensive network of painted
A certain level of transport congestion is a feature of all Greater Melbourne’s growth has led to an unprecedented
actions, policies and projects to respond to these issues. lanes in the city, our evidence shows that most people do
prosperous cities. However, it also undermines liveability investment in major projects including the Metro Tunnel,
not feel safe enough to use them. Many people who want to
and economic prosperity. Congestion costs Greater West Gate Tunnel and level crossing removals. These are
Safety and security in the city start riding or want to ride more often would do so if bicycle
lanes were physically protected from motor vehicles.
Melbourne $4.6 billion per year and is forecast to reach $10 transformational projects which will take several years to
billion by 2030. Increasing road capacity does not eliminate complete. Construction requires frequent changes to the
Pedestrian road trauma Protected bicycle lanes attract more people to ride. Cycling
congestion. Rather, evidence shows it increases the number way people travel, such as road closures, diversions and
could play a bigger role in the transport network for a
The city has the highest rate of pedestrian road trauma in of motor vehicles on the road. Buses and trams get stuck in replacement bus services.
relatively low-cost investment (e.g. the 12,000 people who
Victoria. On average about 46 pedestrians are seriously congested conditions across Greater Melbourne. We have
currently ride to work each weekday is equivalent to the Disruptive technology
injured and one pedestrian dies each year on roads in the largest tram network in the world, however our trams
capacity of 57 E-class trams).
the city. More needs to be done to keep people safe on are also among the slowest, averaging just 16 km/h across Disruptive technology such as rideshare apps and dockless
our streets. the network. bike share provide opportunities to improve transport
and increase accessibility. However, there is a risk that the
In recent years, motor vehicles have been used to Thousands of people could ride to work in The impact of through-traffic
benefits will not be realised or that the negative impacts of
deliberately harm people on our streets. We are working the municipality with better infrastructure Many people who drive through the central city are passing unregulated new technologies will not be mitigated.
with the Victorian Government to protect our primary through with business elsewhere. Forty-three per cent of
gathering spaces. With more people in the central city each Figure 5: Number of potential bicycle riders in adjacent LGAs vehicles travelling into the Hoddle Grid is through-traffic. There is a high degree of uncertainty about how soon
day we need to consider expanding this to other streets King Street, Spencer Street and William Street carry the driverless cars will be using our streets. Driverless cars
and places. 9,000 most through-traffic. could remove most human error in road accidents and
help deliver people the first and last kilometre of their
Increasing demand for road space next to the kerb trip, complementing efficient public transport. However,
Road-related fatalities and injuries have Kerb space is the area of the road adjacent to the kerb.
driverless cars are likely to contribute to additional car
trips, adding to congestion and may shift people away from
declined but there is a long way to go 4,500 There is 45,000m2 of kerb space dedicated to on-street
walking, public transport and cycling.
parking in the central city. As our population grows, there
Figure 4: Annual recorded road collisions resulting in injuries in the will be more demand for this space to accommodate
Hoddle Grid (Victorian Government 2018) Transport emissions are increasing
deliveries, service vehicles, pick-ups and drop-offs, trees,
g e y d ip n ra public space, wider footpaths and bicycle lanes. Current transport emissions in the city exceed the levels
on rn ll e an ill to r
rn ou Va r el Ph i ng Ya required to meet Australia’s obligations under the Paris
2000
2000 60 y l b e o r t n
Fatality or Seriousib injurye ne M on
2001 ar M Po St Delays at intersections Climate Agreement. In 2018, cars contributed around
M oo
2002 M 52 per cent of the city’s land transport emissions.
2003
2003 The traffic lights at many intersections in the Hoddle Grid
Other injury Current bicycle trips People who could ride
2004 are not programmed to maximise efficient movement. Many
2005 with better bicycle facilities
Speed limit (km/h)
50 signals do not change frequently enough, leading to delays
2006
2006
for public transport and a build up of people waiting to Private cars are the greatest source of
2007
2008
Experience and reputation
cross, particularly around stations at peak hours. This will transport emissions in the municipality
2009
2009 worsen as train capacity increases. Delaying people walking
2010 Figure 6: Transport emissions in the municipality, by mode
2011 The experience of visitors affects Melbourne’s status as a is a handbrake on economic productivity.
City of Melbourne transport emissions by mode
2012
2012 global destination. With most visitors on foot, the quality
2013 and generosity of the walking environment is critical to our Hidden costs of on-street parking
2014 international reputation and a thriving economy. In line with Private cars
2015 40
2015 The price of on-street parking at many times is lower than Private car
Motorcycles
2016 our goal for a ‘City for People’, we want to ensure all people Motorcycles
2017 off-street parking. This adds to congestion, as people LightVehicles commercial vehicles
can access, feel safe in and enjoy the city. The city’s streets, Light Commercial
2018
2018 driving search for a cheap, subsidised on-street parking Heavy commercial vehicles
Heavy Commercial Vehicles
public realm and transport network must be inclusive for all.
0 50 100
100 150 200
200 250 300
300 space. On-street parking is public space which is used Buses
TramsBuses
Number of collisions temporarily by a small number of people. Much of this Trams
Electric Trains
Public transport safety
space could be used more productively to benefit many Diesel Trains
Electric
Non-serious injury Fatality/serious injury Waterbourne cargo ships trains
Most of Melbourne’s extensive tram network shares space more people1. Diesel trains
Helicopters
with vehicles. Every year 1000 tram/vehicle accidents
Waterborne cargo ships
Footpath overcrowding occur across the network. These accidents injure people, There is little evidence that parking is essential for retail
Helicopters
affect lives, cause extensive delays and substantially increase performance. Three-quarters of all trips to the City of
The quality of life in Greater Melbourne and the growth operating costs. Feeling unsafe at public transport stations, Melbourne for shopping are made by public transport. Only
of our economy continues to attract people to the central stops and surrounding streets prevents some people 14 per cent of shopping trips in the municipality involve
city. As a result, pedestrian overcrowding occurs frequently accessing public transport services at all times and locations. on-street parking. Meanwhile, there is a significant supply of Transport pricing
at key locations, including around train stations and tram off-street parking (68,300 commercial spaces). Off-street
stops, on streets and at intersections. For example, at the Currently, the main form of road demand management is
parking could adequately accommodate the relatively small
intersection of Spencer and Collins streets during peak traffic jams – people are discouraged from making trips
number of shopping trips made by car.
hours, there are often so many pedestrians waiting to cross during peak hours due to longer journey times. There is no
the road that they spill onto the street, putting people in danger. price signal to manage road demand or encourage people
to travel differently. People pay the same price for transport
during peak hours as they do during off-peak hours.
1
Transport Strategy refresh background paper: Car parking, RMIT 2018
26 melbourne.vic.gov.au Context | Transport Strategy 2030 27STRATEGY DEVELOPMENT
January – April 2018 The Transport Strategy has been informed by research,
Discussion papers feedback Draft Transport Strategy 2030
Background
analysis and engagement including:
The discussion papers generated a public conversation on feedback
research
Eight background
Eight background research papers on key issues current transport issues faced by the City of Melbourne,
research papers The Draft Transport Strategy 2030 was endorsed by the
highlighting best practices used in other cities as well as
on key issues • Walking Research Paper – MRCagney Future Melbourne Committee on Tuesday 7 May, 2019. The
ideas for consideration.
draft strategy consolidated discussion paper feedback,
• Public Transport Research Paper – Melbourne University
More than 20,000 people visited the engagement platform supporting research and evidence into a detailed 10-year
and RMIT
Participate Melbourne, and 1,316 contributions were plan for transport in Melbourne.
• City Space Research Paper – Studio Huss received from people across metropolitan Melbourne. These
A further 7000 people visited Participate Melbourne and we
• Emerging Transport Technology Research Paper – submissions were analysed independently.
received 382 survey responses and 45 formal submissions
Vispoke Consulting from both individuals and organisations. This feedback was
Engagement highlights
• Cycling Research Paper – Phillip Boyle and Associates analysed by the project team.
April – July 2018 • 700,000+ reached on social media
Discussion
• Car Parking Research Paper – RMIT We received:
• 12,250 engagements on social media (comments, likes
Eight discussion • Transport, Greenhouse Gas Emissions and Air Quality and reactions) • 109,000 video views on social media
papers
papers to start
Research Paper – Institute for Sensible Transport
the conversation
• 18,236 unique visitors to Participate Melbourne • 16,000 engagements on social media (comments, likes,
• Transport Pricing Research Paper – Monash University reactions)
and University of New South Wales • 210 people engaged at pop-ups
• 6950 unique visitors to Participate Melbourne
• 1275 responses on Participate Melbourne page
Nine additional evidence-based reports throughout
• 1740 people engaged at pop-ups and community
the project • 40 submissions. information sessions
• Transport Re-investigation of Future Melbourne 2026 EY Sweeney undertook an independent analysis of the • 382 survey responses
community comments – Global Research feedback and prepared a report, which informed the
direction of the strategy. • 45 formal submissions.
• Analysis of VISTA and Census Journey to Work data –
Ipsos This report was presented to Council on 11 December 2018. Analysis of this feedback identified 1288 individual
Community,
stakeholder and Additional comments from the 429 different surveys and submissions,
government evidence • SNAMUTS public transport accessibility modelling – RMIT of which:
feedback
• Potential for electric bike use in Melbourne – Institute for • 61 per cent of comments were in direct support of
Sensible Transport the Strategy
June – July 2019
Draft Strategy
• Economic cost of pedestrian delay – MRCagney • 29 per cent of comments provided constructive feedback
• Origin-Destination Survey and Automated Traffic Counts resulting in changes to the Strategy.
The Draft Strategy
included specific
for the central city – AusTraffic
proposals for
• Footpath Obstacle Survey – Phillip Boyle and Associates
feedback
• Economic assessment of the 2030 Draft Transport
Strategy – Deloitte Access Economics
• Quantifying Pedestrian Crowding in the Central City –
DSpark
Community,
stakeholder and Additional
government evidence
feedback
October 2019
Final Strategy
Figure 7: Process of developing the Strategy
28 melbourne.vic.gov.au Context | Transport Strategy 2030 29A SAFE AND
LIVEABLE CITY
Walkable streets support business and
activity in the city, which is dependent on
face-to-face interaction and the sharing of
knowledge and ideas. Cities with streets that
enable walking, cycling and public transport
that is convenient, comfortable, enjoyable
and safe have healthier populations and
more sustainable environments. Streets
designed for people bring life to the city.
Melbourne’s generous streets have allowed us to provide
for multiple modes of transport in most areas of the
municipality. However, with a growing population and more
people coming to the municipality, street space needs to be
allocated to the modes of transport that will move the most
people. This means prioritising pedestrian space, cycling
networks and room for public transport.
Public space will become even more important to the
long-term liveability, reputation and prosperity of our
growing city. The City of Melbourne will increase the
area of pedestrian-only and pedestrian-priority spaces
to enhance safety, commercial viability and place
activation, introducing full and part-time street closures
that are temporary or permanent. This will be achieved
using a strategic approach to ensure appropriate access
is maintained.
Outcomes
10
1. Safe streets for people
2: Safe streets for people
2. Safe streets for bike riding
3. Safe streets for confident cycling
3. Transport interchanges as welcoming
people‑places
4. Better integrate public transport with our streets
4. Fewer non-essential vehicles in
the municipality
7. Fewer private vehicles in the Melbourne municipality
Image 9: Crossing Flinders Lane
30 melbourne.vic.gov.au A Safe and Liveable City | Transport Strategy 2030 31CHALLENGES AND OPPORTUNITIES
Safety and overcrowding Footpath overcrowding Cost of motor vehicles to society Melbourne is not yet accessible for all
Overcrowding occurs frequently at key locations, including Every kilometre driven by a private motor vehicle imposes Legislative requirements under the Disability Discrimination
Road trauma around train stations and tram stops, on central city streets 58 cents in costs to society7. These costs include pollution, Act 1992 (Cth) (DDA) set the minimum standards for
and at intersections2. For example, at the intersection of noise, traffic congestion, accidents, reduced health disability access in the city. While parts of the city’s
Our municipality has the highest rate of vehicle-pedestrian
Spencer and Collins streets during peak hours, there are outcomes from sedentary behaviour, land use costs and transport network continue to be upgraded to meet
collisions in Victoria. On average approximately 46
often so many people waiting to cross the road that they road maintenance. minimum standards, we should be aiming to go beyond
pedestrians are seriously injured and one dies each year on
spill off the footpath. Overcrowded spaces are unpleasant, this by designing a city which is universally accessible to all
streets in the municipality1. In recent years, motor vehicles
uncomfortable and put at risk our reputation, liveability Competing demands for street space people including those with physical or mental disabilities.
have been used with the intent to harm people walking
and economic productivity. During the morning and For example, while a section of city street may be DDA
on footpaths. Many improvements have been made. For The 1.4 million people forecast to be in the municipality
lunchtime peaks, 14 per cent of central city footpaths are so compliant, crowding makes it harder for the elderly, people
example, since the 40 km/h speed limit was introduced every day in 2036 will need to move around in the same
crowded that people have to walk on the kerb or roadway3. with a disability or parents with prams or young children to
throughout the Hoddle Grid, slower vehicle speeds have amount of space that is used by 900,000 today.
Overcrowding is also a safety and security risk. navigate the street safely and comfortably.
meant 170 people have avoided suffering serious injury.
Historically, most streets in Melbourne have tried to
Our ‘Little’ streets are not designed to prioritise people. The Visitor experience and reputation
More will need to be done to reduce the risk of motor accommodate as many modes as possible. With rapid
footpaths are too narrow, making it hard for people to pass
vehicles causing harm to people. population growth, the increased demand for travel requires The experience of visitors impacts Melbourne’s status as a
each other, to window shop or to dwell and enjoy the city.
a new approach8. More space is needed for walking, cycling global destination. With most visitors on foot, the quality
Narrow footpaths are particularly problematic for people
and public transport to move people efficiently, safely and and generosity of the walking environment is critical to our
using wheelchairs, prams and with limited mobility. There is
in comfort. Also, more space will be needed for people to international reputation.
Road-related fatalities and injuries have acute overcrowding on streets such as Flinders Lane, Little
rest, relax and enjoy the city.
declined, but there is a long way to go Collins and Little Bourke. Oversupply of off-street parking
Obstacles on footpaths disrupt pedestrian flow and make Data suggests that there are many more residential off-
Figure 8: Annual recorded road collisions resulting in injuries in the Personal safety pedestrian crowding worse9. Obstacles on footpaths include street parking spaces than the market demands. In the
Hoddle Grid (Victorian Government 2018) motorcycle and bike parking, A-boards and cafe tables.
In some parts of the municipality people don’t feel safe municipality there are 40 per cent more residential parking
walking or riding a bicycle. We received feedback from the spaces than vehicles owned11. This oversupply pushes up
2000
2000 60 community that people feel particularly unsafe using poorly the cost of housing by $50,000 to $80,000 per parking
Fatality or
litSerious injury
off-road paths and trails. Cars are the least space-efficient bay. Residential parking often occupies the bottom floors
2001
2002 of buildings. This creates dull and lifeless streets. As the
2003
2003 Other injury
Many people don’t feel confident to ride a bike
transport mode
2004 number of vehicles entering the central city declines, it is
2005 likely that commercial parking facilities will also become
Speed limit (km/h)
Cycling is good for our health and our environment 4 . It is Figure 9: Space per person (m2) for different modes of transport
2006
2006 50 underused. New technologies and services, such as app-
2007 cheap, fun and flexible while requiring relatively little space
2008 in a busy city. Many people who want to start riding or want based taxis, are reducing parking demand. Repurposing
2009
2009 to ride more often would do so if bike lanes were physically these spaces for more productive uses – such as residential,
2010
2011 protected from motor vehicles. Our research shows that 9.2 office, retail or hospitality – would benefit the city.
2012
2012 protected bike lanes attract more people to ride 5 .
2013
2014
2015
2015 40 In particular, women are more likely to use a bicycle for Off-street car parking is oversupplied
2016 transport if physically protected infrastructure exists. 1.9
1.5
2017 Currently, only 24 per cent of morning bicycle commuters 0.6 0.5 0.5 Figure 10: Parking supply in the municipality
2018
2018 are women6. To be equitable, infrastructure funded by the
0 50 100
100 150 200
200 250 300
300
community should be designed to meet as wide a range Car (average occupancy) Motorcycle Bike Tram Train Walk 75,800
Number of collisions 80,000
80,000 Total bays: 217,000
of community needs as possible. Our research shows that 68,300
Non-serious injury Fatality/serious injury protected bike lanes encourage more women to ride. Slow growth of the car share fleet
60,000
We have some existing protected lanes, such as on parts of Car share helps to reduce ownership of private vehicles. It 49,500
Elizabeth, Swanston and La Trobe streets. These will need allows people to avoid owning a car and mostly use other
Health impacts of motor vehicles modes, while having access a car for infrequent trips where
to be connected into a broader network of protected lanes, 40,000
40,000
Motor vehicles are a major source of pollution. In addition to including at intersections, to attract more people to ride. it is the most convenient mode. Car share users catch public
carbon dioxide, motor vehicles emit particulates, nitrogen transport, walk and ride bikes more often than car owners10.
oxides and volatile organic compounds, which are harmful Tram network safety The City of Melbourne has a goal of 2000 car share vehicles 20,000 12,000 11,500
to human health. Motor vehicle use is strongly associated in the municipality by 2021. The goal is designed to help halt
On Melbourne’s extensive tram network, trams and private
with negative physical and mental health outcomes the growth of the city’s residential car fleet. If current trends
vehicles compete for space. Every year 1000 tram-vehicle
including obesity, heart disease, diabetes, depression, continue, the City of Melbourne will not achieve its goal and
accidents occur across the network – an average of three
stress and anxiety. Substitution of some motor vehicle trips the number of cars owned by residents may continue to
al
al
ed
ed
ter
collisions each day. These accidents injure people, affect
va e
ti
ci
er
ri h
er
with walking, riding a bicycle and/or public transport can increase.
en
er
p Ot
lives, cause extensive delays and substantially increases
et
et
m
id
improve public health and reduce strain on the health system.
nm
M
om
es
operating costs. When trams are taken out of service for
R
U
C
repairs, a larger fleet is required to maintain services.
On-street parking Off-street parking
1
Transport Strategy refresh background paper: Walking, MRCagney 2018
2
Transport Strategy refresh background paper: Walking, MRCagney 2018 7
Divorcing growth from the car, Deloitte 2018
3
Footpath obstacle survey, Phillip Boyle and Associates 2018 7
Transport Strategy refresh background paper: City Space, UB-Lab 2018
4
Transport Strategy refresh background paper: Bicycles for everyday transport, Phillip Boyle and Associates 2018 8
Footpath obstacle survey, Phillip Boyle and Associates 2018
5
Bicycle user confidence study, CDM research and ASDF research 2017 10
Car sharing research report, prepared by GHD for City of Melbourne and City of Stonnington, 2010
6
Bi-annual cordon count, City of Melbourne 2019 11
Transport Strategy refresh background paper: Car parking, RMIT 2018
32 melbourne.vic.gov.au A Safe and Liveable City | Transport Strategy 2030 33Outcome 1 - SAFE STREETS FOR PEOPLE
1.2 Reallocate more space to Transitioning the city’s ‘Little’ streets – Flinders Lane,
Little Collins, Little Bourke and Little Lonsdale streets – to
Our streets will be safe places for people of people walking in the city pedestrian-priority streets is a key outcome.
all ages. People will be protected from the
risk of moving vehicles. Innovative design will Walking is integral to cities. It is the main way people These streets were originally established to service
enhance the quality of the public realm without 10 experience the city and connect with each other. A good properties fronting the major east-west streets in the
compromising the amenity of our streets for walking network increases interaction between people Hoddle Grid. As the city evolved, so has the function of the
doing business which drives the economy. Walking requires ‘Little’ streets. Today, many of them are vibrant, pedestrian-
people walking and resting. Pedestrians are
the least space of any mode of transport. dominated spaces with a mix of fine-grained activity. Other
safe, the risk of harm posed by motor vehicles is
streets in the city are changing as a result of projects, such
reduced by slowing vehicles down and creating Creating wider footpaths for the comfortable movement of as Franklin Street due to the Metro Tunnel.
more car-free spaces. people as well as increasing space for seating, trees, street
trading, bike lanes and bus/tram lanes is a priority. The ‘Little’ streets are well-suited to pedestrian-based
2: Safe streets for people
businesses, hospitality and retail. However, narrow
Intersections play a critical role in the transport network. footpaths combined with significant volumes of
Some of Melbourne’s most congested footpaths are at people create crowded and uncomfortable pedestrian
corners where footpaths meet. Roundabouts are space- environments on these streets. Increasing the amount of
1.1 Redesign streets in the intensive intersection designs. They remove pedestrian
priority and are difficult to negotiate on bicycles. They are
space for people on foot in the ‘Little’ streets will increase
their viability and vitality and link the laneways.
Hoddle Grid not a preferred solution in the municipality.
Fast movement or through-traffic are not appropriate in
The future transport role of each street in the Hoddle Separation of road users is sometimes not achievable or the ‘Little’ streets. Access for local traffic and deliveries will
Grid has been defined in this strategy (see the Proposed desirable. Research shows that, in many instances, sharing be maintained.
Transport Network maps). space can be safer for all modes. This is because when
rights of way are removed, all users have to exercise greater All policies and actions in the City of Melbourne Walking
We will transition the design of streets to reflect current and caution to safely proceed. Plan 2014-17 remain current and will be delivered through
future use. this strategy, including outstanding shared zones.
We will improve streets and intersections by:
Fundamental drivers of the plan are to reallocate more Policy 1: Ensure adequate space is provided for people
space to people, increase walking, cycling and public • reallocating traffic lanes to pedestrian space, including at through all street renewal or upgrade projects. Intersections
transport use in the central city and improve the experience intersections and slip lanes
will be designed to optimise the flow of pedestrians and
of streets for people. Many of these changes will help to
make the city more accessible for people with limited • reducing crossing distances and seeking to provide improve safety and amenity for all.
mobility. The City of Melbourne will: pedestrian crossings on all legs of an intersection
Action 3: Convert parts of ‘Little’ streets into pedestrian-
• narrowing traffic lanes and introducing traffic calming
• prioritise space-efficient transport modes priority zones with lower speed limits.
• removing kerbs where possible to create level streets
• improve amenity by designing streets for people as our
first priority • reallocating on-street parking to people space
Pedestrian-priority zones
• seek to remove kerbs where drainage and other • converting some streets into pedestrian-priority zones
considerations allow, to create more permeable and Under the Road Safety Road Rules 2017, people
• reducing space allocated to roads and car parking in or
accessible streets, such as on streets converted to driving vehicles in a shared zone are legally
adjacent to parks
10 km/h pedestrian-priority zones required to give way to people walking. There is
• converting roundabouts to conventional intersections a lack of awareness around legal responsibilities
• use a variety of materials and surfaces to communicate
the unique central city environment • minimising new footpath crossovers (driveways) and in a shared zone as ‘shared’ implies no priority.
making the most of existing ones However, a well-designed shared zone is read
• continue to widen footpaths in the busiest walking areas, intuitively by all road users as a pedestrian-
removing on-street parking where necessary • working towards a maximum of one traffic lane each way priority space.
on all streets in the Hoddle Grid, except King Street.
• integrate streetscape projects with climate change Under the current road rules our best mechanism to
adaptation measures, such as tree planting and water
sensitive urban design
“I love finding different ways Making these changes may have an impact on traffic implement pedestrian-priority zones is to designate
capacity but will improve the people-moving capacity and shared zones and, where necessary, redesign the
• maintain vehicle access for emergency services, people to get to work, exploring safety of our streets. Access for local traffic, residents, street. Our long-term aspiration is to evolve the
with a disability and freight laneways and avoiding streets servicing and deliveries will be maintained. This includes
existing property access from the street, which legally can’t
use of shared zones in a legal and physical sense,
including redefining them under the road rules as
• maintain property access.
which are busy with traffic.” be removed without the property owner’s consent. ‘pedestrian-priority zones’.
Action 1: Develop a Future Streets Framework to design - Victoria, North Melbourne Locations where footpath overcrowding is already a
and deliver streets in the Hoddle Grid based on the 2030 problem will be prioritised, such as Bourke Street, Elizabeth
Proposed Integrated Network established in this strategy. Street, Spencer Street and areas around central city rail
interchanges. The redesign of the Haymarket roundabout
Action 2: Deliver priority footpath widenings across the is a priority, in order to deliver better movement and safety
municipality to reduce overcrowding. outcomes for people walking, riding bikes and using public
transport, particularly once Parkville station opens in 2025.
34 melbourne.vic.gov.au A Safe and Liveable City | Transport Strategy 2030 35You can also read


