THE MASTER PLAN MASTER PLAN - THE NEW YORK CITY INTERNET - nyc.gov/tech - Mayor's Office of the ...
←
→
Page content transcription
If your browser does not render page correctly, please read the page content below

THE
THE NEW YORK CITY
 NEW   YORK CITY
     INTERNET
    INTERNET
  MASTER   PLAN
  MASTER PLAN

              nyc.gov/tech
THE NEW YORK CITY
    INTERNET
  MASTER PLAN

  MASTER PLAN
    INTERNET
THE NEW YORK CITY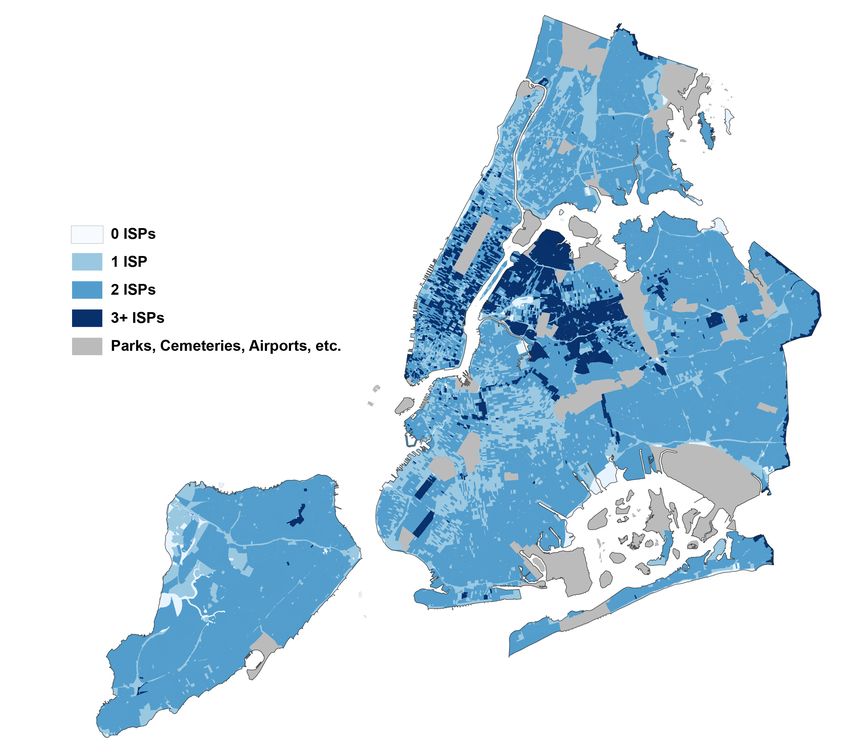
A Message From
Our Mayor
Every New Yorker deserves access to affordable, high-speed internet.

However, the private market solution to broadband service continues to leave out too
many New Yorkers. While a majority of New Yorkers do have access to broadband, more
than 1.5 million residents still have neither a connection at home nor on a mobile device.
Millions more have limited broadband service because they cannot afford the basic
necessity of online access to education, employment, banking, healthcare, and government
services. The quality of service is inconsistent from neighborhood to neighborhood, and
the lack of choice impedes economic opportunity in many parts of our city.

This digital divide, like so many other aspects of life in New York City, leaves a significant
part of our population at a major disadvantage. The New York City Internet Master Plan
lays out a new vision for the City’s role in shaping this essential infrastructure, one that is
oriented toward making broadband a truly universal service for all our citizens.

This plan will build on work our Administration has already done in the area of internet
equality. In the past five years, we have brought free internet service to over 50,000
households through our Department of Education, New York City Housing Authority,
local libraries, and internet service providers.

We have more than tripled the number of free public Wi-Fi hotspots in public spaces. We
launched CS4All to bring Computer Science education to every elementary, middle, and
high school by 2025, and we provide the most robust citywide digital literacy education
program of any city in the country through a network of over 500 public computer
centers. We have been a leader for online privacy and cybersecurity through initiatives like
Library Privacy Week and NYC Secure.

This new Master Plan will redouble our efforts to extend broadband internet service to
all New Yorkers, regardless of income or zip code. We will work with the private sector to
make sure it is available across the five boroughs, close the digital divide, and make sure all
New Yorkers have equal access to the economic, social, and civic power of the internet.

Thank you,

Bill de Blasio, Mayor of the City of New York
Acknowledgments
The Mayor’s Office of the Chief Technology Officer prepared the New York City Internet Master Plan
with support from the Department of Information Technology and Telecommunications, the NYC
Economic Development Corporation, and the members of the Broadband City Asset Task Force. The
report draws on research and analysis conducted by a master planning team led by HR&A Advisors,
with CTC Energy and Technology, Hunter Roberts Construction Group, Stantec, Baller & Lide, and
The New School Digital Equity Lab. The City would also like to acknowledge the diverse range of
stakeholders who shared their expertise and perspectives.

NOTE

The Internet Master Plan is subject to applicable laws, rules, and regulations, including City procurement rules
and processes. The City reserves all rights, including rights to postpone, cancel, or amend this Master Plan at any
time. The City shall not be liable for any costs incurred in connection with the Master Plan.

JANUARY 2020
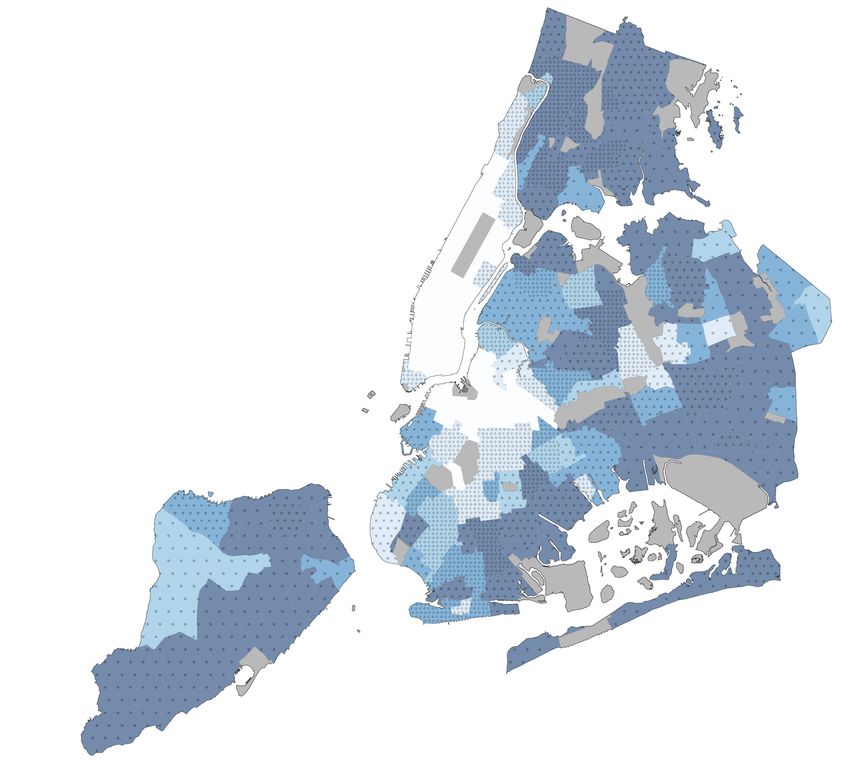
Table of Contents
EXECUTIVE SUMMARY                                         i   PHASES OF IMPLEMENTATION                            55

                                                              Introduction                                        56
INTRODUCTION                                              1
                                                              Phase 1: Introduce New Role for City Government     57
What is an Internet Master Plan for New York City?        2   Phase 2: Establish Partnerships for New Broadband
The Vision of Universal Broadband                         2   Infrastructure and Service                          61

Broadband Principles                                      2   Phase 3: Expand Service to More New Yorkers         62

How New Yorkers Shaped this Master Plan                   3   Phase 4: Ensure All New Yorkers Benefit
                                                              from Connectivity                                   62
A Pivotal Moment for Broadband in New York City           4

                                                              CONCLUSION                                          65
THE ECONOMIC IMPACT OF UNIVERSAL
BROADBAND                                                 5
                                                              DATA SOURCES                                        67
Introduction                                              6
Closing the Digital Divide                                7   GLOSSARY                                            68
Catalyzing Economic Expansion                             8
Improving Public Service Delivery                         9

NEW YORK CITY’S INTERNET TODAY                           11

Introduction                                             12
Universal Broadband Includes Both Home and Mobile
Connections                                              12
Broadband Access and Connectivity in
New York City Today                                      13
Broadband Infrastructure in New York City Today          20
New York City’s Broadband Infrastructure Agreements      30
NYC’s Achievements Toward Universal Broadband            33

THE NETWORK FOR UNIVERSAL BROADBAND                      39

Introduction                                             40
Broadband Technologies                                   41
Network Design                                           45
Methods for Private Financing of Public Infrastructure   52
Table of Figures

Figure 1: An Expanded Role for the City in Broadband Delivery      Figure 23: Internet Transmission Media

Figure 2: Potential Economic Impacts of Universal Broadband        Figure 24: Which Emerging Solutions Suit New York City?

Figure 3: The Impact of Universal Broadband                        Figure 25: Broadband Network Elements

Figure 4: NYC Principles for Internet Service and Infrastructure   Figure 26: Anticipated Real Estate Assets for Potential Citywide
                                                                   Network
Figure 5: Categories of Economic Benefits from Universal
Broadband                                                          Figure 27: Planned Neighborhood-Scale Infrastructure

Figure 6: Potential Economic Impacts of Universal Broadband        Figure 28: Sample Broadband Infrastructure Metrics for Inform-
                                                                   ing the Placement of New Infrastructure
Figure 7: Anticipated Universal Broadband Consumer Internet
Prices                                                             Figure 29: Broadband Network Elements: The Costs and Pace
                                                                   of Change
Figure 8: Assumed Timing of Broadband Network Investments
for Economic Impact                                                Figure 30: Potential Broadband Delivery Models

Figure 9: New Affordable Service with Universal Broadband          Figure 31: Levels of Public Investment

Figure 10: Historic Labor Productivity Growth, United States       Figure 32: An Expanded Role for the City in Broadband Delivery

Figure 11: Projected Labor Productivity Growth under the NYC       Figure 33: Internet Action Plan Timeline
Internet Master Plan
                                                                   Figure 34: Elements of Broadband Assembled
Figure 12: Households in New York City with Home Broadband
                                                                   Figure 35: Data Management Process
or Mobile Broadband
                                                                   Figure 36: Iterative Solicitation for More Service Options Using
Figure 13: New York City’s Digital Divide Relative to Other
                                                                   New Public Infrastructure
Cities’ Total Populations

Figure 14: Home Broadband Adoption: All NYC Households

Figure 15: Home Broadband Adoption: Various Types of NYC
Households

Figure 16: Residential Broadband Prices and Products

Figure 17: Broadband Market Segments

Figure 18: Broadband Roles and Functions

Figure 19: Total Coverage of Different Fiber Delivery Modes

Figure 20: Timeline of Franchise Milestones

Figure 21: New York City Digital Inclusion Resources

Figure 22: Methods of Internet Delivery
Table of Maps

Map 1: Combined Home and Mobile Broadband Adoption
Rates by Public Use Microdata Area

Map 2: Number of Commercial Fiber Internet Service
Providers (ISPs)

Map 3: Home Broadband Adoption in New York City

Map 4: Mobile Broadband Adoption in New York City

Map 5: Maximum Available Broadband Speeds in New
York City

Map 6: Residential Broadband Choice

Map 7: Commercial Fiber Choice

Map 8: Commercial Fiber Coverage

Map 9: Empire City Subway Conduit Coverage

Map 10: Aerial Fiber Coverage and Congestion

Map 11: Fixed Wireless Broadband Service Availability by
Neighborhood

Map 12: Locations of Cellular Antennas on Rooftops and Poles

Map 13: Public Wi-Fi in New York City

Map 14: Public Computer Centers

Map 15: Optimal Areas in New York City for Unlicensed
Millimeter Wave Fixed Wireless Access as a Residential
Broadband Solution

Map 16: Rooftop Fixed Wireless Access Opportunities Based
on Presence of City Buildings

Map 17: Example of Potential Prioritized Areas for Mobile
Wireless

Executive Summary
The internet is essential. As daily life in our city increasingly requires broadband connectivity, every New Yorker must be
able to access and use the internet to its full potential.

New York City thrives on the flow and exchange of information throughout its five boroughs. However, internet service options vary
throughout the city, both in terms of quality and pricing. This inequity reflects underlying disparities in infrastructure and market
competition, impeding full economic and social inclusion.
People and businesses too often encounter an unaffordable cost of service, which is the biggest barrier to internet adoption in New
York City. Achieving universal broadband will require lower-cost options for home and mobile service as well as no-cost access at
computer centers, in public spaces, and through wireless corridors. No New Yorker should have to choose between a mobile phone
bill and a monthly food bill.
The Internet Master Plan is a bold, far-reaching vision for broadband infrastructure and service in New York City. It frames
the challenges of achieving universal connectivity, clearly states the City’s goals for the next generation of internet service, and
outlines the actions the City will take to help all service providers contribute to those goals. It is both comprehensive in its view
of the city and tailored to each neighborhood’s unique conditions. The Master Plan presents public and private actors with
the opportunity to address major, persistent gaps in infrastructure; deliver higher-performing connectivity for residents and
businesses; and set a course for eliminating the digital divide in New York City.

VISION AND PRINCIPLES
The City of New York envisions an internet for all New Yorkers that is founded upon five principles – equity, performance,
affordability, privacy, and choice. These principles will serve as measures for success and as design parameters for the City’s
approach to broadband infrastructure and services. The five principles are:

               Equity                      No one will face a barrier based on who they are or where they live.

                                           The internet should be fast and reliable, and the quality should improve over
               Performance                 time as uses of the internet continue to evolve.

      $        Affordability
                                           Cost should not be a barrier for any New Yorker who wants to connect
                                           to the internet.

               Privacy                     New Yorkers must be able to determine how their data is or is not used.

                                           There should be sufficient competition among providers and diversity of
               Choice                      technological solutions to sustain the other principles.

The Challenge
Today, there is a large digital divide in New York City.
The majority of New Yorkers use a mobile connection                 at home is essential for doing homework or applying for
and a home connection, and they increasingly need both              a job. However, 40% of New York City households do
to make full use of the internet. Mobile connectivity is            not have this level of comprehensive connectivity, which
especially critical for people who commute to service jobs          means that 3.4 million residents are excluded, entirely or
or for those with unstable housing, while a connection              in part, from digital life.

                                                                                          The NYC Internet Master Plan | Executive Summary   i
40% of New York City households lack the combination of
        home and mobile broadband, including 18% of residents –
        more than 1.5 million people – who lack both.
     Map 1: Combined Home and Mobile Broadband
     Adoption Rates by Public Use Microdata Area 1
     Source: 2017 5-Year Estimate of Presence and Type of
     Internet Subscription in the Household data, provided by
     the American Community Survey. The legend categories
     represent the following percentages: Low 34%-54%,
     Low Medium 55%-60% High Medium 61%-66.5%, High
     67%-81%.

     DISPARITIES IN SERVICE
     The private market has failed to deliver the internet in       digitally-connected households. 46% of New York City
     a way that works for all New Yorkers. Citywide, 29% of         households living in poverty do not have broadband at
     households do not have a broadband subscription at             home. A map of internet service rates in New York City
     home. The same percentage of households are without            bears a striking resemblance to a map of poverty rates.
     a mobile broadband connection. The substantial overlap
                                                                    Internet use is foundational to economic mobility,
     between these under-connected populations means that
                                                                    but current broadband subscription costs can impose
     18% of residents – more than 1.5 million New Yorkers –
                                                                    a considerable burden on the budgets of low-income
     have neither a mobile connection nor a home broadband
                                                                    families. New York City households living in poverty might
     connection. This significant portion of the city’s residents
                                                                    need to spend as much as 10% of their monthly budget to
     face barriers to education, employment, banking,
                                                                    have a home broadband connection and a single mobile
     healthcare, social networks, and government services in
                                                                    connection.2 These expenses further strain households
     ways that other residents do not.
                                                                    already struggling to pay rent, access healthcare, and buy
     The millions of underconnected New Yorkers tend                food.
     to have lower household incomes compared to more

ii   The NYC Internet Master Plan | Executive Summary
Today in New York City, competitive residential relatively sparse throughout the rest of the city. The most
broadband markets exist almost exclusively in high-density sizable gaps are in areas of Brooklyn and Queens where a lack
neighborhoods with high-income households. Areas with of accessible conduit or utility poles limits opportunities for
three or more residential broadband providers have an new services.
average household income 50% greater than households
New Yorkers who live in these neighborhoods have fewer
in areas with only two providers. A choice among several
service options, which may be of lower quality. Gaps in fiber
service providers can lead to greater affordability and
optic infrastructure can limit the types of businesses that take
improved service, as companies differentiate their
root in a neighborhood or the potential for small businesses
products and compete for customers.
already there to grow and adopt new technologies. Residents
in these neighborhoods are less likely to experience the
GAPS IN INFRASTRUCTURE benefits of future technologies that rely on this infrastructure.
New York City suffers from disparities in the presence of Over time, without broadband as a foundational resource,
fiber optic infrastructure, which is the basic building block neighborhood economies risk losing ground in the face of
of internet connectivity and a critical driver of economic regional, national, and international competition. The digital
development. Lower Manhattan has more options for divide in New York City is a serious barrier to economic
commercial broadband service than perhaps anywhere opportunity for residents and small businesses and a threat to
else in the country. However, fiber optic infrastructure is long-term economic growth.
Map 2: Number of Commercial Fiber Internet Service
Providers (ISPs)
Source: December 2017 FCC Form 477 Version 2 data, analyzed
by the NYC Mayor’s Office of the CTO.
The NYC Internet Master Plan | Executive Summary iiiStudents at P.S.188, The Island School in 2015
Source: Michael Appleton/NYC Mayoral Photography Office
The Plan with robust, reliable service at home and at other fixed
locations. It will prioritize and optimize “open access”
The City of New York will take advantage of a once- or “neutral host” infrastructure, which can be shared by
in-a-generation opportunity to dramatically reshape multiple operators to lower costs, increase competition,
its role in enabling affordable, reliable broadband minimize physical disruption to the city, and incentivize
service for all. In addition to the urgent need to address private-sector investments to reach and serve customers.
disparities in infrastructure and service, the City is
entering what may be the most pivotal period for its Based on the data and analyses contained in this Master
communications infrastructure since the dawn of the Plan, the City has determined that universal broadband
internet. The franchise agreements that establish the calls for an open access fiber optic infrastructure built out
basic framework for broadband deployment in New York to nearly every street intersection with an aggregation
City are approaching key milestones. Simultaneously, point in every neighborhood. Leveraging City real estate
emerging wireless technologies are accelerating private- assets3 and public rights-of-way will allow network
sector demand for public assets while also lowering the operators to extend fiber optic infrastructure from the
barriers for new providers to enter the markets for both intersection to a pole or building and deliver service
using any of a number of potential technologies. This
home and mobile broadband service.
new infrastructure will support the rapid and equitable
deployment of multiple choices for service.
NETWORK EXPANSION
The planned infrastructure, were it to be built entirely
Universal broadband throughout the five boroughs will
new throughout the whole city and rely on the open
require a network of multiple operators using a range
access conduit system in Manhattan and in the Bronx, is
of technologies. This network will support multi-modal
estimated to cost $2.1 billion. The Master Plan prioritizes
use of the internet: constant, seamless mobile service
iv The NYC Internet Master Plan | Executive Summaryinfrastructure development for neighborhoods that have
low levels of commercial fiber service and where new
construction opens the way for new providers and services.
This fiber network will be overlaid with a neutral radio
access network capable of providing mobile wireless
service throughout every neighborhood. This wireless
network will use shared spectrum to support multiple
operators. The mobile network will enable efficient Broadband may be as
deployment of licensed spectrum by commercial operators
to provide the most advanced mobile telecommunications important to New York
services possible. The Master Plan prioritizes mobile
wireless infrastructure in low-income areas where New City in the 21st century as
Yorkers are most dependent on mobile service, as well as in
areas where commercial broadband deployment is already
the subway or electricity
placing the greatest burden on City assets. Determinations was in the 20th century.
will be made on a neighborhood-by-neighborhood basis
and will be adjusted as new information is assessed.
A worker installs mobile wireless equipment on a City lightpole
Source: NYC Mayor’s Office of the CTO
New York City’s digital divide is a barrier to economic opportunity
and a threat to long-term economic growth.
Ò Nearly a third of New York City households do not Ò Neighborhoods with competitive residential
have a broadband connection at home. broadband markets have higher household
incomes than areas without the same level of
Ò More than 1.5 million New Yorkers have neither choice.
a mobile connection nor a home broadband
connection. Ò The Bronx has the lowest broadband adoption rates
of any borough and the disparities are even more
Ò New Yorkers without home or mobile connections pronounced at the neighborhood level.
have lower household incomes compared to more
connected households. Ò Gaps in fiber optic infrastructure are most stark in
areas of Brooklyn and Queens.
The NYC Internet Master Plan | Executive Summary 0
vvFigure 1: An Expanded Role for the City in Broadband Delivery
Real Estate Assets Infrastructure Service
Permit the Permit the Optimize Optimize existing Install, Acquire and
use of private use of public and infrastructure and build new operate, and support
property assets and coordinate open access infrastructure maintain subscribers
public rights- public that can support multiple infrastructure
of-way assets operators and equipment
City’s Role Today City’s Role Expands Role of Partners
IMPLEMENTATION The Impact
This Internet Master Plan marks the beginning of a new era
Universal broadband that is in line with the City’s
for the City in the delivery of broadband infrastructure and
principles will produce transformative and widespread
services. Specifically, the City will:
economic benefits. Broadband may be as important
to New York City in the 21st century as the subway
Ò Coordinate City Processes or electricity was in the 20th century. The means by
The City will build on the interagency contributions which broadband is delivered will shape the future of
to this Master Plan to maintain the consistency and neighborhoods, local industries, and the daily lives of
clarity of City policies as broadband deployment millions of New Yorkers.
increases. Broadband has already unlocked new forces in the local
economy, from the delivery of internet service, to the
Ò Optimize Public Assets development of websites and computer systems, to the
growth of tech companies that have become mainstays of
The City will invite proposals for the coordinated use
the city’s employment landscape. The larger tech sector
of public real estate assets through a new Universal
accounts for over 240,000 jobs in New York City, and the
Solicitation for Broadband (USB). For the purposes of
growth in tech jobs was three times faster than general
this Master Plan, “City assets” refers to those assets
private sector jobs from 2010-2016.4 This technology-
that are owned, operated, or otherwise controlled by
driven economic development has occurred so far with
the City, or available for City use. Private operators
barely 60% of residents being fully connected and many
will be able to respond with requests for assets
neighborhoods facing gaps in service.
from multiple City agencies. The City will prioritize
approaches that enable multiple operators to share The economic and fiscal impacts of realizing this vision
in the use of an asset. The City will review responses will have a transformational impact on New York City’s
to the USB for feasibility of implementation and economy, residents’ quality of life, and the City’s ability to
potential impacts on City resources. operate more efficiently. Based on an analysis of potential
economic impacts of universal broadband, getting all New
Ò Partner on Infrastructure Yorkers connected and establishing equitable infrastructure
citywide could, in the best-case scenario, result in up to
The City will invest in new infrastructure that can be 165,000 new jobs, up to a $49 billion increase in personal
shared by multiple broadband operators. In addition to income, and up to $142 billion in incremental Gross City
its own seed investments, the City will leverage public- Product by 2045. These economic impacts cannot be fully
private partnerships to install, operate, and maintain realized under the current conditions of the internet in the
the infrastructure. city.
Benefits will be most dramatic for those who are currently
Ò Enable Service Delivery
excluded from full participation in the digital economy. A
The City will support and promote the use of new, competitive service market that includes options for low-
shared infrastructure by broadband operators to income New Yorkers will provide newly affordable services
reach more areas with more services. New Yorkers will for 1.2 million households.5
benefit from reliable and affordable broadband options
that meet the City’s principles.
vi The NYC Internet Master Plan | Executive SummaryFigure 2: Potential Economic Impacts of Universal Broadband
Consumer price reductions and broadband-enabled gains in labor productivity will create a more prosperous city economy.
With universal broadband, New York City could gain, in the best-case scenario, up to $142 billion in incremental Gross City
Product, up to 165,000 new jobs, and up to a $49 billion increase in personal income.
$142 B 165 K Jobs $49 B
increase in Gross City Product, a 9.0% newly created, a 2.3% increase over increase in personal income, a 4.1%
increase over baseline projections baseline projections increase over baseline projections
With universal broadband and a strong digital inclusion
strategy, all New Yorkers will experience quality of life Endnotes
improvements. More children will be equipped to succeed 1. These geographic areas that combine multiple neighborhoods are
in school with online resources. More adults will be able Public Use Microdata Areas (PUMAs), which approximate New York
City’s Community Districts and are the smallest unit of measure
to participate in the media and technology sectors of
for combining American Community Survey data on home broad-
the local economy. More seniors will be able to access band and mobile data subscriptions. Predominantly throughout the
health information and care. All New Yorkers will be more Internet Master Plan, the unit of measure is Neighborhood Tabulation
connected to each other in a City where they are protected Areas (NTAs), which approximate a single neighborhood. For more
information on these units see https://www1.nyc.gov/site/planning.
online.
2. Assuming a rate of $50 per month for each service. The U.S. poverty
The City of New York is open to all potential partners threshold is $24,858 for a family of four (source: U.S. Bureau of the
that agree with the principles of equity, performance, Census). Approximately 50% of New York City households in poverty
affordability, privacy, and choice and that want to have a home broadband subscription. The median household income
for households in poverty with broadband is $10,415, for which a $100
contribute to the realization of the New York City Internet
monthly expense for broadband would be 10%.
Master Plan. Ideas, feedback, and suggestions in response
3. City assets may include those that the are owned, leased, or otherwise
to this Master Plan are welcome via email at:
controlled by the City, or available for City use.
InternetMasterPlan@cto.nyc.gov. 4. Office of the State Deputy Comptroller for the City of New York, “The
Technology Sector in New York City,” Office of the New York State
Comptroller (2017) at https://www.osc.state.ny.us/osdc/rpt4-2018.pdf.
5. Affordability assumptions based on the number of households that
could newly subscribe to broadband service based on household
income levels. Analysis compares economic impact study assumptions
of new service pricing to 2016 American Community Survey data.
Analysis assumes that universal broadband includes a more compet-
itive service market and low-cost options for low-income New Yorkers.
Figure 3: The Impact of Universal Broadband
Universal broadband that embodies the City’s principles will drive significant economic growth benefiting all New Yorkers. The
economic and fiscal benefits will result from three expansive transformations: closing the digital divide, catalyzing economic
expansion, and improving public service delivery.
Close the Digital Divide Catalyze Economic Expansion Improve Public Services
• Create ubiquitous access to high- • Improve matches between • Improve delivery of services
speed internet for all New Yorkers employers and workers via online and offline through
new opportunities for skills personalization and more efficient
• Lower consumer prices for
development reinvestment of cost savings
internet services and increase
disposable incomes among • Make regional firms more • Expand the local tax base
low-income New Yorkers competitive via enhanced labor through increased economic
and capital efficiency activity
The NYC Internet Master Plan | Executive Summary viiMayor Bill de Blasio delivers free, connected tablets to families in the Bronx Source: U.S. Department of Housing and Urban Development
01
INTRODUCTION
THIS SECTION INTRODUCES THE INTERNET MASTER PLAN AND
THE VISION, PRINCIPLES, AND PROCESS THAT SHAPED IT.

                           The NYC Internet Master Plan | Section 1: Introduction   1
What Is The Internet Master Plan because the private sector will play an important role.
The Master Plan aligns the City and potential partners
for New York City? from private industry on mutual goals to shape the way
The New York City Internet Master Plan is a broadband networks develop in the decades to come.
comprehensive framework for the infrastructure and
services that provide connectivity to New York City The Vision of Universal
residents and businesses. This Master Plan will guide
City actions and public-private partnerships to transform Broadband
New Yorkers’ access to this essential infrastructure for The City of New York first outlined a vision for universal
generations to come. broadband access in One New York: The Plan for a Strong and
It is the first such master plan by any big city in America. Just City (OneNYC), released in April 2015. OneNYC set a
It is also just the beginning in an anticipated decades-long goal for universal connectivity.1 Acknowledging that access
focus on a more equitable and economically productive to high-speed internet is not a luxury, but an essential
internet to benefit all New Yorkers. service that New Yorkers depend on to communicate,
make a living, and access essential goods and services,
The Master Plan is presented in four sections founded on OneNYC included five initiatives to achieve ubiquitous
distinct areas of study: connectivity:
Ò The Economic Impact of Universal Broadband Ò Promote competition in the residential and
This section presents the number of jobs, increase in personal commercial broadband markets.
income, and economic growth in the overall economy that the City
expects from universal broadband. Ò Provide high-speed, residential internet service for
low-income communities without internet service.
Ò New York City’s Internet Today
Ò Increase investment in broadband corridors to reach
This section presents the current rates of broadband adoption and
high-growth business districts, with a focus on
conditions of broadband infrastructure in New York City.
emerging outer borough hubs.
Ò The Network for Universal Broadband
Ò Upgrade and expand public broadband to create high-
This section describes the public assets, infrastructure, and range speed citywide access.
of technologies that will deliver universal broadband in New York
City. Ò Invest in innovative ways to provide high-speed
internet to homes, businesses, and the public.
Ò The Phases of Implementation
The City renewed this commitment in OneNYC 2050:
This section establishes the overall strategy and priority actions Building a Strong and Fair City, released in April 2019,
that the City will take to implement the Internet Master Plan which emphasized the City’s pledge to improve digital
through a new approach to City assets and a new Universal infrastructure to meet the needs of the 21st Century.2
Solicitation for Broadband.
This Master Plan addresses the varied conditions in existing Broadband Principles
infrastructure across New York City. It includes data on these
conditions that inform proposed solutions that are specific to The City has established five principles to guide City actions
the neighborhood level or, in some cases, to the census block and partnerships with private internet service providers and
level. A Master Plan is not a precise prescription, but a long- related companies: equity, performance, affordability,
term path toward a desired outcome to steer future public privacy, and choice. As shown in the chart below, the
and private investments in infrastructure. City has previously applied these principles to internet
service broadly, but they are equally applicable as a guide for
This Master Plan uses certain dollar amounts and broadband infrastructure development in particular. These
timeframes to inform calculations and to present options, principles serve as both an evaluative tool and an aspiration
but it does not prescribe what New Yorkers should be for the infrastructure, service, and governance initiatives of
paying for internet service, what the City will invest, or the Master Plan. They are intended to structure the next era
which company will deliver that service. It does not specify of City broadband policy.
a timeframe for achieving universal broadband – not least
2 The NYC Internet Master Plan | Section 1: IntroductionHow New Yorkers Shaped This agencies that collectively control approximately 11,000 City
facilities and other potential broadband-related infrastructure
Master Plan assets across the city.3
The strategies in this plan have been shaped by the voices,
writings, research, and analysis of a diverse range of
stakeholders. Numerous City agencies; internet service NYC Connected Request for Information
providers; companies that build the infrastructure and In 2017, the City issued a Request for Information (RFI), in
equipment for broadband service; advocates for worker concert with the development of this Internet Master Plan,
rights, consumer rights, and digital inclusion; and a wide to solicit ideas for potential strategies and partnerships
array of other subject matter experts have provided input to achieve universal broadband connectivity in New
for this Internet Master Plan. York City.4 The NYC Connected RFI garnered over fifty
Broadband City Assets Task Force responses, representing a wide range of stakeholders from
the private and non-profit sectors, as well as a wide array
As New York City enters an era of exponential increase of other subject matter experts. Among other information,
in private sector demand for the use of public rights-of- the responses provided information on potential network
way and City property for broadband infrastructure and architecture and emerging technologies, use of City assets,
equipment, it is more important than ever that the City approaches to network construction, business parameters,
maintain a coordinated and standardized approach to and collaboration opportunities.
managing its City assets and related procedures. For the
purposes of this Master Plan, “City assets” refers to those Over a dozen internet service providers operating in the
assets that are owned, leased, or otherwise controlled by the city responded to the RFI, including both large service
City, or available for City use. providers active in most neighborhoods across the city
and niche or startup providers who wish to expand their
In August 2018, the City established the Broadband City Assets service in New York.
Task Force (BCATF), an internal team to coordinate the use
of City assets for broadband infrastructure deployment. The
BCATF is comprised of representatives from seventeen City
Figure 4: NYC Principles for Internet Service and Infrastructure
PRINCIPLE WHAT THE PRINCIPLE MEANS FOR:
Internet Service Internet Infrastructure
No one will face a barrier based on who they The infrastructure has capabilities throughout the city, able to reach all
Equity
are or where they live. residents and businesses everywhere, outdoors and indoors.
The infrastructure supports both fixed and mobile service. It is capable
of at least gigabit-per-second service to all fixed locations, with
The internet should be fast and reliable, and
substantial additional capacity for future demand and supporting rapid
Performance the quality should improve over time as uses of
deployment of new technologies. The infrastructure is reliable and
the internet continue to evolve.
resilient, designed to withstand equipment failures, power outages,
natural disasters, or manmade disasters.
The design minimizes capital and operating costs, has a long useful
Cost should not be a barrier for any New
Affordability lifespan, and provides low-cost upgrade paths to meet future demands
Yorker who wants to connect to the internet.
or accommodate new technologies.
The infrastructure reaches residences and other safe locations. The
New Yorkers must be able to determine how network’s components are secure against physical and cyber threats.
Privacy
their data is or is not used. The infrastructure supports private physical and virtual networks that
ensure data integrity and the privacy of user data.
There should be sufficient competition among The infrastructure is designed to be shared by multiple service
Choice providers and diversity of technological providers, and competition is never curtailed due to network capacity,
solutions to sustain the other principles. physical space in network hub locations, or technology choices.
The NYC Internet Master Plan | Section 1: Introduction 3Digital Access, Digital Literacy, and focused governmental action, private investment alone
Development Research will determine how these technologies shape connectivity
in the city. Allowing industry to dictate connectivity will
In 2018, the City conducted interviews and focus groups
reinforce the current distribution of access and undermine
with individuals from twenty-eight organizations and
the equitable allocation of new services.
City agencies that provide digital inclusion services
and related trainings. In addition to highlighting how The Internet Master Plan establishes a decision-making
essential those services and trainings are for achieving framework for the City of New York to guide a major
universal broadband, this research explored the contours digital transformation, harnessing connectivity to advance
of residents’ practices, concerns, and barriers when using economic, social, and infrastructure development. The
the internet, focused on those who are not served well by City will play a more active role in ensuring that all New
the broadband market today. This perspective has critically Yorkers share in the benefits of internet connectivity.
informed this Master Plan in its focus on neighborhood-
scale intervention with a combination of mobile and fixed
broadband service.
Endnotes
A Pivotal Moment for 1. The City of New York, “One New York: The Plan for a Strong and Just
City,” (April 2015) at http://www.nyc.gov/ html/onenyc/downloads/
Broadband in New York City pdf/publications/OneNYC.pdf.
2. The City of New York, “OneNYC 2050: Building a Strong and
The next generation of wireless technology is the first Fair City: Modern Infrastructure,” (April 2019) at http://onenyc.
to arrive in the mobile-first era. The deployment of cityofnewyork.us/strategies/modern-infrastructure/.
such technologies will define a whole range of urban
3. Information on City facilities can be found in the Facilities Database
applications that rely on connectivity, from sensor data maintained by the New York City Department of City Planning,
usage to virtual reality, and will shape how New Yorkers available at https://www1.nyc.gov/site/planning/data-maps/open-
move through the city, connect to each other, and interact data/dwn-selfac.page.
with local government. 4. New York City Mayor’s Office of the Chief Technology Officer,
“NYC Connected Request for Information,” (November 14, 2017) at
This is a potential turning point in the history of internet https://tech.cityofnewyork.us/wp-content/ uploads/2018/11/NYC-
infrastructure and governance. Without meaningful and Connected-RFI.pdf.
Patrons use the Shelby White and Leon Levy Information
Commons at the Brooklyn Public Library
Source: Gregg Richards/Brooklyn Public Library
4 The NYC Internet Master Plan | Section 1: Introduction02
THE ECONOMIC
IMPACT OF UNIVERSAL
BROADBAND
THIS SECTION PRESENTS THE NUMBER OF JOBS, INCREASE IN
PERSONAL INCOME, AND GROWTH IN THE OVERALL ECONOMY
THAT THE CITY EXPECTS COULD BE ACHIEVED THROUGH
UNIVERSAL BROADBAND.
The NYC Internet Master Plan | Section 2: The Economic Impact of Universal Broadband 5Introduction
Universal broadband is essential for economic inclusion and will lead to widespread benefits. The economic and fiscal
benefits will result from three broad transformations: closing the digital divide, catalyzing economic expansion, and
improving public service delivery. Consumer price reductions and broadband-enabled gains in labor productivity will
create a more prosperous New York City. With universal internet access, New York City could gain, in the best-case
scenario, up to $142 billion in incremental Gross City Product, up to 165,000 new jobs, and up to a $49 billion increase
in personal income. In contrast to current conditions, New Yorkers will have increased disposable income, achieved
through reduced consumer prices, and will be positioned to benefit from quality of life improvements stemming from the
ability to afford high-quality internet. Universal broadband will result in greater economic efficiencies, enhancing labor
productivity, lowering production costs, and accelerating regional competitiveness for local firms. It will facilitate lifelong
learning to promote a more agile workforce that is primed for the economy of the future.
Figure 5: Categories of Economic Benefits from Universal Broadband
Close the Digital Divide Catalyze Economic Expansion Improve Public Services
• Create ubiquitous access to high- • Improve matches between • Improve delivery of services
speed internet for all New Yorkers employers and workers via online and offline through
new opportunities for skills personalization and more efficient
• Lower consumer prices for
development reinvestment of cost savings
internet services and increase
disposable incomes among • Make regional firms more • Expand the local tax base
low-income New Yorkers competitive via enhanced labor through increased economic
and capital efficiency activity
Ubiquitous connectivity will allow businesses to locate only marginally connected to the internet.
anywhere in the city, not just where there is access to
The full benefits of universal broadband come by pairing
secure fiber connections today, which will increase
infrastructure and economic improvements – the focus
new commercial development outside the current
of this Master Plan – with programs that support New
commercial cores.
Yorkers to acquire the resources and skills to live, learn,
Finally, having all New Yorkers online will improve and access opportunity in a digital age, particularly
municipal service delivery. The City will have more among users with limited prior exposure to the internet.
affordable broadband service for its own needs and This economic impact analysis assumes these programs
greater ability to deliver services to residents online. are sufficiently in place to support the adoption of
A future with universal broadband could bring about affordable broadband by all households.
significant public cost savings, which could then be
reinvested to reduce the City’s fiscal burden.
The individual and citywide impacts of universal With universal internet
broadband are linked. This economic impact analysis
draws on a combination of econometric modeling
access, New York City stands
techniques, qualitative indicators, and narrative case to gain up to $142 billion
studies to analyze the benefits of comprehensive
connectivity for New York City’s economy as a whole. It in incremental Gross City
shows the magnitude of possible benefit over time and
provides an indication of the breadth of impacts that Product, up to 165,000 new
come from connecting all New Yorkers with affordable,
reliable broadband service. The entire city would
jobs, and up to a $49 billion
benefit, but the greatest impacts would be with the increase in personal income.
people and neighborhoods that today are unserved or
6 The NYC Internet Master Plan | Section 2: The Economic Impact of Universal BroadbandFigure 6: Potential Economic Impacts of Universal Broadband
Consumer price reductions and broadband-enabled gains in labor productivity will create a more prosperous city economy.
With universal broadband, New York City could gain, in the best-case scenario, up to $142 billion in incremental Gross City
Product, up to 165,000 new jobs, and up to a $49 billion increase in personal income.
$142 B 165 K Jobs $49 B
increase in Gross City Product, a 9.0% newly created, a 2.3% increase over increase in personal income, a 4.1%
increase over baseline projections baseline projections increase over baseline projections
This analysis is almost certainly the first of its kind by of capital investment, the ownership model, and the
any big city in the United States. It relies on extensions particular technology deployed, as long as the assumed
of the tangible impacts already attributed to widespread cost savings materialize. It is not tied to any particular
broadband use. This analysis uses the REMI Policy set of actions, only the end state of universal broadband
Insight Model (PI+)1 to dynamically measure the service that meets the City’s requirements and
impacts of universal broadband by comparing it to principles. The analysis does not take into account the
baseline projections for New York City’s economy costs associated with achieving the desired outcomes.
absent universal broadband. Other studies have treated
broadband as simply another commodity rather than as Figure 7: Anticipated Universal Broadband Consumer
a catalyst for transformation and a fundamental need Internet Prices2
for participation in modern economic, civic, and social
activity. Potential Cost Savings from Today’s Anticipated Universal Broadband
Observed Subscription Prices (2018$) Subscription Prices (2018$)
The analysis assumes that all components required
for universal broadband are in place. Rather than only $9.99
measuring the benefits of particular actions in the short-
$4.99
term, the Master Plan assumes that all complementary
investments, policies, and programs have been enacted $70.00 $39.99
to ensure the optimal outcome over time. Therefore, $50.00
the estimates of economic impact represent a best-case $15.00
scenario.
Premium Product Standard Product Reduced Cost
For the purpose of this analysis, the time span for Product
implementation is presumed to occur over more than
two decades, with the impacts of universal broadband Closing the Digital Divide
first fully accruing in the year 2045. The measures
described in Section 5 of this Master Plan (The Phases The universal broadband envisioned by this Master Plan
of Implementation) – and the level of response from the will drive down prices for internet service, bringing more
private sector – will shape the actual rate of progress New Yorkers online and saving other households money
towards universal broadband in New York City. This on their monthly bills. Based on global pricing for gigabit
economic benefits analysis is agnostic to the source speed connectivity and general observations related to
Figure 8: Assumed Timing of Broadband Network Investments for Economic Impact
High-Speed Internet & Mobile Infrastructure
2020 2025 2022–2037 2028–2041 2045
NYC New entrants to the Adoption of broadband- Development of Impact
Internet market start to drive enabled technology broadband-supported reporting
Master Plan down consumer prices drives productivity applications brings year
gains within physical about new wave of
industries productivity growth
among digital industries
The NYC Internet Master Plan | Section 2: The Economic Impact of Universal Broadband 7the elasticity of internet products (i.e., demand changes
as more providers become active in the marketplace), this Open manhole with fiber optic splice cases
Master Plan projects that enhanced competition and new Source: NYC Mayor’s Office of the CTO
affordability thresholds will reduce the costs for three
potential tranches of service.3
Universal broadband service that fosters a more
competitive service market and provides options for
low-income New Yorkers will provide newly affordable
at-home access for up to 1.2 million households. The
savings for a household are projected to range from $4.99
to $39.99 per month.4 By eliminating the barrier of cost,
this plan is projected to meaningfully increase broadband
adoption among an many as 650,000 non-subscriber
households without affordable service and benefit up to
600,000 existing household subscribers who are paying
unaffordable rates.
Catalyzing Economic Expansion
Broadband has become a near-essential service for
businesses operating in the 21st century economy.
Broadband infrastructure is a prerequisite for New York
City to compete with other global cities. With broadband
Universal broadband will bring
as a ubiquitous, foundational resource, New York City can more New Yorkers online and
maintain its competitive advantages over other U.S. and
international cities. save others money on their
Broadband service enhances competitiveness of businesses monthly bills. Savings may be
via increased efficiency, and by creating better matches
between employers and workers via increased labor force felt most strongly by current
access. For example, high-quality video streaming is
positioned to benefit the city’s economy through emerging subscribers who are paying
media distribution platforms that can continue to support
New York City’s status as a global media center. Robust
unaffordable rates today.
citywide broadband infrastructure allows firms to locate in
any neighborhood and contribute to this sector. Increased Labor Force Access
The three general ways broadband contributes to growth Universal broadband could create up to 165,000 new jobs
are through increased business activity, increased labor across all sectors, with better matches between employers
force access, and increased commercial and residential and workers. This sum represents a 2.3% increase over the
development. baseline.
About half of all incremental growth in labor productivity
Increased Business Activity
can be attributed to investment in the adoption of
Based on past trends in technology-enabled booms in new technologies. Already, the local talent pipeline is
labor productivity, universal broadband could grow the challenged to keep pace with the needs of a modern
local economy by up to $142 billion in Gross City Product, labor market. In New York City, there is a significant
a 9% increase over baseline projections.5 gap between the average annual number of openings for
Historically, the adoption of technological innovations middle-skilled jobs with living-wages and the number of
has allowed workers to do their jobs faster and more graduates from relevant local degree-granting programs,
effectively, driving increased labor productivity. Going which suggests opportunities for new forms of training
forward, capital investments in new broadband-enabled and education to expand matches between local talent and
technologies are similarly expected to drive efficiency employment opportunities. Between 2008 and 2017, the
gains, as they did during the dot-com technology boom average annual gap in New York City was 350,000 jobs.6
period from 1995-2004, lowering the costs of production Future technology shifts can change how ever-growing
and attracting new businesses. demand for skills training and talent development is met.
8 The NYC Internet Master Plan | Section 2: The Economic Impact of Universal BroadbandFigure 9: New Affordable Service with Universal Broadband
Up to +1.2 M households with newly affordable
broadband access
12% 21% Existing subscribers paying unaffordable rates
Existing subscribers paying affordable rates
Non-subscribers with affordable service
19%
Non-subscribers without affordable service
48%
*Subscriber data provided by American Community Survey from 2017. Affordability
assumptions based on the number of new households that could subscribe to
broadband service based on household income levels; analysis completed using
economic impact study assumptions on new service pricing versus American
Community Survey Data from 2017. Universal broadband state assumes a more
competitive service market and discounted services or government subsidies for
low-income households, such as the federal Lifeline program.
Increased Commercial and Residential services. Telehealth can reduce costs to elderly patients
Development and caretakers alike, including those associated with travel,
Expanding broadband infrastructure across the city hospitalization, home health aides, and lost wages. These
may unlock commercial development potential in savings will be similar to the significant cost difference
underinvested areas outside of the Manhattan core. New in providing New Yorkers with 311 information services
infrastructure is estimated to spur up to 45 million square through a website or smartphone app compared to a live
feet of occupied commercial space.7 This could provide phone call.
New Yorkers with new opportunities for employment Overall, the potential cost savings for New York City from
in neighborhoods closer to where they live.8 Enhanced universal broadband could reach as much as $4.3 billion,
productivity in physical sectors such as construction driven by anticipated improvements in workflows, the
may increase the capacity to address critical citywide ability to negotiate lower municipal rates for broadband
challenges.9 services, and efficiencies in contract service management.11
This assumes individual expenditures will continue to be
evaluated based on the benefits of the specific program.
Improving Public Service Delivery
These economic impacts from closing the digital divide,
Citywide economic expansion supported by universal catalyzing economic expansion and improving public
broadband will create a larger tax base, generating new service delivery cannot be fully realized based on the
revenue streams to support City operations and services. conditions of the internet in the city today. While all
New Yorkers will benefit from universal broadband, these
Universal broadband is positioned to help the City
impacts will be most dramatic for those who are currently
reduce cost as a barrier to municipal Internet of Things
excluded from full participation in the digital economy
deployments, prepare for increasing demand for
or who rely most heavily on City services. A detailed
services, and limit the financial burden from a potential
assessment of the gaps in access, connectivity, and the
exponential growth in municipal internet needs.
underlying infrastructure makes clear which residents
“Smart City” technologies can reduce local government
and neighborhoods stand to benefit most from closing the
expenditures by as much as 5%, based on industry-wide
digital divide.
projections.10 Telehealth – the ability to manage one’s
health and health care services though digital information
and communication – has the potential to reduce
emergency room visits by expanding access to regular
preventative care and providing remote consultation
The NYC Internet Master Plan | Section 2: The Economic Impact of Universal Broadband 9Figure 10: Historic Labor Productivity Growth, Figure 11: Projected Labor Productivity Growth under
United States12 the NYC Internet Master Plan13
1987–1995 1995–2004 2004–2015
Productivity 600 Productivity
CAGR Boom CAGR Boom
550
Average Annual Labor Productivity
Physical:1.3% Physical: 0.6%
(Thousands, Fixed 2009$)
Digital: 1.9% CAGR Digital: 1.8% 500
220
Total:1.3% Physical: 2.5% Total: 0.9%
Output per Worker
450
Growth (1987–2015)
200 Digital: 4.6% 400
Total: 2.9%
180 350
300
160
250
140 200
150
120
100
100
17
19
21
23
25
27
29
31
33
35
37
39
41
87
89
91
93
95
97
99
01
03
05
07
09
11
13
15
20
20
20
20
20
20
20
20
20
20
20
20
20
19
19
19
19
19
19
19
20
20
20
20
20
20
20
20
Baseline Physical With Broadband Project
Physical Industries Digital Industries Total
Baseline Digital With Broaband Digital
Endnotes
1. This analysis used the REMI Policy Insight Model (PI+) to estimate iftf.org/humanmachinepartnerships/. Estimate applied to American
the impacts of universal broadband on all aspects of the local economy Community Survey 5-Year Estimates, 2012 – 2016, New York City, Age
between 2020 and 2045. PI+, developed by Regional Economic Models, and Sex Tables, 2017 Estimates.
Inc. is frequently employed by local governments, economic devel-
7. This figure is calculated using current industry standards for job
opment and transportation authorities, to measure the impacts of
density applied against incremental new employment attributable
regional economic changes. PI+ is particularly adept at measuring the
to universal broadband. The analysis assumes broadband will unlock
long-term impacts of infrastructure investments that fundamentally
office districts in the outer boroughs, compared to Manhattan which is
alter underlying economic relationships between economic output,
already developed and significantly more space-constrained. The pro-
factors of production, prices, and demographic factors.
jected broadband-related increase in general office space is about 3% of
2. Cost savings are based on 25% blended cost savings rate across speed the citywide total office stock.
offerings and affordability thresholds and HR&A analysis of service
8. HR&A analysis of new commercial development demand supported
fees. See “Residential Pricing Information from the Four Largest ISPs
by broadband-generated job growth (per the findings of this study);
Serving New York City” Appendix in NYC Mayor’s Office of the Chief
assumes a 10-15% commercial vacancy rate in non-core districts.
Technology Officer, “Truth in Broadband: Access and Connectivity in
New York City,” (April 2018) at https://tech.cityofnewyork.us/wp-content/ 9. HR&A analysis using American Community Survey, 2016 data,
uploads/2018/04/NYC-Connected-Broadband-Report-2018.pdf. informed by REMI model output for construction industry labor
productivity.
3. This analysis assumes that internet service providers will meet this
threshold with means-tested reduced-cost products or government will 10. HR&A analysis; assumes a conservative estimate of 5% efficiencies
subsidize broadband service for the lowest income New Yorkers who are across all cost categories owing to enhanced performance, efficien-
unable to afford broadband service at market rates, for example with a cy, and management of resources. Literature reviews performed by
program along the lines of the federal Lifeline consumer subsidy. HR&A indicate that potential cost savings could be in the order of 10
- 40% across certain categories. Literature reviewed includes: Deloitte
4. For more detailed comparisons, see the price chart in NYC Mayor’s
Center for Government Insights, “Funding and Financing Smart Cities,”
Office of the Chief Technology Officer, “Truth in Broadband: Access
(2017); McKinsey Global Institute, “AI Frontier Discussion,” 2017; ABI
and Connectivity in New York City,” (April 2018) at https://tech.city-
Research, “Smart Cities and Cost Savings,” 2017.
ofnewyork.us/wp-content/uploads/2018/04/NYC-Connected-Broadband-
Report-2018.pdf. 11. For the purposes of analysis, this plan projects that the amount of
investments to improve public service delivery and support future
5. Figures based on HR&A analysis of REMI regional forecasts for NYC.
growth are equal to the amount of cost savings.
For this Internet Master Plan, HR&A collaborated with CTC
Technology and Energy, the Digital Equity Laboratory at The New 12. Bureau of Labor Statistics, “KLEMS Combined Sector and NIPA-Level
School, Baller Stokes & Lide, Hunter Roberts Construction Group, and Manufacturing and Non-Manufacturing Multifactor Productivity
Stantec. Tables by Measure,” (1987-2017), available at https://www.bls.gov/mfp/
mprdload.htm.
6. HR&A analysis of existing skills gap; middle-skill defined as high-school
to bachelor’s degree; living wage is average hourly wage of $15.21 or 13. Projections are outputs of the REMI model. HR&A methodology
higher per the MIT living wage calculator. Center for an Urban Future, was informed by a literature review, including: National Bureau of
“New York Works: Creating Good Jobs, City of New York,” (2017). Economic Research (NBER), “Is U.S. Economic Growth Over? Faltering
Conservative estimate of future employment trends based on literature Innovation Confronts the Six Headwinds,” (2012); NBER, “Recent
review of: World Economic Forum, “The Future of Jobs: Employment, Manufacturing Employment Growth: The Exception That Proves the
Skills and Workforce Strategy for the Fourth Industrial Revolution,” Rule,” (2017); The Brookings Institution, “Why is US Productivity and
(2016) at http://www3.weforum.org/docs/WEF_Future_of_Jobs.pdf; Growth So Slow?,” (2016); The Brookings Institution, “Capital, Labor,
OECD, “Getting Skills Right: Assessing and Anticipating Changing and Productivity,” (1999); NBER, “Challenges to Mismeasurement
Skill Needs,” (2016) at https://www.oecd.org/education/getting-skills- Explanations for the U.S. Productivity Slowdown,” (2016); McKinsey
right-assessing-and-anticipating-changing-skill-needs-9789264252073- Global Institute, “The Productivity Puzzle: A Closer Look at the United
en.htm; The Institute for the Future and Dell Corporation, “The States,” (2017).
Next Era of Human-Machine Partnerships,” (2017) at http://www.
10 The NYC Internet Master Plan | Section 2: The Economic Impact of Universal BroadbandYou can also read


