E Whole Picture: Where America's Broadband Networks Really Stand
←
→
Page content transcription
If your browser does not render page correctly, please read the page content below
The Whole Picture: Where
America’s Broadband
Networks Really Stand

BY RICHARD BENNETT, LUKE A. STEWART, AND ROBERT D. ATKINSON

FEBRUARY 2013
TABLE OF CONTENTS

Executive Summary......................................................................................... 4

Overview ....................................................................................................... 8

Starting Points ......................................................................................................... 9

Where Does U.S. Broadband Actually Rank Internationally? ............................. 16

Deployment .......................................................................................................... 16

            Homes Passed........................................................................................... 16

            Deployment Trends ................................................................................. 18

            Number of Providers ................................................................................ 19

            Extremely High Speed Providers .............................................................. 21

            Fiber Deployment .................................................................................... 22

            LTE Wireless Deployment ....................................................................... 25

Adoption ............................................................................................................... 25

            Adoption in the United States .................................................................. 26

            Trends in U.S. Adoption .......................................................................... 27

            How U.S. Broadband Adoption Stacks Up Internationally ....................... 28

            International Adoption Rates ................................................................... 30

            Reasons for Non-Adoption....................................................................... 34

            Subscriber Growth and Churn…………………………………………..36

Performance .......................................................................................................... 37

            High Broadband Speeds and Adoption..................................................... 39

            Average Peak Connection Speeds.............................................................. 40

            Advertised Speed and Actual Speed .......................................................... 41

     THE INFORMATION TECHNOLOG Y & INNOVATION FOUNDATION | FEBRU ARY 2013                                                     PAGE 2
Mobile Broadband ................................................................................... 44
Performance Conclusions ......................................................................... 45
Price ...................................................................................................................... 46
Entry-Level Pricing................................................................................... 46
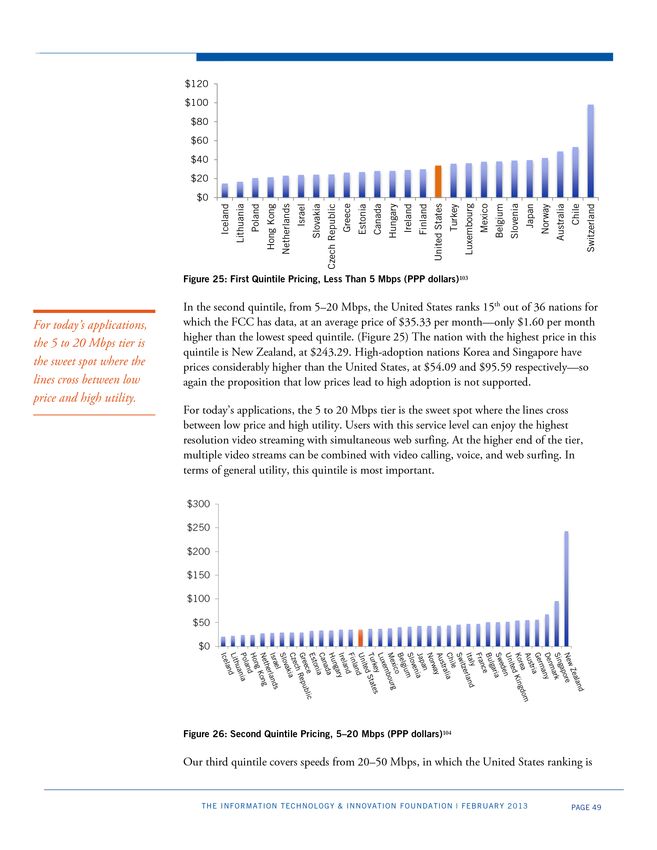
Higher Tier Pricing .................................................................................. 48
The Progressive Pricing Strategy ............................................................... 52
Factors Determining Price ........................................................................ 53
Urbanicity: Density within Cities ............................................................. 59
Criticisms of American Broadband Policy ........................................................ 63
Conclusion .................................................................................................. 67
Endnotes...................................................................................................... 69
Acknowledgements ....................................................................................... 77
About the Authors ......................................................................................... 77
About ITIF .................................................................................................... 77
THE INFORMATION TECHNOLOG Y & INNOVATION FOUNDATION | FEBRU ARY 2013 PAGE 3EXECUTIVE SUMMARY
Taking the whole picture into account, this report finds that the United
States has made rapid progress in broadband deployment, performance,
and price, as well as adoption when measured as computer-owning
households that subscribe to broadband. Considering the high cost of
operating and upgrading broadband networks in a largely suburban
nation, the prices Americans pay for broadband services are reasonable
and the performance of our networks is better than in all but a handful of
nations with densely populated urban areas. Such nations have employed
large government subsidies to leap-frog several generations of technology
ahead of where the market would go on its own in response to changing
consumer demands.
The status of broadband networking in the United States versus other countries has been a
hotly debated topic. Broadband has significant effects on economic growth, education, and
quality of life, and is therefore a matter of immediate as well as long-term concern. ITIF
has reported previously on America’s broadband policy. 1 Other think tanks and advocacy
All in all, the state of groups such as the New America Foundation, Technology Policy Institute, Free Press, and
American broadband is the Berkman Center have commented on this issue, and a number of popular books have
good and getting better, dealt with the subject, two of them in the past few months. 2
but there is still room for
improvement in selected Studies claiming the United States lags in international broadband standing tend to be out-
areas. of-date, poorly-focused, and/or analytically deficient. Many international broadband
reports cherry-pick the wealth of data on the subject in order to reach a foreordained
conclusion. Many ignore the higher costs of building broadband networks in low-
population-density nations such as the United States. Many conflate advertised and actual
speeds, globally ranking the speeds that Internet service providers claim to offer though
little accurate data exist outside the U.S. confirming whether customers receive these speeds
in most nations. Many ignore differences between nations in computer ownership rates,
neglecting the fact that people will not subscribe to broadband, no matter how cheap and
good it is, unless they own a computer. Finally, while most studies take snapshots of the
dimensions their authors deem relevant, a more comprehensive approach would treat each
as a trend line over time. This is important because at any given time, the cost and
performance of any broadband network is in part a function of the generation of
technology that was current when the network was last upgraded. So there’s no inherent
reason to suppose that any nation has a permanent position at the top or the bottom of the
broadband technology curve.
Finally, much international broadband analysis is focused on the elusive number one
position, and many countries can claim that position in one or more metrics in any given
year. All such rankings should be viewed with caution, in part because of the way they
selectively omit data. One measurement will focus on subscriptions, another on speeds, yet
another on prices of bundles of broadband and broadband-enabled services, and still
THE INFORMATION TECHNOLOG Y & INNOVATION FOUNDATION | FEBRU ARY 2013 PAGE 4another on wireless services. Moreover, rankings are not always apples-to-apples
comparisons. Any valid comparison of the United States to other nations must include a
wide array of variables and reflect the demographic, geographic and policy context of the
each nation.
This report seeks to present a comprehensive picture of the health of wired and wireless
broadband networks along four dimensions based on reliable and verifiable criteria:
Taking the whole picture
into account, we find 1. Deployment (the geographic reach of broadband networks)
that the United States 2. Adoption (the number of users who subscribe)
has made rapid progress 3. Performance (speed, latency, and reliability)
4. Price (per unit of usage and speed tier)
in broadband
deployment, performance, Moreover, it attempts to account for exogenous factors (e.g., differences in population
and price. density in urban areas, loop lengths, computer ownership, and public subsidies (through
tax breaks and direct subsidies) that have major influences on deployment, adoption,
performance and/or price. In addition, it measures adoption not only on a per-capita basis,
as the OECD does, but also on a per-household basis, since households are the principal
subscribers to residential broadband. Finally, it focuses on national systems of broadband,
rather than selectively picking high-performing, low-cost networks exclusively serving dense
populations in metropolitan areas.
In addition, by examining the trajectory of broadband progress, we assess where the United
States is heading relative to other nations to highlight both the advantages and the
disadvantages of the road we’ve taken. This holistic view will enable policymakers to better
interpret all too common claims about America’s relative underperformance. It will also
help them to understand the role that broadband policy plays in a field where success
comes from steady focus on making the kinds of improvements and investments that the
economy actually demands, when they’re actually needed, and not from forcing the
construction of infrastructure to serve particular visions of the future that may never come
to pass.
Our chief findings are:
1. America enjoys robust intermodal competition between cable and DSL fiber-based
facilities, with the third-highest rate of wired intermodal competition in the
OECD (behind Belgium and the Netherlands).
2. America leads the world in the adoption of 4G/LTE mobile broadband, a
technology that’s a credible competitor at the lower end of the broadband speed
spectrum and a gateway technology for bringing broadband non-adopters online.
3. Entry-level pricing for American broadband is the second lowest in the OECD,
behind Israel.
4. The average network capacity of all broadband connections in the United States
was 29.6 Mbps in the third quarter of 2012; in the same period, we ranked
seventh in the world and sixth in the OECD in the percentage of users with
performance faster than 10 Mbps.
5. Of the nations that lead the United States in any of the four key metrics
(deployment, adoption, speed and price), no nation leads in more than two.
THE INFORMATION TECHNOLOG Y & INNOVATION FOUNDATION | FEBRU ARY 2013 PAGE 56. In the last few years American firms bought more fiber optic cable than all of
Europe combined. 2011 was the first year in which America’s fiber purchases
exceeded those of 2000, and 2012 orders have remained strong.
7. 82 percent of American homes are passed by a cable technology capable of
supporting broadband speeds of 100 Mbps or higher and a new technology known
as Vectored DSL may soon bring a second 100 Mbps service into the market.
8. Broadband adoption in the United States is not as high as some leading nations,
but our 68.2 percent adoption rate for all households exceeds the EU-15’s 66.9
percent. When looking at adoption rate for households with computers, the U.S.
rate is close to the top 4 percentage points from the leader) and three percentage
points above the EU-15’s 85.9 percent for this population.
9. American broadband service providers are no more profitable than those in the rest
of the world.
10. American broadband prices are progressive: American users of low-speed, entry-
level broadband services pay less than their peers in other countries, but those who
use the fastest services pay more.
While some critics selectively point to some very limited high-performance broadband
offerings in a few scattered foreign cities in an effort to prove that the United States trails
Europe in broadband, the facts strongly suggest otherwise. The United States outpaces EU-
15 nations as a whole on deployment, adoption and speed. This is why European
Commission Vice President Neelie Kroes has called for new European policies modeled on
ours to catch up with the United States, where: “high speed networks now pass more than
80 percent of homes; a figure that quadrupled in three years.” 3 In Kroes’s view, private
investment is the primary driver of broadband progress: “Though the public sector can
help, the real heavy lifting must be done by private investment.” 4 To facilitate private
investment, Vice President Kroes is developing a “Ten Step Plan” for a single, cross-border
European market for broadband that mimics our interstate facilities-based broadband
market. 5
Likewise, some critics point to gigabit rollouts in some cities and nations (e.g., Korea) as
evidence of U.S. broadband failure. But this critique misses two key factors. First, virtually
all of these projects involve public subsidies or are private test bed facilities, not wide-scale
deployments. Second, while gigabit test bed projects (like America’s Gig.U 6) are important,
the idea that most U.S. broadband users currently need networks this fast is simply wrong.
Virtually all existing broadband applications run quite well on the average broadband
network in most U.S. cities. This does not mean that higher speeds may not or will not be
needed as new applications emerge, but the notion that nations should massively overbuild
most of their networks far ahead of real consumer demand is not wise economics nor sound
broadband policy.
For our own part, the United States needs to invest significantly more in policies and
programs that encourage more of our residents to come online and reap the benefits of the
broadband Internet. Pay television (by cable and satellite) is more widely used in the U.S.
than broadband, despite the fact that the prices of pay TV services and TV sets are higher
than those of broadband and computers—suggesting that many households could afford
computers and broadband if they truly valued it. Moreover, bringing more people online
THE INFORMATION TECHNOLOG Y & INNOVATION FOUNDATION | FEBRU ARY 2013 PAGE 6spreads the costs of network operation and investment while increasing the social benefits
of broadband.
We should also continue our policy of relying on intermodal competition in areas where
population density will support it, as it continues to provide considerable benefits in terms
of investment and service improvement. However, we must also recognize that broadband
service in many less-densely populated rural areas is not yet capable of sustaining itself
without carefully applied and targeted government subsidies. Finally we cannot rest on our
laurels with respect to spectrum allocation: more needs to be done, especially in
transferring underutilized spectrum from the public sector to wireless broadband.
All in all, the state of American broadband is good and getting better, but there is still
room for improvement in selected areas.
THE INFORMATION TECHNOLOG Y & INNOVATION FOUNDATION | FEBRU ARY 2013 PAGE 7OVERVIEW
Policy discourse on broadband networks generally focuses on broadband networks as
enablers of innovation, and on the beneficial role such innovation plays in enhancing
quality of life and stimulating economic growth. Networks aren’t directly beneficial in their
own right except insofar as they serve as a key component of the full Internet “ecosystem,”
as applications, systems, and processes would not be possible without them. ITIF analyzes
these indirect benefits in its reports on network enabled e-commerce, the smart grid, smart
transportation systems, education, and dozens of other areas. 7 Broadband networks are
products of innovation that become important by enabling further innovation in
applications.
However, there is an increasingly vocal strain of policy discourse that treats networks as an
end product, chiefly important as vehicles for bragging rights in an international
competition. Many of these advocates rely on Organization for Economic Cooperation and
Development (OECD) reports that rank the broadband networks of member nations on
various scales that attempt to measure network deployment, adoption, performance, and
The OECD rankings are price. The OECD rankings are a very useful effort given the available data and the
a very useful effort, given difficulties in obtaining apples-to-apples data between nations, but they suffer from serious
limitations and the misuse of the data creates more confusion than clarity.
the available data and
the difficulties in The major shortcoming of the OECD reports is the expedient of ranking. No matter how
obtaining apples-to- good the networks of OECD members are—and at this point they are all extremely good
apples data between except in Mexico, Greece, and Israel—there is only one “Number 1” position in any
ranking. This method creates the appearance of scarcity where it doesn’t exist in any
nations, but they suffer
meaningful sense. The determinants of network performance are technologies, and the
from serious limitations nations with the best current technologies are often late entrants, lacking the “innovation
and the misuse of the ecosystem” to take advantage of current speeds. A high-speed network without innovative
data creates more applications is an empty promise, but the two in tandem are enormously beneficial.
confusion than clarity.
OECD data also rely more on surveys than on direct measurement. The OECD collects its
information from governments that may or may not take the obligation of reporting to the
OECD seriously. Passing data from government analysts to the OECD for further analysis
slows down its dissemination, rendering much of the data stale before it becomes available.
Some of the OECD’s most current data dates to 2008 or even earlier—at least a generation
ago in terms of technology and deployment. But there is no comparable dataset that draws
so many data points from so many nations, so the OECD’s efforts are valuable despite their
limited accuracy.
OECD data, and selected studies by such firms as Pando Networks (that inaccurately
deflate network performance by claiming that measurements of the speed of a particular
application are actual network performance measurements), are grist for a mill of policy
criticism aimed at asserting U.S. broadband policy failure. 8 This tendency to overdramatize
broadband data is epitomized by recent books by David Cay Johnston and Susan
Crawford. 9 Self-appointed watchdogs who paper America’s broadband industry with
indiscriminate criticism tend to obscure real shortcomings where they do exist, ignore
successes that should be followed, and encourage policy practitioners and lawmakers to
THE INFORMATION TECHNOLOG Y & INNOVATION FOUNDATION | FEBRU ARY 2013 PAGE 8support policies that are at best unnecessary and at worst destructive to the long-term
dynamics of innovation.
The goal of broadband network policy should be to ensure that conditions exist that will
promote continual improvement in the deployment, adoption, performance, and price of
broadband networks; not to achieve bragging rights in networking, but to ensure that all
citizens enjoy the positive influence of innovation on their lives and on the economy. As
long as we have networks of sufficient quality that we can be sure innovation doesn’t suffer
and the national purse isn’t strained, we should be satisfied—regardless of which nation is
atop any particular ranking in any given year.
Similarly, the fact that America leads the world in the adoption of leading edge 4G/LTE
mobile broadband networks—arguably the most significant technical advance in mobile
since the smartphone, because they’re designed around Internet Protocol (IP)—should not
make us complacent about the looming spectrum crisis that threatens our leadership on
this technology. And, the fact that the United States leads most of the world in making 100
Mbps broadband connections available to the home means very little as long as most
Americans choose not to subscribe to this service tier.
We have a long way to go before every American household has a connected computer,
much less one connected to a broadband network. Until both LTE and 100 Mbps
adoption become universal, we don’t want to be derailed from achieving these goals.
Otherwise, important policy factors that are very much under Washington’s control garner
insufficient attention, which is instead diverted to a raucous debate over fringe issues based
on faulty international assessments.
Starting Points
The Internet was commercialized in the mid-1990s, and the broadband era began shortly
thereafter. The United States had an early advantage with broadband because we invented
the Internet and sat close to its major switching centers, and because we had the makings of
a competitive broadband market in which providers had the ability to compete on the basis
of network performance and a corresponding incentive to invest directly in network
performance. Broadband needs suitable wiring and sophisticated electronics to meet the
needs of users, but most of the world’s communication networks had neither in the 1990s.
The intermodal competition model the United States adopted for broadband made it
possible for ISPs to compete with each other on the basis of speed as well as on price,
unlike the dial-up ISPs that struggled to differentiate themselves from each other when
speed was out of their control.
The wiring for early broadband was a mix of the telephone network’s twisted copper pairs
and cable TV’s coaxial copper cables. In 1999, cable TV was a relatively rare global
phenomenon. For OECD countries as a whole, only 55.7 percent of homes were passed by
cable, but 94 percent of American homes could subscribe to cable if they chose. 10 (See
Table 1)
THE INFORMATION TECHNOLOG Y & INNOVATION FOUNDATION | FEBRU ARY 2013 PAGE 9Percentage of homes passed by
Nation
cable TV, 1999
1 Belgium 96
2 United States 94
3 Netherlands 90
4 Canada 73
5 Luxembourg 73
6 Switzerland 70
7 Denmark 66
8 Hungary 65
9 Sweden 63
10 Finland 60
11 Czech Republic 56
OECD 53
12 Austria 51
13 United Kingdom 50
14 Ireland 48
15 Korea 47
16 Norway 47
17 Portugal 37
18 Slovakia 32
19 Mexico 20
20 Japan 8
21 Spain 7
22 New Zealand 5
23 Italy 5
24 Australia 0
25 Chile 0
26 Estonia 0
27 France 0
28 Germany 0
29 Greece 0
30 Iceland 0
31 Israel 0
32 Poland 0
33 Slovenia 0
34 Turkey 0
11
Table 1: Cable TV Deployment in 1999 in OECD Nations
Despite common claims, the cable TV wiring system is not uniformly or even inherently
superior to that of the telephone system. 12 While coaxial cable has superior noise immunity
to twisted pair, the topology of cable is optimized for delivering TV’s broadcast
programming. The telephone network, on the other hand, is designed for private, person-
to-person communication. One system provides high bandwidth over shared wires, and the
other provides narrow bandwidth over dedicated wires. The Internet works best with high
THE INFORMATION TECHNOLOG Y & INNOVATION FOUNDATION | FEBRU ARY 2013 PAGE 10bandwidth and a minimum of sharing, so each of the two wiring plants possesses both
advantages and disadvantages as an Internet medium.
The fascination with fiber optic cable to the home as a means of Internet use stems from its
ultimate superiority over copper wire of any kind in both dimensions. Fiber most
commonly works in conjunction with copper as a medium for backhaul, aggregating and
connecting neighborhoods to far-away switching centers at high speed. Hence, there’s not
really a dichotomy between fiber and copper in real-world systems; the technical name of
the cable modem network is “Hybrid Fiber-Coaxial” (HFC), for example. Similarly, high-
speed DSL and wireless networks rely on fiber backhaul. However, networks in some parts
of the United States, such as areas served by Verizon and parts of certain other cities
(Chattanooga, Kansas City, and Lafayette, Louisiana, for example) extend fiber all the way
to the home.
While the United States possessed a “cable advantage” over the rest of the world (except for
Belgium) at the turn of the century, we were at a disadvantage in terms of our telephone
network. With the requirement that they cover large suburban and rural areas at the same
price as urban customers, our telephone companies had opted for a wiring plan that
minimized the number of switching centers (known as “central offices” or COs) by
deploying longer wires (also known as “copper loops”) carefully tuned for telephony. In
fact, the United States appears to have had the longest average telephone loop length of any
OECD nation. (Figure 1)
4.5
4.0
3.5
3.0
2.5
2.0
1.5
1.0
0.5
0.0
13
Figure 1: Average Wired Telephone Network Loop Lengths in Selected OECD Countries (km)
Unfortunately, longer loops mean lower speeds for Digital Subscriber Line (DSL), the
technology that provides broadband over telephone wires. Just as high population density
means lower effective speed for cable because of increased sharing, DSL performance is
directly related to wire lengths. The long loop (telephone line) lengths in the United States
meant lower speeds than other nations with shorter loops. But both DSL and cable were
capable of delivering speeds 25-50 times faster than dial-up at the turn of the century, well
in excess of consumer demand.
THE INFORMATION TECHNOLOG Y & INNOVATION FOUNDATION | FEBRU ARY 2013 PAGE 11The presence of two systems of wiring enabled the United States to develop intermodal,
facilities-based competition that in turn enabled the ultimate deployment of additional
facilities—such as full fiber networks and high-capacity wireless—when and where they
were required. Both cable and telephone required significant and ongoing investment to
reach their current performance: cable had to connect to the Internet, reduce its degree of
sharing, and become bi-directional; telephone had to reduce the length of its loops (by
installing fiber deeper into the neighborhood), develop sophisticated electronics to permit
high bandwidth operation, and make its own Internet connections. With tens of millions
of potential broadband subscribers to compete for, both had incentives to invest. The
competition largely played out in the electronics that enable the wires to transmit and
receive bits, but also in improving the condition of the wires themselves and in stringing
new optical cable where needed.
Other nations were less ready for broadband, especially those that lacked a cable alternative.
Some of the nations with limited cable deployment (such as Germany) adopted flawed
regulatory frameworks that allowed incumbent telcos to own cable companies, which in
turn led to limited cable modem deployment. In such nations, the absence of competition
at the level of infrastructure led to an early emphasis on deploying DSL over their shorter
copper loops, and on simulating competition between Internet Service Providers (ISPs)
using the incumbent provider’s telephone wire. This scenario simply mimicked the thin
competition on price rather than speed that characterized Internet service in the dial-up
days. The extension of this inter-modal vision of competition also betrayed a lack of
imagination on the part of some regulators.
Because telephone networks provide unique wires from the phone company CO all the
way to the home or office, it was relatively straightforward to allow the connection of an
arbitrary number of ISPs in each CO, through devices known as Digital Subscriber Line
Access Multiplexers (DSLAMs). If a customer changed ISPs, the phone company would
simply move the user’s wires from one DSLAM to another. This level of competition is not
possible on the cable television system, as most of cable’s wires are shared. Hence, the
United States initially applied entirely different policy models to DSL and cable, and yet
another policy model to wireless. We were driven to the intermodal model in part by the
accident of history that gave us such different facilities at our broadband starting point.
There is another aspect of broadband evolution and relative ranking that is important to
understand. Broadband deployment began with the addition of specialized electronics to
existing telephone and cable networks. The nations that were quick to deploy were those
with relatively large populations of computer-savvy users who were already using dial-up
modems to access bulletin board systems, information services such as CompuServe, and
the Internet. In these nations, adoption followed fairly soon after deployment for those
already accustomed to the Internet. The United States was an early leader in broadband
deployment and adoption for three reasons: we created the Internet; we were the early
leader in personal computers, information services, cable television, and broadband
technology development; and we were beneficiaries of a telephone services market in which
unlimited, flat-rate pricing was the norm when the rest of the world had to pay a per-
THE INFORMATION TECHNOLOG Y & INNOVATION FOUNDATION | FEBRU ARY 2013 PAGE 12minute charge to be online. But broadband development has advanced several stages past
the starting point.
At any given time, the cost and performance of any broadband network is primarily a
function of the generation of technology that was current when the network was last
upgraded, and the distance the cable/wire plant has to cover. If we compare DSL networks
in Nation A and Nation B, the one that was last upgraded will generally run faster,
assuming average loop (wire) length is equal. If we compare two nations using the same
generation of technology, the one with the shorter average loop length will generally clock
in with higher speeds because signals degrade with distance.
The broadband technology portfolio (DSL, cable modem, fiber and wireless) is the same
throughout the world, and copper loop lengths can be shortened (albeit at considerable
cost) by deploying fiber deeper into the network. Hence, there’s no inherent reason to
suppose that any nation has a permanent position at the top or the bottom of the
broadband technology curve.
Network service providers often sit out generations of technology that are small upgrades to
the current standard, but such firms are typically quick to jump into the following
generation. Comcast, for example, did not replace its DOCSIS 1.1 cable modem
technology with DOCSIS 2, but it was the first to deploy DOCSIS 3. In this case,
generation 2 offered a 10 percent improvement over generation 1, but generation 3 was a
400 percent improvement. While DOCSIS 2 networks were marginally faster than
DOCSIS 1.1 networks, the difference was not substantial enough to represent a
meaningful difference in utility, innovation, or productivity.
Similar logic stimulated the operators of CDMA wireless networks to be among the first to
deploy LTE and gain a 1,000 percent improvement over 2G data rates. Consequently, it
can be misleading to place much stock in instantaneous measurements of current
conditions when upgrades are constantly underway and major ones may be just around the
corner.
To understand the differences in international broadband performance, therefore, it is not
enough to look at only one number at one point in time. Rather, multiple factors
determine national broadband performance. The most important metrics are:
1. Deployment: How far does the physical network actually reach? This is best
measured according to the postal addresses in a region. Full broadband
deployment would mean that it’s possible for a user to obtain broadband service
from at least one service provider at each dwelling and workplace with a postal
address in the nation. Secondary characteristics concern the generation of
technology and the cable/wire miles involved.
2. Adoption: How widespread is broadband utilization? This is best measured by the
share of offices and households with at least one broadband subscription,
correcting for those that aren’t able to use broadband because they don’t own a
computer and presumably have no interest in going online.
THE INFORMATION TECHNOLOG Y & INNOVATION FOUNDATION | FEBRU ARY 2013 PAGE 133. Performance: This is measured by the bits per second capacity of each grade of
network service, and refined by secondary characteristics such as latency and
packet loss when possible. In most cases, the only available data represent capacity
(e.g., speed), and latency is estimated by assuming that terrestrial technologies such
as copper wire and cellular radio have no latency while satellite technologies have
high latency.
4. Price: This is measured by examining the monthly charge for the service adjusted
for quality. In the United States, this figure has tended to be a flat rate dependent
on speed but independent of the amount of usage for wired connections, and a
variable rate dependent on volume for wireless ones. In many parts of the world,
all rates have historically been volume-dependent. Some studies instead focus on
price per-megabit/speed. But this is a misleading measure of performance because
cost does not scale arithmetically to speed (e.g., a 100 Mbps network does not cost
twice as much to build or operate as a 50 Mbps network), and therefore nations
with faster speeds will appear to have significantly better prices per bit—even if
their overall prices are higher than those in nations with lower speeds, and even if
users not able to utilize the capacity they purchase.
The most important sources of data for these metrics are the following:
In the United States:
1. The National Broadband Map (NBM) created by the National
Telecommunications and Information Administration (NTIA) with help from the
FCC for deployment, adoption, and price. 14
2. The FCC’s “2012 Measuring Broadband America” report, produced in
conjunction with SamKnows, for measurements of speed. 15
Internationally:
1. The Organisation for Economic Co-operation and Development collects data on
deployment, adoption, speed, and price from its 34 member nations. 16 OECD
data are widely used, but require a great deal of interpretation since their collection
method (national self-reporting) and the way they analyze some of the data are
questionable. OECD doesn’t measure actual speeds, for example, and tries to
simply infer it from rate plan advertised speeds.
2. Akamai’s “State of the Internet Report” covers most of the United Nations’ 193
member states as well as certain administrative regions that aren’t actual nations,
such as Hong Kong. 17 These reports, primarily focused on the growth of the
Internet, emphasize the number of connected devices, attacks, and typical speeds
between Akamai servers and global users. With some interpretation they provide
valuable insights regarding broadband performance.
3. “Net Index” by Ookla provides the results of self-initiated speed tests performed
by users around the world using the test system that runs “speedtest.net.” 18 Ookla
is much less precise than SamKnows because it can’t distinguish machine speed
from network speed and the sample is likely to be biased toward those
THE INFORMATION TECHNOLOG Y & INNOVATION FOUNDATION | FEBRU ARY 2013 PAGE 14experiencing problems, but the system has the virtue of being open and
international.
4. TeleGeography collects statistics on several aspects of broadband deployment and
use.
BOX 1: BROADBAND DEFINITION AND MAJOR BROADBAND
TECHNOLOGIES
Broadband is a term applied to transmission media with bandwidths that can
carry multiple signals by dividing the total capacity of the medium into
multiple, independent channels. The standard wireline broadband technologies
in most areas are digital subscriber line (DSL) technologies and cable modems.
Depending on the medium and the transmission method, bandwidth is
measured in thousands of bits (kilobits) per second (Kbps); millions of bits or
megabits per second (Mbps); or billions of bits (or gigabits) per second (Gbps).
The OECD, which provides the most widely cited international rankings of
broadband adoption, has defined broadband as a service that enables users to
upload or download data or both at a speed of 256 Kbps—and this rate is the
most common baseline that is marketed as “broadband” around the world.
Until recently, the U.S. Federal Communications Commission (FCC) defined
broadband as a service that enables users to upload or download data at
speeds of 200 Kbps; it has recently upgraded its definition of broadband to 4
Mbps download speed or better.
DSL Technologies
DSL technologies transform telephone lines into high-speed digital lines by
using the higher frequency range to deliver data while leaving the lower
frequencies for analog voice. The term “xDSL” refers to all types of DSL
technologies. The main categories of DSL for home subscribers are Asymmetric
DSL (ADSL) and Very High Speed DSL (VDSL), and the next generation is
Vectored DSL, supporting speeds up to 100 Mbps.
Cable Modems
Cable modems allow users to have a broadband connection that operates over
cable TV lines. Cable Internet works by using reallocated TV channel space for
data transmission, with certain channels used for downstream transmission,
and other channels for upstream transmission. Because the coaxial used by
cable TV provides much greater bandwidth than telephone lines, a cable
modem can be used to achieve extremely fast access to the Internet. Cable
modems support speeds up to 160 Mbps with DOCSIS 3.0, and even higher
speeds with the new standard, DOCSIS 3.1 (320 Mbps and higher). The cable
network as a whole has a capacity of approximately 4 Gbps, but most is
dedicated to traditional TV today.
Wireless
Present day 4G/LTE networks support transmission speeds up to 40 Mbps over
short distances, and 5 to 10 in more common circumstances. 3G cellular
broadband runs at speeds comparable to entry-level DSL and cable modem
broadband plans, ranging from 1 to 2.5 Mbps. Some ISPs, known as WISPs,
provide Internet service over outdoor Wi-Fi, and satellite-based broadband
services are available to practically all American homes—albeit at speeds and
for prices that are not necessarily competitive with alternatives.
THE INFORMATION TECHNOLOG Y & INNOVATION FOUNDATION | FEBRU ARY 2013 PAGE 15WHERE DOES U.S. BROADBAND ACTUALLY RANK INTERNATIONALLY?
Deployment
Perhaps the single most widely confused aspect of international broadband comparisons is
between deployment and adoption. This is in part because of the proliferation of confusing
terms. The OECD, for example, uses terms such as “penetration,” “subscription,” “access,”
and “coverage” sometimes to mean “adoption” and sometimes to mean “deployment,”
without actually using either of those latter terms. It is therefore not surprising that many
assume “adoption” is the same as “deployment.” It is indeed common for press articles
about U.S. broadband to criticize broadband deployment when in fact the data they utilize
measures adoption.
We use “deployment” to measure the reach and extent of broadband networks; this
concept is similar to “coverage” for cellular networks. We use “adoption” to measure the
number of people who actually pay the money to subscribe to broadband services; this is
similar to “subscriptions” for a newspaper.
The best study of broadband deployment in the United States is the National Broadband
Map (NBM) 19 created by NTIA with help from the FCC. The NBM was most recently
updated in January, 2013. 20 The OECD reports deployment data, but they are less recent.
Homes passed
The NBM shows that more than 99.9 percent of Americans have access to some form of
broadband with download speed in excess of 3 Mbps, either by satellite, terrestrial wireless,
or wired technology. Of this number, 96.3 percent have access to some form of wired
broadband, 84.3 percent have access to cable modem service, 82.2 percent have access to
DSL (over telephone wires), and 17.8 percent have access to fiber. The NBM also shows
that 82.3 percent have access to some form of wireless with an advertised speed of 3 Mbps
or higher, including 34.1 percent with access to fixed terrestrial service (such as Clearwire,)
30.1 percent with access to unlicensed wireless service, and 76.1 percent with access to
mobile broadband at the requisite speed.
The OECD’s U.S. data (which come from the FCC) are older, much less detailed, and
more lenient with respect to the definition of “broadband,” accepting services with
download speeds of 256 Kbps or above. As a result, the OECD reports that 96 percent of
Americans have access to cable modem broadband service, 85 percent have access to DSL,
and 92.3 percent have access to 3G wireless. The OECD figures are sufficiently out-of-date
that they under-count fiber, reporting that only 13 percent have access to an all-fiber
service (the latest actual number is 17.8 percent). 21 OECD does not distinguish available
technologies or speeds beyond basic distinctions between cable, DSL, and mobile; it has no
figures on DOCSIS 2 versus DOCSIS 3 or for LTE, for example.
The collection of statistics on deployment is a new wrinkle for OECD, which uses the term
“coverage” rather than “deployment” to describe them. These new coverage data allow us
to see the picture of how widely deployed broadband networks are, as well as the state of
intermodal competition internationally. While the United States ranked 31st in terms of
THE INFORMATION TECHNOLOG Y & INNOVATION FOUNDATION | FEBRU ARY 2013 PAGE 16the extent of DSL deployment in 2008, it ranked first in terms of cable modem
deployment (in 2009), with 96 percent coverage. (Figure 2)
With regard to other nations, the United States is among the leaders in intermodal
competition. The clearest way to see this is to compare the concurrent deployment of cable
and DSL in OECD nations. Doing this shows that the United States is third in the OECD
with concurrent facilities reaching 85 percent of the population; only the Netherlands and
Belgium are ahead, at 92 and 88 percent respectively. This is not an inconsiderable
achievement given that the United States has the second-least densely populated urban area
of any OECD nation (See price section below). The high level of coverage by both DSL
and cable allows the United States to benefit from an intermodal competition policy, an
option that is not available to most nations because they lack significant cable modem
coverage.
In fact, only nine OECD member nations score higher than a combined 60 percent on
cable/DSL coverage. One reason for this is that telecommunications incumbents in many
United States is third in European nations were allowed to own cable networks. They had little motivation to roll
out cable modem services that would compete with their own broadband offerings over
the OECD with DSL. 22 For example, France Télécom dominated the French cable market via its cable
concurrent facilities subsidiary France Télécom Cable until it divested in 2005, and held additional investments
reaching 85 percent of in other large cable companies, such as a 28 percent share of Noos until a 2004 divestiture.
the population; only the Similarly, in Sweden, TeliaSonera controlled cable networks through its Com Hem
subsidiary, which it only divested in 2003. In Germany, Deutsche Telekom owned the
Netherlands and Belgium
cable network until 2000. Moreover, regulation meant that local delivery of cable services,
are ahead, at 92 and 88 provided through third parties, was fragmented. So even though more than 70 percent of
percent respectively. This German households have access to the cable TV network, fragmentation in the cable
is not an inconsiderable market limited early uptake of cable broadband services. 23
achievement given that
Many nations—usually those with little intermodal competition between
the United States has the telecommunications providers offering broadband via DSL and cable providers offering
second-least densely broadband services via cable—focused on promoting “intramodal” broadband competition,
populated urban area of often via local loop “unbundling.” This is a regulatory requirement that incumbent
any OECD nation. telecommunications operators that own the local loops (the physical wire connection
between the customer and company) had to give their competitors access to the loops at
prices set by the regulator. Compared to the expense of installing multiple wiring systems
afresh, unbundling was seen as a shortcut to competition.
THE INFORMATION TECHNOLOG Y & INNOVATION FOUNDATION | FEBRU ARY 2013 PAGE 17100%
90%
80%
70%
60%
The United States 50%
40% Cable deployment
jumped from twelfth
30% DSL deployment
place to seventh in the 20%
relative number of high- Both
10%
speed broadband 0%
connections between the
third quarters of 2009
and 2012.
24
Figure 2: Intermodal Broadband Deployment by Nation
Deployment Trends
One useful way to judge the success and failure of national policies in deployment terms
would be to examine the trend lines that follow after the various international starting
points—but these data have not been collected, let alone analyzed. 25 What we have instead
is anecdotal information about the technologies that were installed in various nations at
different times, and some information about major upgrades.
80%
70%
60%
50%
40%
30%
20%
10%
0%
Q3 2009 Q3 2010 Q3 2011 Q3 2012
Figure 3: United States “High Broadband” as Percentage of all Broadband (shadow corrects for
26
adjustment of baseline from 5 Mbps to 10 Mbps in 2012)
In addition, Akamai has collected data from 180 nations and regions since 2008 on average
connection speeds, as well as on “High Broadband Adoption,” showing the portion of
connections to Akamai at speeds above 10 Mbps. This metric can be considered a proxy
for the portion of the total broadband user population that subscribe to high-speed services
as opposed to average speed services. 27 “High Broadband Adoption” rankings serve as a
very rough proxy for the pace of upgrades to national broadband networks.
THE INFORMATION TECHNOLOG Y & INNOVATION FOUNDATION | FEBRU ARY 2013 PAGE 18The United States jumped from twelfth place to seventh in the relative number of high-
speed broadband connections between the third quarters of 2009 and 2012 respectively,
and sixth among OECD members. During this time, the percentage of connections in the
high speed category doubled from 24 percent in 2009 to 48 percent in 2011. (Figure 3)
Akamai raised the baseline for high-speed connections in 2012, which accounts for an
apparent reduction to 18 percent from the previous year.
Seventh place isn’t first place, but the deployment and use of high-speed broadband
connections in the United States is clearly improving. This data on the relative number of
users with high-speed connections contradicts claims made by critic David Cay Johnston,
who titled the broadband chapter in his book “In Twenty-Ninth Place and Fading Fast,” 28
and by Susan Crawford, who insists that “America has slipped over the past decade to 22nd
place” in download speed. 29 Crawford also insists that other nations have moved far ahead
of the United States in the deployment of radically more advanced broadband networks:
Meanwhile, the service that all Americans would need within five years (truly high-
speed Internet access ranging from 100 Mbps, or megabits per second, to gigabit
speeds over fiber-optic lines), the service that would allow symmetrical (same-
speed) uploads and downloads and extensive use of online streaming video for a
host of educational, medical, and economic purposes, was routinely available in
other countries but could not be purchased at all in most parts of the United
States. 30
First, there is absolutely no evidence to support the claim that 100 Mbps symmetrical
service is “routinely available” in any part of the world, except as a commercial grade service
(as it is in the United States as well). The source that Crawford cites in support of this
claim, the “Next Generation Connectivity” report by the Berkman Center, failed to
identify a single offering with upload speeds in excess of 20 Mbps; in fact the report
actually ranks the United States fifth in median upload speed. 31 Moreover, virtually all
current applications perform well on average speed networks and certainly don’t require or
perform better on gigabit networks.
Other metrics on broadband speed will be discussed in the section on performance
following.
Number of Providers
Some critics of American broadband policy charge that consumers are in the grip of a
dangerous duopoly, or even worse, an abusive monopoly. Susan Crawford says, for
example, that wireless and wired broadband networks in all of their forms are “monopolies”
(an inherent contradiction, since “monopoly” means control of a market by a single
provider).
These days what that basic transmission service is facilitating is high-speed access
to the Internet. In that market, there are two enormous monopoly submarkets—
one for wireless and one for wired transmission. Both are dominated by two or
three large companies. 32
THE INFORMATION TECHNOLOG Y & INNOVATION FOUNDATION | FEBRU ARY 2013 PAGE 19David Cay Johnston insists that telephone service is a national duopoly:
Through one technology or another, the AT&T–Verizon duopoly controls more
than 60 percent of the telephone business in America. 33
And the New America Foundation echoes Crawford’s “looming cable monopoly” claim:
In the future, consumers wishing to subscribe to higher speed Internet services will
likely face a near-monopoly from cable providers, as telephone providers have
halted wide scale upgrades of their networks. 34
In the face of these assertions, the National Broadband Map paints a very different and
factual picture regarding consumer choice. The NBM says:
89 percent Americans have a choice of five or more broadband providers,
including wireless and satellite. (Figure 4)
85 percent of Americans have a choice of two or more wireline broadband
providers. Nearly half of Americans, 43.6 percent, have access to three or more
wireline providers.
86.7 percent of Americans have a choice of four or more wireless broadband
providers.
More than half of Americans, 57.9 percent, have access to five or more wireless
broadband providers. 35
Critics may argue that DSL is a poor substitute for cable and that wireless is no substitute
at all; arguments of this sort are necessary if one wishes to make the case for regulating
broadband as if it were a monopoly. But such arguments are blind to the nature of
technological progress, as we discuss later; consumers experience speeds and prices directly,
but not technologies (at least for non-nomadic uses).
120%
100%
80%
60%
40%
20%
0%
No One or Two or Three or Four or Five or Six or more Seven or Eight or
providers more more more more more providers more more
providers providers providers providers providers providers providers
Any type Wireless Wireline
36
Figure 4: United States Broadband Provider Choice
THE INFORMATION TECHNOLOG Y & INNOVATION FOUNDATION | FEBRU ARY 2013 PAGE 20Extremely High Speed Providers
Contemporary technology options generally provide a level of performance that’s at least
adequate for most contemporary applications. According to NCTA, more than 82 percent
of America’s cable homes have access to DOCSIS 3, a technology that runs at a native
speed (e.g., the speed at which the network operates internally) of 160 Mbps, and can
provide 100 Mbps service where the distribution network is adequate to bear the load.
Some 136 providers make 100 Mbps service available in America today, and 322 providers
offer services at 25 Mbps or more. 37 To put these speeds into context, it may be useful to
bear in mind that the average rate of Netflix video streaming over Google’s gigabit Kansas
City network is 2.55 Mbps, because of slower speeds in other parts of the Internet. 38
The throughput that Netflix achieves over the Google network is within the range of the
connections currently employed by more than 80 million of America’s 206 million total
broadband connections—those who connect at 3 Mbps or faster. More demanding
applications may appear as faster connections become more common, but they aren’t here
yet, either in the U.S. or anywhere else.
The most common extremely high speed broadband services at the time of the NBM’s
latest data collection were fiber to the home and DOCSIS 3. NBM reports that 39.4
percent of households had access to DOCSIS 3 at speeds of 100 Mbps or more, and 5.4
percent had a fiber option faster than 100 Mbps (some DOCSIS 3 services are capped at
50 Mbps because of backhaul limitations). These figures most likely understate the
availability of extremely high speed service, as both Verizon FiOS and DOCSIS 3 operate
at native speeds in excess of 150 Mbps. The internal speed is not always offered to the
public, however, as networks need reserve capacity to account for sharing.
Judging by native speeds, the 82 percent of homes with access to DOCSIS 3 and the 17.8
percent with access to an all-fiber option are potentially capable of enjoying access to a
service with download speeds in excess of 100 Mbps now or in the near future. The broad
deployment of such high-speed networks in the United States is the source of great concern
for Europe, where the European Commission is developing a “Ten-Step Plan” for cross-
border, intermodal competition in order to catch up with the United States and the East
Asian nations and escape from their DSL cul-de-sac. 39
The United States has a large number of very high speed and extremely high speed
broadband providers: 235 offer services at 50 Mbps or more, 136 offer 100 Mbps or more,
and 64 offer gigabit speeds. (Figure 5) Most of the 100 Mbps and gigabit providers focus
on the business market, of course.
THE INFORMATION TECHNOLOG Y & INNOVATION FOUNDATION | FEBRU ARY 2013 PAGE 212000
1500
1000
500
0
≥ 786 ≥ 1.5 ≥3 ≥6 ≥ 10 ≥ 25 ≥ 50 ≥ 100 ≥1
kbps mbps mbps mbps mbps mbps mbps mbps gbps
40
Figure 5: U.S. Broadband Providers by Speed
Fiber Deployment
Some critics of U.S. broadband performance argue that the only “true” broadband is fiber
to the home. They minimize the role played by fiber optics as the backhaul and aggregation
Some 19 million miles of component of residential, commercial, and wireless networks. These critics bemoan a
fiber were installed in the supposed lack of fiber in the United States, when in fact there are more actual route miles
of fiber in the United States than in all of Europe combined. We’re still adding fiber at a
United States in 2011,
faster rate than Europe, as we explain later. 41 The construction of full fiber networks is
more than in the entirety probably inevitable in the long run because fiber is more robust and sustainable than
of Europe. copper, independent of the higher bandwidth it offers. But it’s also labor intensive to install
fiber, so the general path to the ultimate replacement of the copper infrastructure we
inherited from the telephone and cable TV networks at the dawn of the broadband era is to
grow the fiber infrastructure from the inner portions of the broadband network, the so-
called “core,” to the outer portion, known as the “edge.” The backbones that comprise the
Internet core and the middle, distribution portions of the broadband networks that serve
users (between the core and the edge) are already comprised of fiber; broadband networks
are hybrids of fiber, twisted pair copper, coaxial copper, and wireless. In fact there are more
actual route miles of fiber in place in this country than there are in any other country in the
world, in part because the United States is so large but also because we’ve invested more
heavily in fiber than comparable regions such as the European Union have. 42
One important way to judge the progress of the fiber build is to measure the installation
rate of fiber throughout the entire network infrastructure. Carriers in the United States
over-installed fiber during the Internet bubble of the late 1990s. Until 2011, the greatest
annual build of American fiber had occurred in 2000. 43 The over-supply of fiber left over
from the collapse of the Internet bubble meant that there was very little reason to install
additional fiber for core and middle networks until the inventory was exhausted. This
occurred by 2010, and by 2011 large-scale fiber installation began again. According to the
CRU Group, 19 million miles of fiber were installed in the United States in 2011, more
than in the entirety of Europe. 44 Leading manufacturers of optical fiber have placed
customers on allocation:
THE INFORMATION TECHNOLOG Y & INNOVATION FOUNDATION | FEBRU ARY 2013 PAGE 22You can also read


