Environmental Change and Septic Systems in Nags Head: Local Perspectives and Impacts on Water Quality and Quantity University of North Carolina at ...
←
→
Page content transcription
If your browser does not render page correctly, please read the page content below
Environmental Change and Septic Systems in Nags Head:
Local Perspectives and Impacts on Water Quality and Quantity

         University of North Carolina at Chapel Hill
               Institute for the Environment
                   Outer Banks Field Site
                          Fall 2018
                      Capstone Report

                    December 13, 2018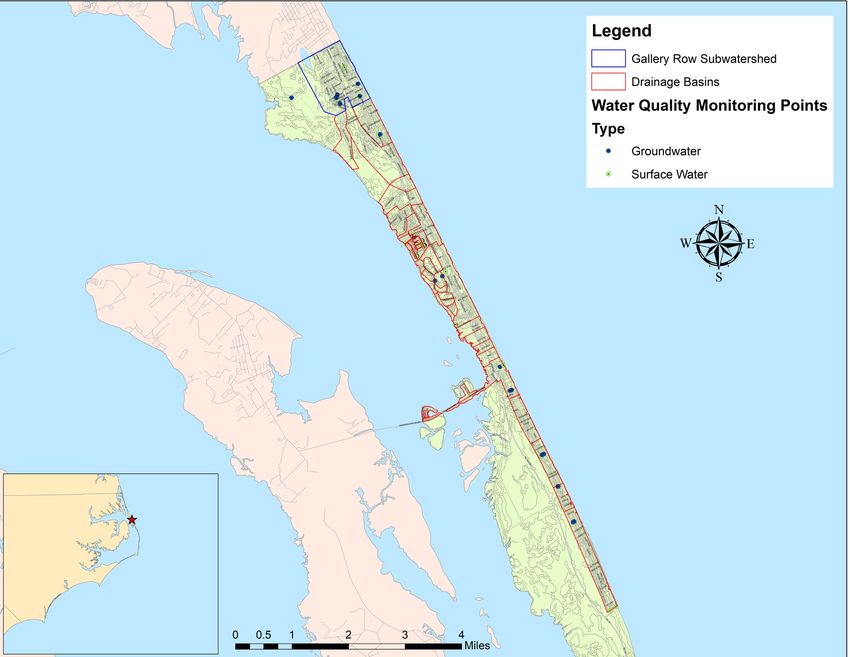
Authors

Jennifer Allen                                     Elizabeth Kendrick
Junior                                             Junior
B.A. Environmental Studies and Geography           B.A. Environmental Studies and Public Policy
Shelby, North Carolina                             Atlanta, Georgia

Katherine Bell                                     Marium Konsouh
Senior                                             Junior
B.A. Environmental Studies                         B.S. Environmental Science
Clemmons, North Carolina                           Charlotte, North Carolina

Danesha Byron                                      Harris Kopp
Senior                                             Senior
B.S. Environmental Science                         B.A. Environmental Studies
Fayetteville, North Carolina                       Dallas, Texas

Conor Howachyn                                     Autumn Pollard
Senior                                             Junior
B.S. Environmental Science                         B.S. Environmental Science
Baldwin, Maryland                                  Winterville, North Carolina

Kendall Kane                                       Emma Szczesiul
Junior                                             Senior
B.S. Environmental Science and Global Studies      B.A. Environmental Studies
Winston Salem, North Carolina                      Smithfield, North Carolina

Emma Karlok                                        Lynn Tran
Senior                                             Senior
B.A. Environmental Studies                         B.A. Environmental Studies
Jamestown, North Carolina                          Durham, North Carolina

Alex Kellogg
Senior
B.A. Environmental Studies and Anthropology
Orlando, Florida

2
Acknowledgments

Special thanks to the faculty and staff of the Outer Banks Field Site (OBXFS):
Andy Keeler, Linda D’Anna, Lindsay Dubbs, Corey Adams

The Community Advisory Board: Christin Brown, Nellie Dixon, Fay Davis Edwards, Erin
Fleckenstein, Kate Murray Jones, Jaye Massecar, Aaron McCall, Rhana Paris, Matt Price, Kipp
Tabb, Hadley Twidd, Heidi Wadman

Our internship mentors:
Jennifer Karpowicz Bland – Dare County District Attorney’s Office
Karen Clark – Outer Banks Center for Wildlife Education and Wildlife Resources Commission
Herbert Council – Can Stand OBX L.L.C.
Ann Daisey – Dare County Soil and Water Department
Warren Eadus – Quible and Associates P.C.
Sara Hallas – NC Coastal Federation
Kate Jones – NC Coastal Reserve and Estuarine Research Reserve
Aaron McCall – The Nature Conservancy
Mellissa Dickerson – The Town of Manteo
Jessica Taylor – OBX Center for Dolphin Research
Sam Walker – OBX Voice and Jam Media Solutions
Holly White – The Town of Nags Head

Community members, guest speakers and businesses who contributed to our
experience: Robbie Fearn (Audubon Pine Island Sanctuary); Kim Armstrong, Reide Corbett,
Jeff Gottermeyer, Haley Grabner, Mike Hosey, Jeff Lewis, Marie Magee, Robert McClendon,
John McCord, Mark Stancill, and Dave Sybert (Coastal Studies Institute); Meghan Agresto
(Currituck Lighthouse); Ryan Bower (Dare County Water Department, Kill Devil Hills
Desalination Plant); Alex Manda (East Carolina University); Lora Harris (Chesapeake Biological
Laboratory, University of Maryland); Baxter Miller and Ryan Stancil (Stancil Miller & Co.);
Bryan Giemza (Southern Historical Collection, University of North Carolina); Ken Partlow and
Rick Probst (Jennette's Pier); );Lindsay Usher (Old Dominion University); Justin Barnes
(Jockey's Ridge State Park); Melinda Lambert, Adam Simon, and T. D. VanMiddlesworth
(North Carolina Division of Marine Fisheries); Sara Mirabilio (North Carolina Sea Grant);
O’Neal’s Sea Harvest (Wanchese, NC); the North Carolina Aquarium on Roanoke Island;
Sharon Meade (Outer Banks Center for Wildlife Education); Roy Porter and Envirochem
(Wilmington, NC); Todd Krafft, Andy Garmin, Cliff Ogburn, David Ryan, and Holly White
(Town of Nags Head); Violet Anderson, Myra Burke, Jaye Cable, Chrissie Greenberg, Evelyn
Johann, Cory Keeler, Jason Kinnear, Jing Lui, Dawn Morgan, Mike Piehler, Rusty Rogers,
Suzanne Rucker, and Charu Vengavayal (University of North Carolina at Chapel Hill); Kenny
Midgett (Wanchese Trawl and Supply Company); George Wood and Environmental
Professionals Inc. (Kill Devil Hills, NC)

Thank you to all the community members and participants that volunteered their time and
thoughts to our capstone project!

3
Abbreviations

CAB: Community Advisory Board
Count: number of samples
CSI: Coastal Studies Institute
DEM: Digital Elevation Model
DST: Defined Substrate Technology
DTGW: Depth to Groundwater
E. Coli: Escherichia coli
GCMS: Gas Chromatograph Mass Spectrometer
GW: Groundwater
HDPE: High Density Polyethylene
HPLCMS: High Performance Liquid Chromatograph Mass Spectrometer
Min: minimum
Max: maximum
MPN: Most Probable Number
NC: North Carolina
NH: Nags Head
NHFS: Nags Head Fire Station
NTU: Nephelometric Turbidity Unit
OBXFS: Outer Banks Field Site
OF: Outfall
OWTS: Onsite Wastewater Treatment System
PPCP: Pharmaceuticals and Personal Care Products
StdDev: Standard Deviation;
SW: Surface water
YSI: Yellow Stone Instrument

4
Abstract
The Outer Banks is a chain of barrier islands off the coast of North Carolina that
separates the Atlantic Ocean from the mainland. The islands are surrounded by water and have a
unique hydrology due to the interconnection of groundwater aquifers, sound, and ocean. Forces
driven by global climate change - particularly sea-level rise - coupled with human development
have resulted in increased flooding and deteriorating surface-water quality. Approximately 80%
of the town of Nags Head uses septic tanks to treat its wastewater with septic systems, and septic
systems that are poorly maintained or fail can leach nutrients and bacteria into groundwater
reservoirs that ends up in the Sound and Ocean. The threat of degradation of water quality,
particularly due to septic leachate, will have ecological and anthropogenic effects on the Town of
Nags Head, its residents, and its visitors. To contribute to the understanding of local perspectives
and impacts of environmental changes and septic system in Nags Head, quantitative and
qualitative natural and social science approaches were employed to investigate the likelihood of
septic leachate in water reservoirs and local perspectives of water quality and quantity.
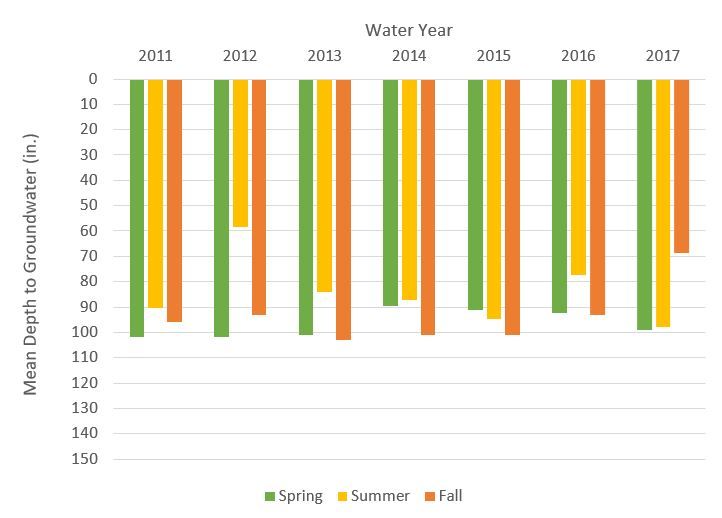
Change in water level over different time scales and across the landscape was
investigated by analyzing historical data on depth to groundwater data collected by the Town
from 2011 to 2017. Water level in each water year changed relative to the seven-year median
water level with precipitation across all sampling locations. We did not see an increase in water
level in the summer, corresponding to increasing water use mediated fluxes of water from the
confined drinking water aquifer to the groundwater aquifer, as expected. We also determined that
the water level exceeded the depth that would keep it sufficiently separated from the depth of
septic drainfields to allow for the recommended amount of percolation through unsaturated soils
and natural treatment for contaminant removal on 49% of sampling occasions. The overall trend
in the data is that water level has increased over time, and although our dataset is shorter than
that required to attribute the increase in water level to sea level rise, we expect sea level rise will
continue to increase the water level of this coastal town, further shrinking the separation between
groundwater and septic drainfields, thereby posing increasing risks to water quality.
Using previously compiled data as a foundation, our analysis of historical data from the
area was compared with water samples taken from three surface-water drainage ditches, two
groundwater wells, and one ocean outfall pipe. To determine if there was significant interaction
between groundwater and surface-water reservoirs and septic leachate, the samples were tested
for nutrients, bacteria and the presence of caffeine. In general – but with a high degree of
variability – the data suggest that storm events lead to increased interactions between septic
system leachate and surface-water reservoirs, resulting in noticeable increases in nutrients like
ammonia, nitrate/nitrite nitrogen, as well as E. coli and Enterococcus cell counts. The presence
of significant levels of caffeine at one of our surface-water sampling sites points to interactions
with septic system leachate, but at other sites only trace levels of caffeine were found. The high
variability in the data means that the level of surface-water contamination was spatially
inconsistent and that the higher levels of contamination at certain sampling sites were likely due
to some point-source pollution like animal waste or nearby leaking systems. The presence of
significant levels of caffeine at one of our surface-water sampling sites points to interactions with
septic
To understand how Nags Head residents' perspectives regarding changing environmental
conditions, water quantity, and water quality we conducted 27 semi-structured interviews with
property owners. We found that participants valued the waters of Nags Head for various reasons,
5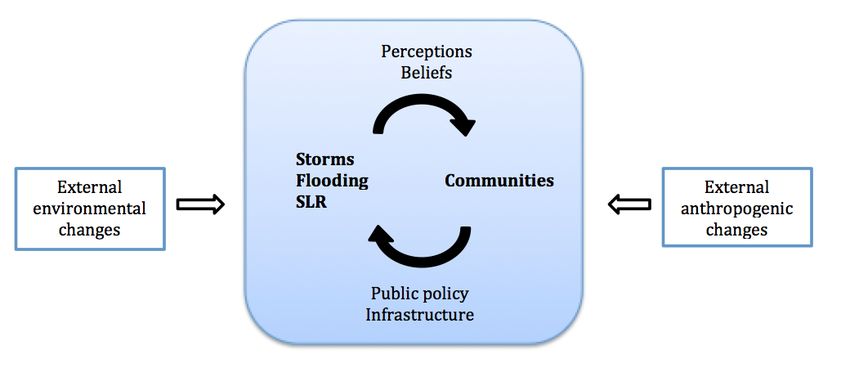
including aesthetics, recreation, community, and livelihood. These connections to water
positioned study participants to notice and report on a variety of environmental changes and
concerns. They postulated that exacerbated flooding, decreased water quality, and increased
pollution in water reservoirs were due to increased frequency and intensity of storms, more
intensive development, and the management of stormwater and wastewater. Further analysis
revealed concerns about a potential downward spiral wherein the economy of Nags Head was
reliant on tourism, tourism pushed for more development, development decreased water quality,
and poor water quality would impact economy and tourism. Analyses also disclosed that though
septic systems were preferred over central sewage, this opinion was largely due to financial and
logistical concerns. Overall, we noted several knowledge gaps among participants regarding
water quality and wastewater treatment. There existed no central information source, which
inhibited their ability to take individual responsibility for septic tank maintenance. Additional
efforts by the town of Nags Head to fill these gaps seem warranted. of

6
Table of Contents

Authors.............................................................................................................................................2
Acknowledgements..........................................................................................................................3
Abbreviations...................................................................................................................................4
Abstract............................................................................................................................................5
Introduction......................................................................................................................................8
Methods..........................................................................................................................................19
       Study Site...........................................................................................................................19
       Human Dimensions............................................................................................................20
       Historical Data...................................................................................................................21
       Ecology..............................................................................................................................23
Results and Discussion..................................................................................................................27
       Human Dimensions............................................................................................................27
                   Attachment to Place and Water..............................................................................27
                   Evidence and Drivers of Water Quality and Quantity...........................................31
                   Perceptions of Septic Risk and Barriers to Change...............................................35
                   Responsibility........................................................................................................39
                   Conclusions and Implications................................................................................41
       Historical Water Level…...…………................................................................................41
                   Conclusions and Implications……...………………………………………...…..51
       Water quality field study ……….......................................................................................51
                   Nutrients.................................................................................................................52
                   Bacteria..................................................................................................................57
                   Caffeine..................................................................................................................63
                   Conclusions and Implications…………..………………………………………..64
                   Limitations.............................................................................................................65
Conclusions....................................................................................................................................68
References......................................................................................................................................70
Appendices.....................................................................................................................................74

7
Introduction
Coastal social, economic, and environmental systems are dynamic and are vulnerable to
threats posed by global-scale environmental changes, such as sea-level rise, flooding, and
increased storm prevalence (USGCRP, 2018). On both local and global scales, changing
environmental conditions will impact coastlines, with broad implications for coastal
communities in all parts of the world. Local environmental changes will be exacerbated by
increasing human populations and subsequent development. Coastal communities will face a
host of decisions about how to adapt to new and changing circumstances, including higher water
tables, saltwater intrusion, and enhanced erosion with concomitant inundation. These changes in
how water moves across coastal landscapes will likely affect the viability of human
infrastructure, such as roadways and wastewater treatment. In some cases, current wastewater
treatment practices may become so compromised that wastewater streams may regularly mingle
with the surface and groundwater, leading to human and environmental health concerns. Our
study investigated the effects of sea-level rise, flooding, development, and resultant changes to
water quantity and quality in the barrier island community of Nags Head, North Carolina (NC), a
coastal town located in Dare County, part of the Outer Banks region of NC.
The following section provides a preliminary overview of coastal hydrology in the Outer
Banks, detailing the relevant water reservoirs and fluxes. Then, we discuss the relationship
between hydrology and human populations along the coast, with particular emphasis on
increasing population size and development. Next, we elaborate on how water quality and
quantity are influenced by these environmental changes, focusing on those which affect
wastewater treatment in Nags Head specifically. Then, we summarize potential adaptations for
wastewater treatment to environmental changes and their consequences, highlighting innovations
put in place by the Town of Nags Head in light of water quality and quantity concerns. This is
followed by a discussion of coastal resident perceptions, behaviors, and adaptations in response
to environmental changes.
Coastal Hydrology
The Hydrological Cycle and the Outer Banks
To begin to address how changing environmental conditions affect water quantity and
quality in Nags Head, one must first understand how and where water is retained in different
reservoirs and how it moves across the landscape and between reservoirs under normal
conditions. Water is present in various global reservoirs including the atmosphere, on the surface
of land (as ice, snow, and surface-water such as lakes and rivers), in biota, below the surface of
land (as confined aquifers and unconfined groundwater aquifers), and in sounds and oceans.
These reservoirs and the fluxes between them, including evaporation, transpiration, precipitation,
and river flow, are referred to as the hydrological cycle (Figure 1; Chahine, 1992). Importantly,
liquid fluxes between surface-water, groundwater, and ocean reservoirs not only transport water,
but also a host of dissolved and suspended compounds and particles, including nutrients,
bacteria, and pollutants.
8Figure 1: Basic diagram of the hydrological cycle, depicting global reservoirs and the fluxes of
water that move liquid and gaseous forms of water between them (adapted from Chahine, 1992).
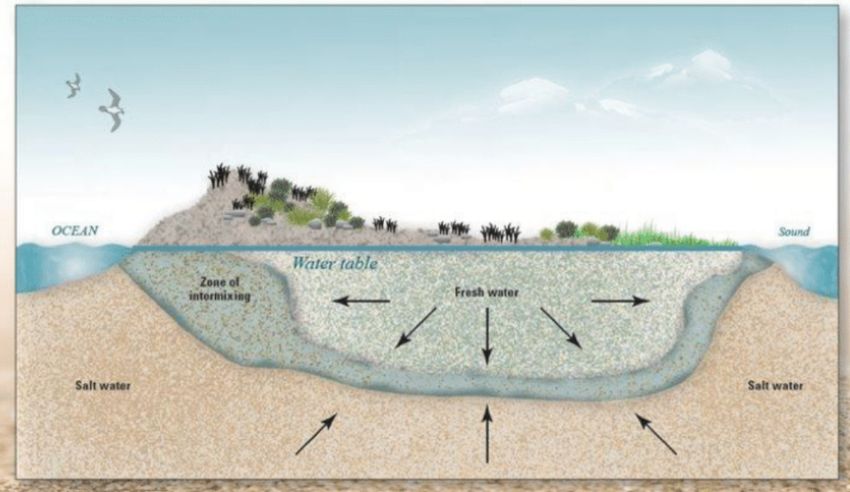
Outer Banks Hydrology: Reservoirs and Fluxes
The islands of the Outer Banks of North Carolina are surrounded by water and have
distinctive hydrological characteristics. The important water reservoirs for this area include the
Atlantic Ocean, the freshwater and brackish sounds of the Albemarle-Pamlico estuarine system,
groundwater located in the surficial unconfined aquifer below the water table, surface-water, and
the brackish confined Tertiary-age Yorktown aquifer, from which water is withdrawn for
household use in the northern Outer Banks (Flatt, 2014). The freshwater surficial unconfined
groundwater aquifer and surface-water are fed by local rainfall infiltration. These aquifers
connect to the ocean and sounds through horizontal and vertical percolation (Dolan, 2016).
Figure 2 illustrates this relationship by depicting a cross-section of the coastal landscape. The
sizes of the aquifers fluctuate due to anthropogenic and natural forces. For instance, greater
rainfall results in more water in the unconfined groundwater aquifer and surface-waters, while
pumping the groundwater aquifer to the sounds or ocean reduces the amount of water it contains
(Dolan, 2016).
Tides, waves, and storms are other critical components of Outer Banks hydrology. These
forces influence the shape and stability of coastal landscapes by shifting sediment and eroding or
nourishing a shoreline (Frankenberg, 1997), thereby shifting the relative bounds of the
groundwater aquifer and the ocean and/or sounds. Precipitation associated with storms may also
result in abundant stormwater runoff that either flows to the ocean and sounds (Dolan, 2016) or
accumulates in the unconfined groundwater aquifer, which, when saturated, causes flooding of
the relatively flat landscape. On the Outer Banks, a stormwater drainage system consisting of
open and closed drainage ditches and outfall pipes is meant to transport stormwater runoff
directly to the ocean and sounds quickly to reduce flooding. The lower elevation drainage ditches
often contain water between storm events, thereby creating an additional surface-water
reservoir.
9Figure 2: Water movement through a barrier island system (reproduced from Dolan, 2016).
The Socio-Hydrological Cycle
The fluxes between the hydrological reservoirs are further complicated by change and
human development. The physical, geological, and ecological dimensions of the hydrological
cycle on the Outer Banks are intimately connected to its social systems and external
environmental factors. We can refer to this interrelationship as a socio-hydrological cycle
(Figure 3; Baldassarre, 2017). Community responses to environmental changes like sea-level rise
and flooding are impacted by both individual and collective local perceptions and beliefs.
Resultant decisions and policies to address flooding or impacts of sea-level rise influence the
effects that future storms, flooding events, and sea-level rise have on the community and
individuals. A socio-hydrological approach incorporates ecological change and anthropogenic
development into our understanding of hydrology. This is critical in coastal systems where the
impacts of sea-level rise and increased storm events are complicated by coastal population
growth, increases in impervious surfaces, and greater wastewater production.
10Figure 3: The Socio-Hydrological Cycle: Both environmental and anthropogenic influences
affect the relationships between communities and environmental change relative to water
reservoirs and fluxes (adapted from Baldassarre, 2017).
Coastal Changes: Water Level and Water Quality Implications
Coastal Population Patterns and Impacts on the Environment
Globally, population migration trends are clear; migrations are occurring in greater
numbers from rural areas to urban areas, with individuals seeking employment, better access to
resources, and other advantages associated with a more connected world. Many of these urban
areas are located on coastlines, prompting many geographers and scientists to predict a
substantial global migration from inland areas to the coast over the course of the twenty-first
century. Using current population trends, one study predicted that by the year 2060, low-
elevation zones, specifically coastal areas, could host as many as 1.4 billion people, up from 625
million in the year 2000 (Neumann et al, 2015). This would represent about 12% of the world’s
projected population of 11.3 billion people for 2060 (Neumann et al, 2015). While the
researchers found that most of these coastal population increases would occur in Asia and Africa,
they found that the same trend would likely occur in North America, though to a lesser extent.
This correlates with past data from the United States Census Bureau that has tracked increases in
coastal populations on American coastlines. Despite being the least populated coastal region in
the country, the southeast coastal United States, stretching from south Florida to the North
Carolina-Virginia border, experienced the most rapid population growth of any other coastal
region between 1980 and 2008 (Crossett et al, 2004). In particular, Dare County experienced a
10.1-15.0% increase in its permanent population of residents from 2003 to 2008.
Population growth in coastal settings is often tied to environmental degradation
(Crawford, 2007). Coastal development in the form of more commercial infrastructure and
residential housing can disturb the environment and affect coastal hydrology in myriad ways.
Deforestation and the clearing of wetlands for development leave less land to absorb
precipitation or storm surge in the groundwater reservoir, while an increase in impervious
surfaces, such as parking lots and houses, further hinders absorption. This can increase the risk
and the extent of flooding during rain events, as the water cannot infiltrate into the ground.
11Without wetlands and forests to act as natural buffers, increasing water levels on the land surface
due to storm surges may be exacerbated.
Water Quantity and Flooding
Environmental changes attendant with coastal population growth are layered onto a
dynamic landscape that is changing on both small and broad spatial and time scales, from daily
tidal changes to global climatic shifts. Although the annual extent of sea-level rise is perhaps
seen as minor and may go unnoticed by the general public, the consequences of elevated water
levels will perhaps be the most damaging to coastal areas, but especially to barrier islands, such
as the Outer Banks. A monitoring location in the coastal town of Duck, NC, has collected data
from 1978 to 2017 to depict monthly mean sea-level trends. The relative trend of increase is 4.55
millimeters (0.18 inches) per year, which can be equated to a change of 1.49 feet in 100 years
(NOAA, 2014). Each year, as positive-feedback cycles continue to raise global temperatures, and
land-based ice continues to melt, these trends may continue or become exaggerated (Vitousek et
al. 2017). When considered in conjunction with waves, tides, and storm surges, sea-level rise
will likely cause devastating inundation of low-lying coastal areas in the coming decades.
Further, extreme precipitation events have increased and are predicted to continue to increase
throughout the Southeastern region of the United States, as the number of days with more than
three inches of precipitation has increased during the years 1900 to 2016 (USGCRP, 2018).
Combined, changes to precipitation patterns and flooding frequency pose severe threats to
coastal communities.
The monetary cost of more frequent and spatially extensive flooding will impact home-
owners and business-owners in flood-vulnerable areas. Not only are flooding mitigation practices
expensive, but taking preventative measures to reduce the effects of flooding can be particularly
burdensome to property owners and local governments. The damage from flooding in major
coastal cities around the world is estimated to cost more than $1 trillion by 2050 (Negro, 2013).
These costs will be incurred by the citizens either directly, by individually paying for
preventative mitigation or clean-up measures, or indirectly, through taxation and public
spending.
Water Quality and Tourism
In addition to affecting water quantity, coastal development and environmental changes
also affect water quality by introducing pollutants, such as nutrients, bacteria, and chemicals.
The contamination of water reservoirs, including those used recreationally, poses a major threat
to the ways in which water resources are utilized on coastlines. Tourism is a major industry for
the Outer Banks, employing over 13,000 individuals and resulting in more than $100 million in
expenditures in the year 2017 (Visit North Carolina, 2018). A major draw for many visitors and
residents alike is the water itself for its recreational, commercial, and aesthetic values. A number
of pollutants pose hazards to both human health and to the ecological health of the region.
Contamination or degradation of coastal water reservoirs could reduce tourist presence and
revenue in the region.
Many coastal areas experience water quality issues as a result of stormwater runoff
(Schiff et al. 2015). As this water flow increases due to the expansion of impervious surfaces and
development, the water quality along the coast will suffer. Importantly, human development also
creates an additional reservoir and set of fluxes in the socio-hydrological cycle: wastewater and
its flow to groundwater, surface-water, sounds, and ocean reservoirs. We define wastewater as
12water that has been used in homes and businesses and then discarded through drainpipes.
Effective treatment of wastewater is critical to protecting human and environmental health within
coastal systems, yet the dynamic nature of these systems and environmental changes to the
socio-hydrological cycle can interfere with effectively treating wastewater to remove pollutants.
Wastewater, Wastewater Treatment, and Coastal Systems
In the United States, more than one in five households rely on onsite wastewater
treatment systems (OWTS) to treat and dispose of their wastewater, as opposed to centralized
wastewater treatment in the form of a public sewer system connection (EPA, 2018). OWTS are
comparatively low-cost and non-energy intensive means of effectively treating wastewater and
protecting water quality (EPA, 2018). However, when OWTS are not properly installed or
maintained, they can contribute to environmental degradation and public health concerns (EPA,
2018).
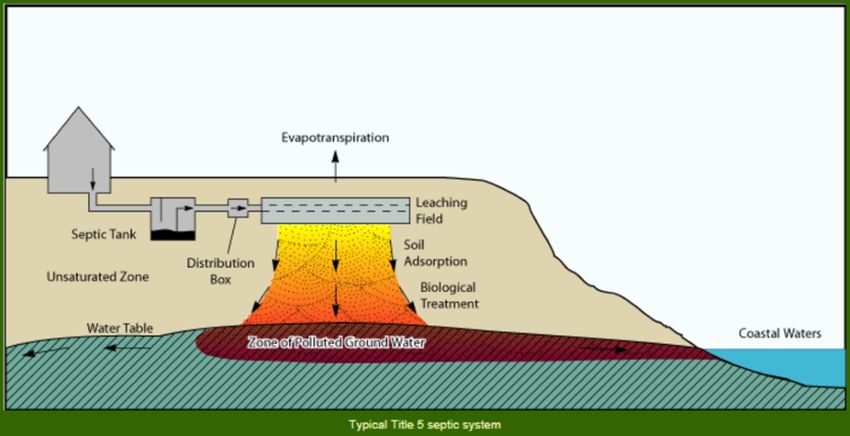
Septic tank systems are a type of OWTS. They are relatively simple structures that are
often found in rural areas, outlying suburbs, and locations distant from centralized sewage. They
are customizable in size and can be used by variously sized households and businesses in a
diverse range of locations, both inland and on the coast (Mallin, 2013). A septic tank system has
two main components: the septic tank itself and the drainfield (Figure 4; Smart Growth). When
you flush a toilet in your house, or when you use the water faucet to wash dishes, for example,
water will exit your house as wastewater. This water runs through the main drainage pipe and
enters the septic tank. Septic tanks are typically buried containers, which allow solids to settle to
the bottom of the tank, while oils and grease rise to the top. Inside the tank, anaerobic bacteria
break down the organic solids in the wastewater. When additional wastewater enters the tank,
some of the liquid wastewater, or effluent, will exit from the other side of the tank, entering a
distributional box before being distributed evenly through a system of pipes into
the drainfield (Stone Environmental, Inc., 2005). As the effluent percolates through the soil of
the drainfield, aerobic bacteria in the soil kill some of the remaining harmful components in the
effluent (Septic 101, 2016).
Septic systems can be compromised when the soil in the drainfield becomes
oversaturated. Effluent entering a saturated drainfield from the septic tank cannot percolate and
will accumulate on the surface. Instead of being filtered, pathogens, bacteria, and nutrients in the
effluent remain at the surface where humans and other organisms can come into contact with
them. Soils in the drainfield can become oversaturated when the water table rises due to
precipitation influxes or sea-level rise. A study on Cape Hatteras National Seashore found
evidence that septic leachate may already be contributing to increased levels of fecal bacteria in
ocean water due to runoff from lawns and roads after storms (Mallin et al., 2012). In a study
conducted in Beaufort County, NC, Humphrey et al. (2013) determined that OWTS contributed
to groundwater nitrogen levels. This kind of contamination from septic systems is exacerbated by
frequent and/or heavy precipitation (Beal et al., 2005). If coastal populations increase without
implementing updated wastewater treatment technologies, there is potential for deleterious
impacts on public health, as septic systems may become overused and leach biologically
hazardous effluent into the ocean, sound, surface-water, and groundwater reservoirs.
Septic Systems and Environmental Pollutants
Contaminants associated with septic systems affecting surface-water and groundwater
quality include inorganic nutrient pollution, including ammonia, nitrate, and phosphate, as well
13as organic contaminants, metals, chemicals, and fecal bacteria (Canter and Knox, 1991).
Determining whether or not contaminants found in surface-water and groundwater are the direct
result of septic contributions is complicated by other sources of some of these contaminants
within the system. This includes contaminants such as bacteria introduced by animal waste, from
either pets or wildlife, or nutrients stemming from lawn fertilizers. Presence of chemicals that are
unique to human wastewater, such as caffeine, artificial sweeteners, or chemical detergents, in
surface-water or groundwater indicate water contamination attributable to septic systems, since
these chemicals would not be found in the environment from non-septic sources (Richards,
2017). Previous studies have shown evidence of septic systems contributing contaminants to the
surrounding environment when considering the effects of environmental factors (e.g. Cooper et
al., 2016, Richards et al., 2015).
There are multiple significant reasons to be concerned regarding the presence of excess
nutrients within water reservoirs. Research has shown that nitrogen, in particular, among other
nutrients, such as phosphorus and carbon, can be an important limiting nutrient for primary
production and, in excess, contributes greatly to eutrophication within coastal systems,
threatening the function of ecosystems by deteriorating water quality (Howarth et al., 2006).
Reduction in the function of these ecosystems could limit the ecosystem services they provide
and could harm the overall health of the environment. Regarding bacterial contaminants, it is
imperative to consider the effects of fecal bacteria in surface-water and groundwater reservoirs,
since bacterial presence can increase the risk to humans and animals of contracting pathogen-
based illnesses (Noble et al., 2004). Public and environmental health concerns resulting from
these contaminants are critical to consider.
Maintaining Septic System Health in Nags Head, North Carolina
Septic systems have a large potential for water contamination, especially in areas such as
the Outer Banks, where they are common and concentrated in relatively close proximity to one
another. Individual home and business owners privately manage septic systems on their
properties in Nags Head and many other locations. Caring for an existing septic system is
important in order to maintain environmental quality and prevent contamination of surrounding
soil and groundwater. It is the property owner’s responsibility to maintain the health of their
septic system, and there are tasks that are required for upkeep. The US Environmental Protection
Agency (2002) recommends that septic systems be inspected every three years and that tanks be
pumped as needed, typically every three to five years. Efficient water use and careful disposal
ensure that the system is not damaged with foreign materials, such as cigarettes and large food
waste, while drain fields can be properly maintained by limiting overlying construction and
ensuring sufficient drainage (US EPA 2002).
The Town of Nags Head has employed measures to assess and encourage septic system
maintenance within the municipality by implementing the Septic Health Initiative. This
voluntary program began in 2000 and works to improve septic health through public education,
comprehensive tank inspections and pumping, and monitoring of groundwater and surface-water
quality (Town of Nags Head, date unknown). The Septic Health Initiative covers all OWTS that
process fewer than 3,000 gallons of wastewater per day. Through the initiative, homeowners and
businesses can acquire voluntary septic system inspections and receive loans for needed repairs
or replacements. Education and outreach aimed at homeowners and businesses on the importance
of upgrading outdated OWTS and/or elevating them in compliance with recommendations are
important to avoid groundwater contamination (Stone Environmental, Inc., 2005).
14Figure 4: Schematic depicting septic system structure and processes as they relate to the
surrounding environment (Smart Growth).
Adaptation Measures
In the face of environmental change, it is important to consider adaptive alternative
methods of wastewater treatment and other measures to prevent the spread of contaminants
between water reservoirs. Decisions regarding adaptation to change, including practicing low-
impact development, lowering groundwater, and implementing centralized treatment, involve
considering the logistical feasibility, financial concerns, and environmental impacts of alternative
options.
Low-Impact Development
Low-impact development refers to stormwater management technologies that are rapidly
being adopted by state and local governments to address increasingly extreme precipitation
events and subsequent runoff in developed areas (Clar et al., 2015). Low-impact development
includes installing structures like rain gardens, green streets and roofs, and hardscapes (Clar et
al., 2015). Rain gardens, bunches of perennial plants and native shrubs planted in ground
depressions, and green streets, streets bordered by permeable sidewalks and mature trees,
control stormwater by collecting and filtering it through plants and soil rather than allowing it to
run off impermeable surfaces and cause flooding. Green roofs provide storage, infiltration, and
evaporation of rainfall and capture runoff in a manner similar to rain gardens, but can be
installed on existing roofs to provide these services in already developed areas (Clar et al. 2015).
Low-impact development techniques are suitable for areas that rely on septic systems as the
wastewater treatment of choice since septic system functionality depends on soil saturation.
If stormwater is not managed effectively, soils remain saturated and hinder septic system
performance.
Groundwater Lowering
In coastal areas like Nags Head, when water levels rise, the distance between the septic
drain fields and the groundwater table shrinks. The smaller this distance is, the less time and
space the wastewater has to interact with soil and soil bacteria, meaning that the septic system
and filtration are both less effective. One way to combat this problem is by physically lowering
15the groundwater table, thereby allowing septic effluent to filter through more sediment before
reaching groundwater. There are several means of groundwater lowering, including pumping or
implementing drainage systems that empty into lower elevation reservoirs. Lowering the
groundwater table also allows the water contacting the ground during precipitation events and
flowing through stormwater ditches to percolate deeper into the soil before reaching the
groundwater table, delaying or preventing soil saturation and run-off.
Historically, the technique of groundwater lowering has been used for projects ranging
from reducing earthquake damage to efficiently harvesting coal bed methane. A single large-
diameter electrical submersible pump, typically used to clear water from coal seams, can pump
greater than 150,000 gallons of water per day (Hashimoto and Yasuda 2016; Thakur et al. 2014).
Although it would be technologically feasible, lowering the groundwater table in the town of
Nags Head would be a financially burdensome and energy-intensive way to reduce the
interactions between the groundwater and septic system effluent. The immediate benefits of this
strategy would include desaturation of the soil near the surface, creation of increased space for
water to percolate through, and reduced septic system failure.
Centralized Sewage Treatment
Not all OWTS locations have soil that is suitable for septic system drainfields. In some
locations, the water table may be too high relative to the soil surface where septic systems would
be installed. For this reason, there have been alternative onsite systems employed, such as using
sand, peat, or plastic media in raised drain fields to aid in the treatment of wastewater in the
place of soil. This process, known as biofiltration, can be efficient, as it does not require highly
trained personnel to maintain and can instead be maintained by the property owner themselves.
A study in India looked at the benefits of using an anaerobic onsite filter-based package system
as an alternative to septic, and found it to be low-cost and extremely efficient at removing waste
and pathogens (Sharma and Kazmi, 2015).
Centralized sewage treatment is another alternative to septic systems. This consists of a
single plant that treats wastewater for an entire town or smaller area, such as a neighborhood.
Unlike individual septic systems, they require electricity in order to filter the water, and do not
rely on the individual households to properly maintain their wastewater treatment systems. They
are typically farther away from residences, which lessens the chance of pollutant contamination
and odor problems. There are also high costs and massive infrastructure changes associated with
centralized sewage that would present challenges if Nags Head were to make the change from
OWTS to a centralized system.
Perspectives on Wastewater Treatment and Environmental Change
Effectively adapting wastewater treatment will require coordinated decision-making
among individual property owners, local governments, and state and federal agencies. Before
such efforts are implemented, a clear understanding of how residents perceive issues related to
wastewater and changing environmental conditions is needed. These perceptions are part of the
socio-hydrological cycle (Figure 3) and they directly influence decision-making. Residents’
attitudes, behaviors, knowledge gaps, and concerns about the consequences of ineffective
wastewater treatment are critical information for adaptive strategy development.
Only limited research related to resident and homeowner perceptions, behaviors, and
knowledge regarding wastewater and septic tank systems exists. We know even less about
16homeowner perspectives on the potential interaction between wastewater treatment decision-
making and shifting environmental factors. Findings obtained in a variety of locales have
indicated that homeowner knowledge and awareness of septic tank systems is largely limited
(e.g. Schwartz et al. 1998; Fizer 2016). Brownlie et al. (2015) examined pro-environmental
behaviors of residents with OWTS in the United Kingdom and found that the majority of
respondents felt personally responsible for maintaining the system. This suggests that the
inefficiency and detrimental impacts of these systems could largely be mitigated by better
equipping residents with information about proper maintenance of septic systems and their
associated environmental impacts. In addition, mitigation could be achieved by identifying
appropriate resources and incentives for residents to adapt their OWTS in response to changing
environmental conditions (Brownlie et al., 2015). Another study suggested that water quality was
considered a ‘common good’ resource shared within a community, and as such, the local
government should bear the responsibility of handling water quality issues like wastewater
contamination (McSwain, 2006).
The relative weighting of residents’ expectations about individual responsibility
compared to community or governmental responsibility for managing the risks associated with
wastewater treatment failure and poor water quality will inevitably vary across coastal
communities. These expectations may be related to a variety of factors that influence perceptions
of the severity and likelihood of these risks, including awareness of coastal change, its
implications for septic system function, and personal experiences of flooding and septic failure
(Devitt et al., 2016). Understanding these perceptions is critical to engaging residents in effective
decision-making and behaviors around wastewater treatment that will be adaptive to continuing
change in coastal systems.
Our Study
Our project’s goal is to understand how changes to the socio-hydrological cycle,
including climate-driven factors, affect key aspects of water quantity and quality in Nags Head,
NC. We used two distinct approaches to shed light on this question: a natural science approach,
including water level and quality sampling and data analysis, and a human dimensions approach
based on interviews to determine stakeholder perspectives. We then integrated the results to gain
insight into our overarching question regarding changes to the socio-hydrological cycle.
For the human dimensions component of our study, we took a qualitative approach to
characterize Nags Head residents’ perceptions about coastal waters, flooding, wastewater
treatment, and changing environmental conditions, with a focus on the Gallery Row sub-
watershed. We aimed to understand how participants conceptualize the quality of surface-waters,
the impacts of storm- and flood-waters, and the integrity of onsite wastewater treatment systems
in the context of a changing coastal environment. We were interested in identifying any gaps in
knowledge about onsite wastewater treatment methods and maintenance, as well viewpoints
regarding responsibility for wastewater management.
The natural science and hydrology research was composed of two major components:
examining how groundwater levels have changed over time and understanding how surface-
water quality is affected by storm events. We analyzed data collected from groundwater wells by
the Town of Nags Head from 2011 through 2017 to examine the changes in groundwater levels
across the landscape of Nags Head. We hypothesized that the groundwater level changed over
time as a result of anthropogenic changes to the hydrologic cycle. We anticipated short-term
17changes to include higher groundwater levels and higher surface drainage ditch water levels in
low-lying areas due to runoff from impervious surfaces. We also expected seasonal variability in
groundwater levels as a result of increases in household water use, which takes water from the
confined groundwater aquifer and transfers it to the unconfined groundwater aquifer via
wastewater disposal, during the height of summer tourism. The historical dataset we accessed
was shorter than the thirty-year record advised to discern a long-term rise in groundwater level
expected as a result of sea-level rise. However, we also examined the changes in groundwater
level from 2011 to 2017 to assess a long-term pattern of increasing groundwater level
attributable to the rising ocean pushing water in the unconfined aquifer under Nags Head closer
to the surface.
Our second hydrological research direction was a field-based study aimed at exploring
how water quality changed during and following storm events. We hypothesized that we would
see a spike in bacteria and nutrient concentrations in the surface-water sampling sites following
storm events. We expected this to occur as the result of a combination of the following two
fluxes: run-off of water containing nutrients and animal feces contaminating surface-water in
ditches; and leachate from septic system drainfields mixing with groundwater and surface-water
in drainage ditches as a result of soil saturation. This field study will also serve as the “before”
component of a Before-After-Control-Impact (BACI) analysis to determine the efficacy of a
groundwater-lowering engineering modification of an ocean outfall pipe in the Gallery Row sub-
watershed. This modification is intended to lower groundwater and prevent flooding, but will
also perhaps improve water quality. We encourage subsequent research to include the “after”
component of the proposed BACI we have begun here.
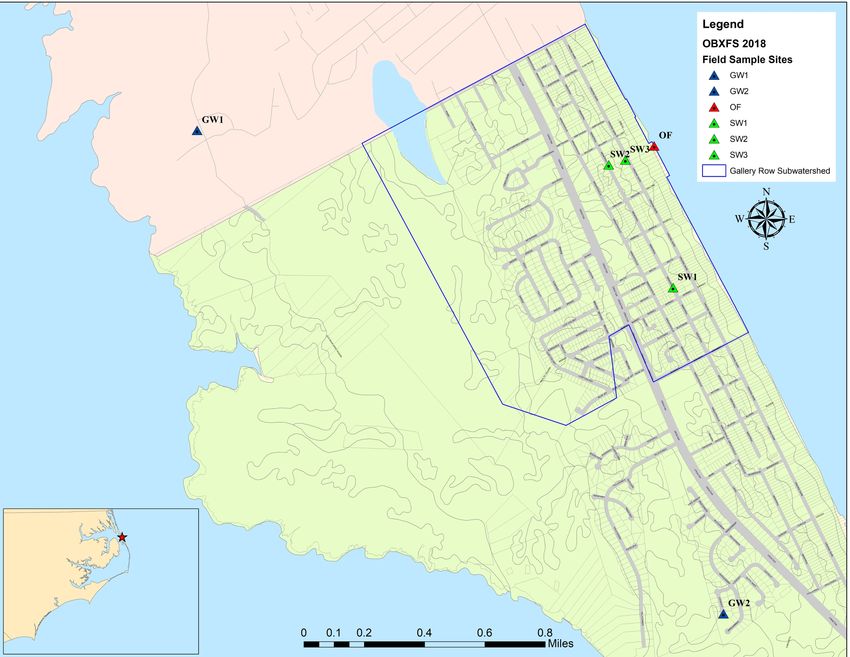
18Methods Study Site To better understand water level and water quality challenges within the Town of Nags Head, we worked with the Town to identify a sub-watershed where flooding was regular and groundwater lowering engineering modifications were planned for the near future. We thus selected the Gallery Row sub-watershed for our field-based hydrological and human dimensions components of our study (Figure 5). We sampled six locations for the field-based water quality study. Two of the sites were groundwater wells: one located in the Nags Head Woods, the other at the end of Lookout Street near Jockey’s Ridge State Park. We also collected data and samples from three surface-water drainage ditches: two of these located on S. Memorial Avenue, and one just south of the Red Drum Taphouse restaurant. Lastly, we sampled the Gallery Row Ocean Outfall, which is south of the East Gallery Row beach access. Table 1 shows the geographic coordinates of the sampling locations. Figure 5: OBXFS Field sampling sites and Gallery Row sub-watershed in north Nags Head, North Carolina. Map sub-watershed, town limits, and road data provided by the Town of Nags Head. 19
Table 1: Names, abbreviations, and geographic coordinates of sampling locations for the field-
based water quality research component of the 2018 OBXFS Capstone research project.
Sampling site name      Abbreviation Geographic coordinates
Groundwater 1           GW1            35.99035° N 075.66731° W
Groundwater 2           GW2            35.96626° N 075.63715° W
Surface-water 1         SW1            35.98202° N 075.63947° W
Surface-water 2         SW2            35.98802° N 075.64304° W
Surface-water 3         SW3            35.98823° N 075.64204° W
Outfall                 OF             35.98886° N 075.64031° W

Human Dimensions

        We conducted semi-structured qualitative interviews based on a set of open-ended
questions, provided in Appendix A. The interviews targeted four main topic areas, but by virtue
of asking open-ended questions, allowed participants the latitude to address other topics that
were important to them. We asked participants to describe their history in Nags Head, their
connections to water reservoirs, and the relationship between the town and water. Interview
questions aimed to identify any changes in water quality and quantity that participants had
noticed and to discuss details about experiences with flooding, other storm events, and flood
prevention measures. Interviews also covered wastewater treatment, including questions about
septic tank system maintenance, centralized wastewater treatment, and the Town of Nags Head’s
efforts to manage wastewater. Finally, we asked participants about their perceptions concerning
relative responsibilities for water quality and quantity and the adaptability of the town to
changing conditions.
        We interviewed residents and business owners of the Gallery Row sub-watershed in Nags
Head, as well as some additional residents, whose properties are located outside this sub-
watershed. We contacted potential participants by canvassing local businesses within the sub-
watershed and through recommendations and referrals from field site professors, Outer Banks
Field Site (OBXFS) Community Advisory Board (CAB) members, internship mentors, and
Coastal Studies Institute (CSI) employees. After these initial contacts were made, we employed a
snowball method to expand our pool of participants. The snowball method involved requesting
additional participant referrals upon the completion of each interview, creating a chain effect of
participant referrals. Interviews occurred between October 5, 2018, and November 14, 2018, and
ranged from 20 to 80 minutes in length.
        We conducted a total of 27 interviews. Three of these involved two participants, but for
the purposes of our study are counted as one. Twenty participants were property owners within
Gallery Row sub-watershed and seven were outside Gallery Row sub-watershed. Participants
were also characterized by length of residence in the Outer Banks: six participants were lifelong
residents, denoted as “born and raised;” fifteen participants were considered “long-time”
residents, those who have been living in the Outer Banks for ten or more years; and six
participants were considered “new arrivals,” those who have lived in the Outer Banks for less
than ten years.
        All interviews were audio recorded with the participants’ consent. Recordings were then
transcribed verbatim. Transcripts were coded using NVivo v.11, a text analysis software
program. Two students coded each interview, creating “codes” or labels to categorize each

20
interview’s contents. By reviewing the contents of these “codes,” we identified patterns in the
data and organized these to describe emergent themes related to our interview topics. Our
interview and analysis methods produced rich qualitative data, but we recognize that our findings
cannot be generalized to all residents of the Town of Nags Head or the Outer Banks. All
interviews and analyses were conducted to maintain the confidentiality of our participants’
identities.
Historical Water Level Study
Data source and explanation
Historical data from groundwater and surface-water reservoirs in Nags Head were
collected by Environmental Professionals Inc. consulting firm at the request of the Town of Nags
Head. The chemical and biological analysis of water samples was completed by Envirochem
Laboratories in Wilmington, NC. The data were provided as Microsoft Excel sheets that included
information for 23 locations (Figure 6) sampled for 13 water quality parameters from March
2011 to June 2017. We only used data from groundwater wells in our historical water level study
and a single surface-water sampling station, Wrightsville #2, in our field-based water quality
study. The water quality parameters reported include: depth to groundwater (DTGW; in.), field
temperature (⁰C), dissolved oxygen (mg/L), specific conductance (µmhos/cm), salinity (parts per
thousand; ppt), pH, turbidity (Nephelometric Turbidity Unit; NTU), ammonia nitrogen (mg/L),
total phosphorous (mg/L), nitrate nitrogen (mg/L), nitrite nitrogen (mg/L), fecal coliform or
Escherichia coli (E. coli; Col/100 mL), and Enterococci (Col/100 mL).
There were eight groundwater monitoring wells: Blackman, Curlew, Juncos #1, Juncos
#2, Nags Head Control Site, Nags Head Fire Station, Old Cove #1, and Old Cove #2 (Figure 6).
The Blackman groundwater monitoring well was only sampled for two years and two months-
from March 2011 to May 2013 - out of the six years and three months - March 2011 to June
2017- total. The other seven sites were sampled through June 2017. Additionally, data available
for the years 2011 to 2012 only provided DTGW data and fecal coliform measurements for each
of the eight monitoring wells. Reports of fecal coliform and E. coli were inconsistent throughout
the monitoring years. Groundwater data were not reported for December, January, and February
of any year, with exception of February 2014.
Historical precipitation data were obtained from the First Flight Station weather
monitoring site using Weather Underground’s official online database (Monthly History, 2018).
We used monthly precipitation sums from October 2010 through September 2017 and organized
the data into water years starting with 2011 and ending with 2017, each water year running from
October 1 until September 30 of the following calendar year.
21Figure 6: Historical groundwater and surface-water sampling locations used by the Town of
Nags Head’s water quality study in Nags Head, North Carolina. Map sub-watershed, town limits,
road, and historical water level study location data provided by the Town of Nags Head.
Data analysis and calculations
To determine whether water level has changed in a consistent pattern across the
landscape of Nags Head, we compared elevation and mean DTGW. Elevation data were
gathered from NC One Map, a digital elevation model (DEM) with contour lines from ArcGIS
(NC One Map 2018). To compare mean annual depth of groundwater to the median depth of
groundwater for the years 2011 to 2017, we calculated the median DTGW for each groundwater
well across all sampling dates and the geometric mean of the groundwater data for each water
year at each well. We chose median DTGW to represent the baseline depth in order reduce the
influence of extreme precipitation events and subtracted baseline DTGW from mean DTGW of
each well for each water year to obtain the mean difference from baseline DTGW, which served
as a measure of annual variability in DTGW. Furthermore, mean annual DTGW data from each
well were organized by elevation to analyze the effect of elevation on mean DTGW. Monthly
precipitation data from the First Flight weather station were summed by water year. We chose to
consider all data points for each sampling date even if a majority of the other wells were not
sampled to include more data points for each well and to better inform how water level has
changed over time.
22Spatially, we categorized the eight groundwater wells into six drainage basins based on location
(Table 2). These drainage basin classifications were obtained from the Town of Nags Head as a
geospatial ArcView data layer. From here on, the terms drainage basins and sub-watershed will
be used interchangeably. Monthly groundwater level data for each drainage basin were
categorized by season, classifying winter months as December to February, spring as March to
May, summer as June to August, and fall as September to November. For these seasonal
calculations, sampling events were only included in calculations if data for at least four of the
groundwater wells were recorded during one sampling event. This was done in order to more
accurately assess the overall changes in water level over time and space in Nags Head. We
calculated the mean DTGW for each drainage basin by water year for all of the respective wells’
data. We examined seasonal data within drainage basins that reflect the influence of topography
and landscape features, such as Highway 158, on water movement within the landscape, and
compared locations on the more developed east side of the highway to those on the less
developed west side.
Table 2: Nags Head historical data groundwater well categorization into drainage basins and
corresponding elevation for each well.
Not
Drainage Basin 1 2 8 16 32
listed
Nags Old Nags
Juncos 1 &
Wells included Blackman Curlew Head Coves Head Fire
2
Control 1 & 2 Station
Elevation (feet) 8 6-8 28-30 4 12-14 2-6
East or West of
East East West West West East
Highway
When analyzing the long-term patterns of groundwater level, we chose to organize the
DTGW measurements taken from each well by water year and calculate the mean DTGW from
the entire dataset of DTGW measurements. We chose to use mean DTGW as the baseline in this
calculation to account for extreme precipitation. We applied a linear regression model to
determine mean changes in DTGW over the seven-year dataset.
To examine if historical data collection included the range of precipitation amounts
experienced by our study site, we compared patterns in precipitation and the number of historical
data sampling events using a linear correlation coefficient analysis. We compared historical
precipitation data to sampling event dates to determine the relationship between amount of
precipitation and sampling frequency. Lastly, we analyzed sampling across each season.
Water quality field study
Sample collection
The qualitative aspects of this project included visual and olfactory observations of the
water quality at each of our six sampling sites, although the bulk of the analysis is quantitative in
nature. At each site, we collected a one-liter water sample in a sterile, acid-washed high-density
23You can also read


