Australian Dairy Industry - Sustainability Framework Progress Report 2015
←
→
Page content transcription
If your browser does not render page correctly, please read the page content below
Australian Dairy Industry
Sustainability Framework
Progress Report 2015

Reporting Progress against the Dairy
Industry’s 2020 Sustainability Targets and
Performance Measures

Enhancing livelihoods Improving wellbeing Reducing environmental impact
Contents
                Statement from the Chairs.....................................................................................3
                2015 Executive Summary.......................................................................................5
                     Enhancing livelihoods............................................................................................................................................... 7
                     Improving wellbeing.................................................................................................................................................. 8
                     Reducing environmental impact....................................................................................................................... 8

                Section 1: About our Industry, the framework and this report ..................................... 9
                About our industry, the Framework and this report.............................................................. 10
                     About the Australian dairy industry................................................................................................................. 10
                     About the Dairy Industry Sustainability Framework................................................................................. 11
                     Principles and Guidance....................................................................................................................................... 11
                     Governance................................................................................................................................................................. 12
                     Defining report content........................................................................................................................................ 13
                     Determining the issues............................................................................................................................................. 13
                     Engaging stakeholders............................................................................................................................................ 14
                     Issues across our value chain............................................................................................................................... 16

                Industry snapshot................................................................................................................................................... 17
                Section 2: Detailed discussion on 2015 Progress..................................................................... 18

             Enhancing livelihoods                                                   Target 1: Increase the future competitiveness and

                                                19                                   profitability of the Australian dairy industry................................ 19

                                                                                     Target 2: Increase the resilience and prosperity of dairy
                                                                                     communities........................................................................................... 25

                                                                                     Target 3: Provide a safe work environment for all dairy
                                                                                     workers...................................................................................................... 30

                                                                                     Target 4: Attract, develop and retain a skilled and
                                                                                     motivated dairy workforce........................................................... 35

Enhancing livelihoods Improving wellbeing Reducing environmental impact                                                                                                                            1
Improving wellbeing                                                  Target 5: All dairy products and ingredients sold

                                                40                                  are safe................................................................................................... 40

                                                                                    Target 6: Dairy contributes to improved health
                                                                                    outcomes for Australian communities..................................... 44

                                                                                    Target 7: Provide best care for all animals............................ 49

                        Reducing                                                    Target 8: Improve nutrient, land and water
             environmental impact                                                   management........................................................................................ 54

                                                54                                  Target 9: Reduce the consumptive water intensity of
                                                                                    dairy manufacturers by 20%............................................................ 60

                                                                                    Target 10: Reduce greenhouse gas emissions
                                                                                    intensity by 30%..................................................................................... 63

                                                                                    Target 11: Reduce waste to landfill by 40%........................... 68

                 Section 3:
                 Appendices ............................................................................................................................................................... 73
                 Appendix 1.................................................................................................................................................................. 74
                      Dairy Industry Sustainability Consultative Forum Members 2015..................................................... 74
                      Dairy Industry Sustainability Steering Committee Members .............................................................. 75

                 Appendix 2.................................................................................................................................................................. 76
                      GRI Content Index .................................................................................................................................................. 76

                 References and abbreviations................................................................................................................ 79
                      Internal references and surveys........................................................................................................................ 79
                      External references and surveys....................................................................................................................... 80

Enhancing livelihoods Improving wellbeing Reducing environmental impact                                                                                                                         2
Statement from the Chairs

We’re strengthening our
commitment
W
          e present to you the 2015 Progress Report for    As you will see in this report, we still have gaps in our
          the Australian dairy industry’s Sustainability   targets and performance indicators, as well as areas
          Framework. We invite you to review this          where we have not made progress against our
report to see where we have made progress towards          Targets. A priority in 2016 will be to review the gaps
our 2020 targets and where we still need to do more.       and address these where appropriate — or find
                                                           better ways to measure progress against the Targets.
The Australian dairy industry is strengthening its
                                                           Many measures are around perceptions and we
commitment to provide a sustainable industry — one
                                                           want to move to more robust ways to measure our
that enhances livelihoods, improves the wellbeing
                                                           performance. This should help us better understand
of people and our animals and reduces our
environmental impact. We know that it is important         the challenges we need to address as we strive to
to provide evidence of our commitment and this             be a sustainable and prosperous industry supported
report provides that evidence.                             by the community.

The Sustainability Framework is led by the Australian      We are proud to have made progress in
Dairy Industry Council (ADIC), supported by an             some targets — for example, our farmers and
industry Steering Committee and underpinned by             manufacturers have demonstrated progress in
Dairy Australia. It is a whole of industry commitment.     improving nutrient, land and water management,
                                                           and reducing consumptive water intensity,
The content of the Framework is also guided by             greenhouse gas emissions and waste to landfill.
stakeholder consultation to ensure we understand
their needs and expectations. Our work in 2015             The dairy industry’s efforts in helping the Government
has involved extensive and ongoing engagement              to secure Free Trade Agreements with our major
both within the industry and with our broader              trading partners, China, Japan and Korea, will
stakeholders. These stakeholders include our               also help increase our future competitiveness and
customers, suppliers, government, other primary            profitability.
industries, non-government and special interests           Other targets — for example reducing time lost to
groups and, importantly, the communities which             injury on farms and in the manufacturing sector
support our farms and processing plants. This              — have not progressed as well as hoped. We will
consultation is helping the Framework evolve with          continue our efforts to make progress in these
changing stakeholder expectations.                         important areas.
Issues that have emerged in recent times include
labour practices, food waste, transparency,
traceability and the broad range of evolving               “Our work in 2015 has involved
dairy production systems. Globally, the recently
                                                           extensive and ongoing
announced UN Sustainable Development Goals
and the commitment to implement practices to               engagement both within the
hold global temperature rise to a maximum of two           industry and with our broader
degrees are also challenges that the dairy industry        stakeholders.”
needs to consider. These areas and other emerging
issues will be reviewed against the Framework in 2016.

Enhancing livelihoods Improving wellbeing Reducing environmental impact                                            3
The Australian dairy industry is also proud to play
its part in the global movement towards greater
sustainability. The industry aspires to meet rising
demand worldwide for industries to manage their
environmental impact and contribute to action on
issues such as climate change, labour practices,
animal welfare, health and wellbeing. These same
issues are a key part of the Australian dairy industry’s
Sustainability Framework.
The Australian dairy industry’s work on its
Sustainability Framework was acknowledged with
a Banksia national sustainability award in 2015. We
are grateful for the wider community endorsement
of our achievements so far, and invite you to
read this report and encourage your feedback.
Your contribution will help us continue to improve
outcomes for our industry and our communities so           Chris Griffin                   Simone Jolliffe
we can address the challenges we face together.            Chair, Dairy Sustainability     Chair, Australian Dairy
                                                           Steering Committee and          Industry Council
                                                           Consultative Forum

                                                           Dairy Industry Sustainability Framework
                                                           March 2016
                                                           ADIC is the peak industry policy body and the owner of
                                                           the Australian Dairy Industry Sustainability Framework on
                                                           behalf of industry.

            Enhancing Livelihoods
            For the 39,000 Australians employed on farms and in manufacturing by the dairy sector,
            dairying is their future. It creates jobs for generations and careers for life. By generating
            $13.5 billion in economic value, dairying makes a vital contribution to the nation and, in
            particular, regional communities.
            Improving Wellbeing
            With a unique natural package of 10 essential nutrients, dairy foods have helped underpin
            the health and wellbeing of generations of Australians. As an industry, we care deeply for the
            wellbeing of the community and our animals.
            Reducing Environmental Impact
            Dairy farmers are responsible stewards of the land. Dairy farmers and manufacturers work hard
            to reduce waste to landfill, reduce greenhouse gas emissions intensity, and use water wisely.
            Technology and tenacity underpin our commitment to reduce our impact on the environment.

Enhancing livelihoods Improving wellbeing Reducing environmental impact                                                4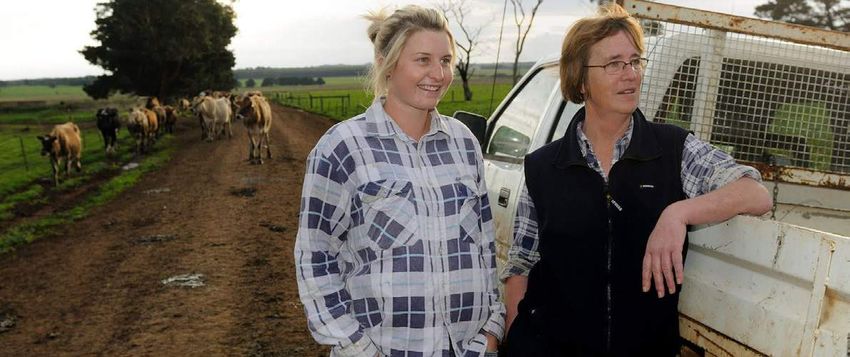
2015 Executive Summary

Reporting our progress and
planning for the future

T
   he Australian dairy industry’s 2015 Sustainability   The Executive Summary provides a quick overview
   Progress Report continues the industry’s             scorecard outlining our results to date. While we
   commitment to report our progress transparently      have made progress in some of the Targets, we have
against our 2020 targets.                               not progressed as we had hoped in others.
This report provides background on the dairy            Progress during 2015 against those indicators for
industry as it is today as context for the discussion   which baselines and targets have been established,
on our progress. It also sets out the background to     showed several areas of improvement, including:
the Framework – the principles we adhere to, the          • The intensity of waste sent to landfill by
governance arrangements for the framework and               manufacturers has dropped 46% since
our stakeholder consultations. The 2015 Progress            2011, and exceeds the 40% target set for
Report also shows where the disclosures made                2020; however, this measure only covers
align with the Global Reporting Initiative (GRI)            approximately 33% of industry by milk
Sustainability Reporting Guidelines (see Appendix 2).       production — further work in 2016 will be
Detailed discussion on each Target is provided under        undertaken to increase the coverage
the following headings:                                   • The increased proportion of farmers with
— Our Story in Brief                                        nutrient management plans, which at 58% is on-
                                                            track to achieve the 2020 target of 80%, having
— How we’re tracking
                                                            almost doubled since 2012
— What we’re doing
                                                          • The reduction in the use of routine calving
— What we’re planning                                       induction — 88% of farmers do not use it
— What our stakeholders are saying.                         compared to 80% in 2014.

Enhancing livelihoods Improving wellbeing Reducing environmental impact                                   5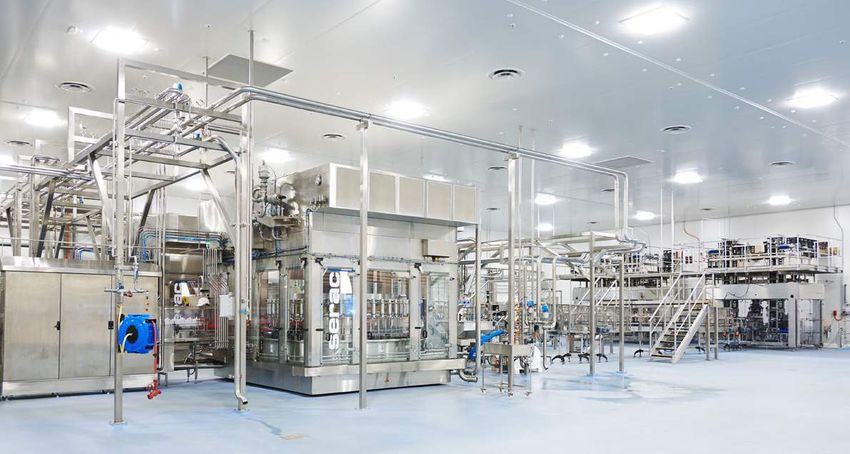
We are especially concerned that we have                    Now, as a result of the shifting landscape, globally
regressed from the 2014 results for Target 3 (Providing     and nationally, a detailed materiality study and a
a Safe Work Environment for all Dairy Workers).             review of all targets, indicators and performance
Enhancing the safety of all our people is paramount         measures will be undertaken during 2016. The
and we will be reviewing the activities in this area to     findings will help industry stay up-to-date with what
see how we can improve this outcome in 2016. Other          issues matter most to our stakeholders and how to
areas where the industry’s performance has declined         prioritise and respond to them.
include the proportion of people who recognise
                                                            We hope this work will make the industry’s choice of
dairy as a quality product, which slipped to 69% from
                                                            issues, activities and outcomes clearer and, as a result,
a baseline of 72% (the 2020 target is 80%).
                                                            gaps in information about baselines, progress and
There are other areas where further progress is             targets for the most important indicators will be filled.
needed, such as increasing the proportion of dairy
                                                            The industry has and continues to deal with a
farmers who are aware of, and implement, the
                                                            number of important policy and engagement
recently agreed (January 2016) standards for animal
                                                            issues — for example, the implementation of the
welfare. Currently, awareness stands at 56%, with our
                                                            Murray Darling Basin Plan (which will affect the
target for 2020 being 100%.
                                                            amount of water farmers can use). These issues
We are disappointed to report that we did not               take time to address, and sometimes distract from
establish baseline data for all 41 indicators in the        the ongoing actions needed on the ground to
Dairy Industry Sustainability Framework, nor, in some       reach our 2020 Targets.
cases, set performance targets, despite a plan to do
                                                            Our approach during 2016 will be to prioritise those
so in 2015.
                                                            issues which are most significant for the industry
As the Australian dairy industry strives to maintain        and our stakeholders. This will include consideration
its place as a trusted provider of food, we also            of how the industry can support Australia’s
recognise that community wants and needs                    commitment to the United Nations Sustainable
change over time. The ongoing development of                Development Goals and COP21, balance the
our Framework means we need to understand the               contribution to sustainability targets made by the
expectations of our customers and the communities           farming and manufacturing sectors, encourage
in which we operate, both now and well into the             and support continuous improvement throughout
future and be responsive to change.                         the supply chain and respond to continuing calls for
                                                            evidence of our sustainability credentials.
During 2015 consultation with stakeholders raised
new issues such as labour practices and the broad           The 2015 Progress Report provides a snapshot of
range of evolving dairy farm production systems.            our progress and sets the base for our work during
In addition, global talks led by the United Nations         2016. You can also view the report on line at
set new goals for sustainability (SDGs) and climate         www.sustainabledairyoz.com.au. We welcome
action (COP21).                                             your comments on our 2015 report.
Together, these issues, views and events raised
questions about the priorities in the industry’s strategy
for the sustainable production of dairy products. As
a result, the industry has spent time considering the
impact of these factors on the sector.

Enhancing livelihoods Improving wellbeing Reducing environmental impact                                             6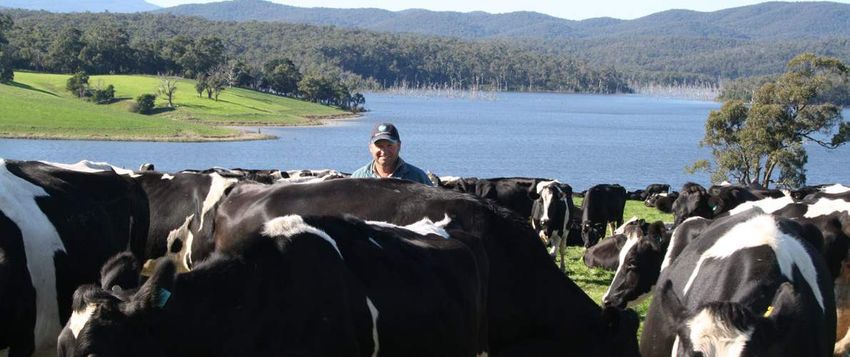
2015 Executive summary
Enhancing livelihoods
Priority area Target Indicator Baseline 2015* 2020 target Progress Towards our 2020 target Snapshot
Creating industry
prosperity
1 Increase the future competitiveness
and profitability of the Australian dairy
1.1 % Profitable farms (rolling 3 year average) 55% 42% Under review
Indicator 5.3
industry 1.2 Market preference Under review Under review Under review – Indicator 2.3 Consumer support
Community recognition (quality products)
1.3 Market access Under review Under review Under review – Baseline
2020 2020
Target Baseline Target
71% 2015 78% 2015 86%
77%
1.4 % of farmers planning capital investment 40% 52% Under review Performance
68%
Performance
77%
3
1.5 Product diversity Under review Under review Under review – % drop in No improvement
recognition
Supporting communities
2 Increase the resilience and prosperity in recognition of dairy as
2.1 Economic contribution Under review Under review Under review – a quality product
of dairy communities
2.2 Government recognition Under review Under review Under review –
2.3 Community recognition — dairy industry is an essential part of community 71% 68% 78%
Indicator 3.2 Indicator 6.1a
— people appreciate dairy farmers in our community 76% 79% 87% Long Term Injury Frequency Rate
(dairy farmers)
Healthy diet
(good health)
Investing in dairy people
3
2020
Provide a safe work environment for all 3.1 OHS training — dairy farming 46% 46% 100% Baseline
Target
85%
dairy workers 72% 2015
Performance
— dairy manufacturing 100% 100% 100% 2014
69%
Baseline Performance*
3
6.4
5.2
3.2 Lost Time Injury Frequency Rate — dairy farming 5.2 6.4 3.6 % drop in
23
2020
(LTIFR) Target consumer
% increase perception
3.6
— dairy manufacturing 8.7 10.9 6.1 in LTIFR
3.3 Fatalities — dairy farming 2 3 Zero X * Data is reported one year in arrears.
— dairy manufacturing 0 0 Zero
Indicator 4.2
4 Attract, develop and retain a skilled and 4.1
motivated dairy workforce
Suitable applicants (farm) — dairy farms 20% 20% Under review Participation in development
(extension)
— dairy manufacturing Under review Under review Under review – 2014
Performance*
39%
2020
4.2 Participation in development — extension 20% 39% 40% Target
19
Baseline
30%
activities 20%
% increase in
— education Under review Under review Under review – participation
* 2014 data is the latest
4.3 Retain workforce 75% 75% 90% available for this measure.
4.4 Business planning 8% 8% 50%
Understanding 2015 Performance
improvement from last measurement no change from last measurement regression from last measurement * If no measurement in 2015, latest available shown ongoing target achieved in 2015 X ongoing target not achieved in 2015 “Under review” indicates where an appropriate baseline measure or target has yet to be established
Enhancing livelihoods Improving wellbeing Reducing environmental impact 7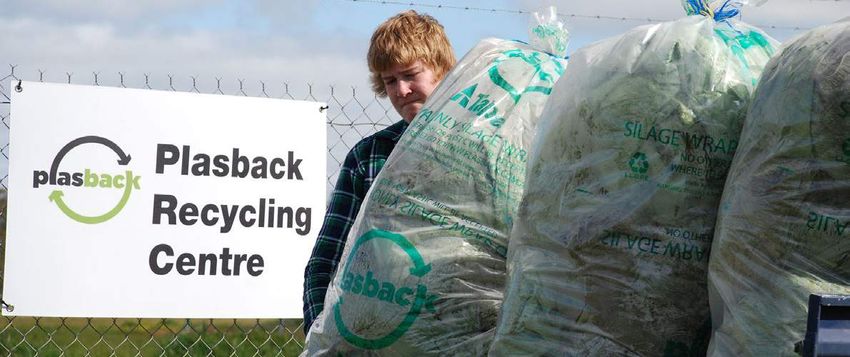
Improving wellbeing
Priority area Target Indicator Baseline 2015* 2020 target Progress Towards our 2020 target Snapshot
Ensuring health and
safety
5 All dairy products and ingredients sold
are safe
5.1 Chemical residues — compliance Zero non-compliance Zero non-compliance Zero non-compliance
5.2 Product recalls 7 9 Zero X
5.3 Consumer sentiment — dairy products are safe 67% 67% 77% Indicator 5.3 Indicator 8
Indicator 2.3 Consumer support Nutrient
— dairy makes high-quality products 77% 75% 86%
Community recognition (quality products) management
2020 2020
Maximising nutrition
6
Baseline
Dairy contributes to improved health 6.1a Healthy diet — dairy is essential for good health 72% 69% 71%
85% 2015 78%
Target Baseline
77% 2015
Target
86%
2015
Performance
Performance Performance
outcomes for Australian communities 68% 77%
58%
— dairy food increases my weight 32% 31% 20%
6.1b Healthy diet — NHMRC Recognised Recognised
% drop in
Ongoing recognition 3
recognition
No improvement
in recognition of dairy as
a quality product
Baseline
30%
28 % incre
in nutri
manag
6.2 Daily intake Under review Under review Under review – plans
Caring for our animals
7 Provide best care for all animals 7.1 Compliance with standards — aware of new standards 56% 56% 100%
7.2 Recommended practices: 100% Indicator 3.2 Indicator 6.1a Indicator 10
Long Term Injury Frequency Rate Healthy diet Emissions from
(dairy farmers) (good health) manufactur
— reduce use of routine calving induction 80% 88% 2020
Target
Baseline
Baseline 178.7t CO2-e
85% per ML
72% 2015
— don’t dock tails 80% 85% Performance
69% 2015
Performance
2014 152.5t CO2-e per M
— disbud prior to 2 months 57% 63% Baseline Performance*
3
5.2 6.4
15
% drop in
23
2020
consumer % drop
— lameness strategy 87% 95% % increase 3.6
Target
perception GHG
in LTIFR emissio
intensi
— cool infrastructure 94% 98%
* Data is reported one year in arrears.
— bobby calves fed within 6 hours prior to transport 97% 97%
7.3 Public recognition of caring for animals 60% 59% 75% Indicator 4.2 Indicator 11
Participation in development Manufacturer
(extension) to landfill
Baseline
2014 2.69t per ML
Reducing environmental impact
Performance*
39% 2020
Target
19
Baseline 2015
30% Performanc
20%
% increase in 1.45t per M
participation
Priority area Target Indicator Baseline 2015* 2020 target Progress Towards our 2020 target Snapshot
Minimising our
8 Improve nutrient, land and water 8.1 Exclusion of stock from waterways 73% 76% Indicator 5.3 90%
* 2014 data is the latest
available for this measure.
Indicator 8.2 46 % drop
waste
intensi
environmental footprint management Indicator 2.3 Consumer support Nutrient
Community recognition management plans
8.2 Nutrient management plans 30%
2020
58%(quality products) 80%
2020
2020
Baseline Target
Target Baseline Target 2015
71% 80%
8.3 Irrigation automation 2015
Performance 47% 78% 77%
54% 2015
Performance 80%
86%
Performance
58%
68% 77%
8.4 Managing land for conservation and biodiversity 47% 45% 80%
8.5 All dairy farmers actively — noxious weeds identified as major land issue 3 % drop in
recognition
37%
No improvement
29%ina quality
recognition of dairy as
product
Not relevant
Baseline
30%
28 % increase
in nutrient
managing noxious weeds where management
relevant — actively managing noxious weeds where a problem 28% 28% 100% plans
8.6 Recycle water on farm 50% 75% 100%
Indicator 3.2 Indicator 6.1a Indicator 10.1
9 Reduce the consumptive water intensity 9.1
of dairy manufacturers by 20%
Consumptive water intensity of dairy manufacturers (litres per litre of milk processed) 1.75 Rate
Long Term Injury Frequency
(dairy farmers)
1.58 Healthy diet
(good health)
1.40
2020
Baseline
Emissions from dairy
manufacturers
10 Reduce greenhouse gas emissions Target
10.1 Emissions from dairy manufacturers (tonnes of CO2 equivalent per ML milk processed) 178.7 152.5
Baseline
72% 2015
125.8
85% 178.7t CO2-e
per ML
intensity by 30% Performance
69% 2015
10.2 Farm emissions abatement actions 2014 Under review Under review Under review – Performance
152.5t CO2-e per ML 2020
Baseline Performance* Target
3
6.4
11
5.2 125.1t CO2-e
15
Reduce waste to landfill by 40% 11.1a Waste to landfill intensity of dairy manufacturers (tonnes of waste per ML milk processed) 2.69 1.45 % drop in 1.61 per ML
23
2020
Target consumer % drop in
% increase 3.6 perception GHG
11.1b Manufacturers: signatories to Australian Packaging Covenant (APC) in LTIFR 9 17 All manufacturers emissions
intensity
* Data is reported one year in arrears.
11.2 Farm level waste reduction Under review Under review Under review –
Understanding 2015 Performance
Indicator 4.2 Indicator 11.1a
improvement from last measurement no change from last measurement regression from last measurement * If no measurement in 2015, latest available shown Participation
ongoing target achieved in 2015 X ongoing target not achieved in 2015
in development Manufacturer
“Under review” indicates where an appropriate waste or target has yet to be established
baseline measure
(extension) to landfill
Baseline
2014 2.69t per ML
Enhancing livelihoods Improving wellbeing Reducing environmental impact Performance*
39% 2020
8
Target 2015
Baseline
30% Performance
20%
% increase in 1.45t per ML 2020
participation Target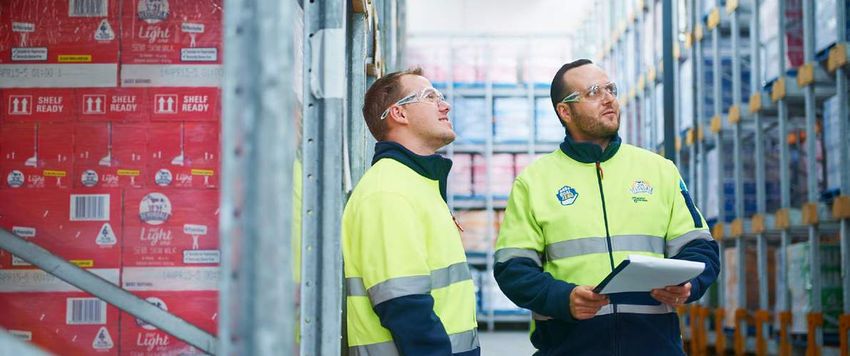
Section 1:
About our Industry, the
framework and this report

Enhancing livelihoods Improving wellbeing Reducing environmental impact   9
About our industry, the Framework
and this report
Despite such a large percentage our production
About the Australian dairy industry sent overseas, and being the fourth largest dairy
Through its farms and manufacturing sector, the exporting country, our exports comprise only 6% of
Australian dairy industry not only provides nutritious total world dairy trade exports.
food but is a significant contributor to the national
The Australian dairy farming system is predominantly
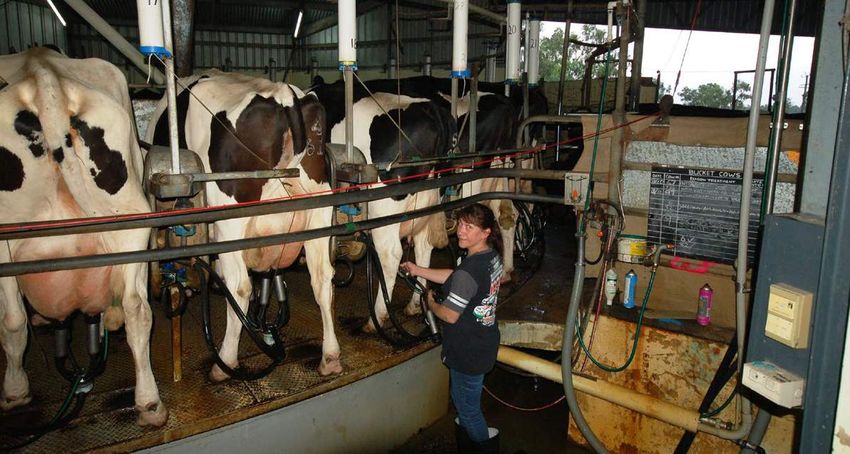
economy. pasture based. Cows produce 25–40 litres of
Despite challenges caused by low rainfall and milk each day. Dairy has many challenges — for
depressed global prices, the dairy industry remains example, our farms use water and energy, and other
Australia’s third-largest rural industry behind beef materials like fertiliser and feed, while generating
and wheat, with a farm-gate production value of effluent and greenhouse gas emissions.
$4.7 billion in 2014/15. Farms and manufacturing plants employ
Our 6200 farms (approximately 97% family owned) approximately 39,000 people directly and more than
produced 9.7 billion litres of milk in 2014/15, an 100,000 people indirectly through related services,
increase of 3.8% on the previous year1. However, including research and development, dairy transport
seasonal conditions and tight profit margins will and veterinary services.
see a likely 2% decrease in production in 2015/16, While most milk production occurs in the south-east
according to Dairy Australia. states of Australia, all states have dairy industries
Compared to our annual total of 9.7 billion litres that supply fresh drinking milk to nearby cities and
of milk, our neighbours in New Zealand produce towns. Much of the milk processing occurs close to
19 billion litres annually, while the USA produces farming areas, making the industry an important
93 billion litres. presence in regional communities, generating jobs
and opportunities.
Australians each drink around 105 litres of milk, eat
13.5kg of cheese, 4kg of butter and 7.2kg of yoghurt
per year2. Our milk production more than meets our See www.dairyaustralia.com.au/Home/Standard-
domestic consumption needs, and a large amount Items/~/media/Documents/Publications/Australian%20
of dairy produce is exported. Australian dairy has an Dairy%20Industry%20In%20Focus%202015.pdf
enviable international reputation, and 34% of our
annual production is exported, particularly to South
East Asia, Japan, China, Africa, the Middle East,
Mexico, and Russia.
1 Situation and Outlook, July 2015, Dairy Australia
2 Australian Dairy Industry in Focus, 2015
Enhancing livelihoods Improving wellbeing Reducing environmental impact 10About the Dairy Industry Sustainability Principles Informed by
Framework Ethical behaviour
The Australian Dairy Industry Sustainability Framework Transparency and
is owned and led by industry. The Framework accountability
was developed in 2012 and sets the direction for
Appreciation of stakeholder
continual improvement, providing guidance to interest
farmers, manufacturers and industry bodies on our
shared priorities and commitments. Competitive neutrality
‘not providing competitive
The Framework was developed to reflect the dairy advantage’
industry value chain considering feed production to
Collective action that
manufacturing, retail and packaging, export and delivers mutual benefit
consumption. The initial focus has been on the areas
Inclusivity
where dairy farmers and manufacturers have the
greatest impact and most direct control over the
issues and outcomes.
The Framework was deliberately crafted to evolve
over time — embracing change as projects are
implemented, progress is demonstrated, data
techniques are modified, or new issues arise. As Figure 1: A set of agreed principles helped identify
more research is developed and better metrics and prioritise issues and guide ongoing action and
become available, they will be incorporated into the decision-making
Framework.
The development of the initial Framework was Since the adoption of the Framework, a number
informed by a number of projects including: of global and national initiatives have been
• Mapping of existing industry programs developed. These have also influenced our ongoing
• A review of targets adopted by dairy industry approach, areas of interest and discussions with our
bodies in other countries stakeholders. These include the 17 United Nations
• Assessment of sustainability issues material to (UN) Sustainable Development Goals which have
the dairy sector unprecedented buy-in as a result of consultation
and negotiations involving all 193 UN member states,
• Identification of stakeholders and their interests. the private sector and civil society. The Goals outline
169 targets across areas including poverty reduction,
To view the Framework on line visit the Dairy
food security and energy and will directly influence
Australia website or visit www.sustainabledairyoz.com.au national policy settings.
(see www.un.org/sustainabledevelopment/
Principles and Guidance development-agenda)
The development of the Framework was informed The international dairy industry has established
by international guidelines and standards, including the Global Dairy Agenda for Action (GDAA)3
the United Nations Global Compact and the Global and developed the global Dairy Sustainability
Reporting Initiative (GRI) G4. Framework4. Dairy Australia is a full member of the
GDAA and the Australian Dairy Industry Sustainability
It was also guided by a set of agreed principles to Framework aligns with this global framework.
help identify and prioritise issues and guide ongoing
action and decision-making (see Figure 1).
These principles include an appreciation
of stakeholder interests which ensures that
stakeholders from across the dairy value chain are
engaged directly in the ongoing development of
the Framework.
3 The Global Dairy Agenda for Action. Available at:
http://dairysustainabilityframework.org/the-gdaa/background/
4 Dairy Sustainability Framework. Available at:
http://dairysustainabilityframework.org
Enhancing livelihoods Improving wellbeing Reducing environmental impact 11The GDAA was a vocal supporter of the United
Nations Sustainable Development Goals, released
September 2015 and the COP21 climate conference
held in Paris in December 2015. The United Nations ADIC
(approve)
Sustainable Development Goals provide a roadmap
for global development efforts to 2030 and beyond. Dairy
The UN made clear that dairy has an important role Sustainability
to play through the delivery of sustainable actions Steering Committee
(oversee implementation) Consultative
that address the climatic, economic and social Forum
aspects of food production. (inform and
recommend)
In Australia, the Australian Securities Exchange has
recently introduced recommendations for listed Secretariat
(support)
companies to improve disclosure on sustainability
risks. As of July 2015, all listed companies in Australia
must disclose more information on their social,
economic and environmental sustainability risks and
Figure 2: The governance model of the Australian Dairy
how they are managing those risks5. Industry Sustainability Framework
We will continue to monitor developments
in sustainability disclosure, particularly in the The Steering Committee seeks endorsement from the
agricultural or dairy industries at a local, national and ADIC on any major recommendations.
international level. We will draw upon the principles Representation and members of the Steering
and guidance that underpin these initiatives as they Committee are listed in the Appendix.
will influence the ongoing evolution of the Framework.
The Dairy Sustainability Consultative Forum was
Governance established in 2013. Consisting chiefly of non-industry
stakeholders, the Forum provides feedback on
The ADIC, the dairy industry’s peak policy body, has our progress and facilitates two-way discussion on
overall responsibility for the Framework — setting and emerging issues both nationally and internationally.
reporting progress against the Framework targets The Consultative Forum has two face to face
and performance measures (see Figure 2). Dairy meetings per year.
Australia, the industry-owned national service body,
facilitates and supports the ADIC in developing and The Framework has been developed through a
implementing the Framework. A Steering Committee continuous improvement process, seeking feedback
was established in 2012 to drive the ongoing and active forms of review.
development and implementation of the Framework. Figure 3 illustrates an approach to sustainability
The Steering Committee meets monthly and includes that progresses along a maturity path from legal
representatives from farmer organisations as well as compliance and initial measurement activities to
manufacturing companies. more strategic approaches in which sustainability
and business objectives are mutually reinforcing.
Our intention is to continue to evolve and develop
the Framework and its features as issues emerge
and progress is made. This will include improving
data collection and measurement techniques and
actively demonstrating performance improvements
as the Framework overall moves toward more
strategic industry-wide solutions.
5 Australian Securities Exchange (ASX), 2014. Available at:
www.asx.com.au/documents/asx-compliance/cgc-principles-and-
recommendations-3rd-edn.pdf
Enhancing livelihoods Improving wellbeing Reducing environmental impact 12Phase 1 Basic legal compliances
Phase 2 Issue determinations, measuring and
data collection
Phase 3 Demonstration of performance
and gains
Innovation
Phase 4 Strategic thinking — objectives,
6
setting targets, reporting
5 Phase 5 Strategic innovation — driving change
across business units and portfolios,
3 4 linking strategy and reporting
1 2 Phase 6 Long-term return — Business
performance and sustainability are
mutually reinforcing
Economic, environmental and social outcomes
Figure 3: The maturity path of a sustainability model
(Source: Modified from EPA Qld)
Defining report content Material6 issues are defined as those which reflect
our significant economic, environmental and social
This is our third annual Progress Report. It impacts and substantively influence the assessments
demonstrates our progress towards the goals and and decisions of our stakeholders.
targets of the Framework and where we need to
continue to do more. A review of material issues was first undertaken in
2011 to inform the development of the Framework.
Unless otherwise stated, the information in this This was informed by AccountAbility’s 5 part
report refers to the 2014/15 financial year. This materiality test7 which included reviews of:
report draws upon Standard Disclosures from the
GRI G4 Sustainability Reporting Guidelines and • Direct financial impacts (e.g. risk register)
these are identified in the GRI Content Index shown • Policy (e.g. stated commitments and policies
in the Appendix. active in the industry)
This year our report also demonstrates alignment • Peers and their positions on issues (e.g. Dairy UK)
with the UN Sustainable Development Goals. We • Societal norms (e.g. regulations)
have highlighted where the Australian dairy industry • Stakeholder concerns (both internal to the
either has an impact on a particular goal, such as industry and external)
combating climate change, or where it can actively
In preparing the 2014 progress report, a limited
contribute to the achievement of a goal, such as
review of material issues was repeated to test their
food security. The UN Sustainable Development
currency and relevance.
Goals and their associated targets will also be used
to provide guidance in the ongoing development of The review included a survey of global peers as well as
the Framework. a desktop media scan and analysis of Dairy Australia’s
media monitoring tools (e.g. Dairy Monitor)8.
Various research papers and surveys have been used
in the development of this report and appropriate A more comprehensive refresh of the material issues
references are provided. Some of these surveys are will be undertaken in 2016 to support the ongoing
not conducted on an annual basis and therefore evolution of the Framework and to inform the
updated data may not be available for this reporting content of the 2016 Progress Report.
period. In these instances, the most recent available
data has been reported. It should also be noted that
6 GRI G4 online. Available at: https://g4.globalreporting.org/how-
some percentages may not add up to 100%, as they you-should-report/reporting-principles/principles-for-defining-report-
are rounded to the nearest figure. content/materiality/Pages/default.aspx
7 AccountAbility, 2003. Available at: http://www.accountability.org/
images/content/0/8/085/Redefining%20Materiality%20-%20Full%20
Determining the issues Report.pdf
Defining and prioritising the material sustainability 8 For more information on the methodology and results of materiality
determinations to date see the Australian Dairy Industry Sustainability
issues to include in our Framework and progress Framework 2012, Australian Dairy Industry Sustainability Progress
reports is critical to supporting our ongoing strategic Report 2013 and Australian Dairy Industry Sustainability Progress
Report 2014. Available at: www.dairyaustralia.com.au/Industry-
approach to sustainability. information/Sustainability/Industry-sustainability.aspx
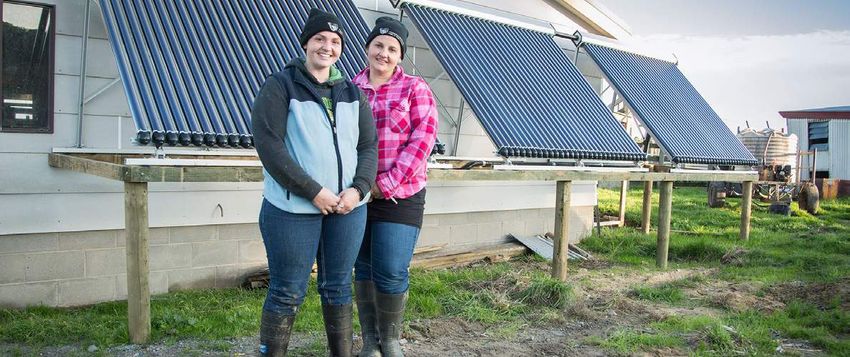
Enhancing livelihoods Improving wellbeing Reducing environmental impact 13Engaging stakeholders • Direct interviews of 12 stakeholders on the
current priorities of the Framework, our progress
to date and consultation activities as well as
emerging issues and their nature. The interviews
provided a vehicle for more in depth and richer
discussions with specific stakeholder groups.
• A visit to a major dairy farm and Devondale
Murray Goulburn’s new Sydney manufacturing
facility.
The results of the stakeholder engagement
undertaken this year confirmed the relevance of the
existing themes and objectives of the Framework.
It also raised some new issues, trends and points
of emphasis for consideration in the ongoing
development of the Framework and our progress
reporting which will be monitored and addressed in
Stakeholders took part in two Consultative Forums during 2015. coming review cycles. Specifically:
• Transparency and traceability. Global
The dairy industry engages stakeholders through a and domestic customers have increasing
variety of mechanisms. expectations of both transparency (open and
The stakeholder groups engaged in the Framework frank communication) and traceability (with
itself were identified through a mapping exercise: evidence to demonstrate this) in the sector.
customers, suppliers, government, primary • Intensification of farming systems. Some
industries, non-government groups, special interest stakeholders are uncertain of impacts and
groups and others. opportunities arising from the increasing
Stakeholders, their interests and our engagement intensification of farms, specifically animal
mechanisms are outlined in Table 1. welfare, resource efficiencies and responses to
climate variability.
In preparation for the 2015 Progress report, material
• Labour practices, worker health and safety.
issues were refined through extensive stakeholder
While attraction and retention are ongoing
engagement. The Framework, and its associated
issues, there is increasing focus on labour
progress reporting, continue to be developed
practices in supply chains. Ensuring the fair
through discussions with multiple stakeholders.
treatment of all workers, including workers
The Steering Committee and Consultative Forum are on 417 visas, in a safe and dignified work
both expressions of this approach. environment will be an issue for further
discussion as will mental health.
In the past 12 months, specific stakeholder
engagement activities were pursued to test, prioritise • Animal husbandry and welfare. As an industry
and understand the concerns already raised as well which depends on animals, the dairy sector
as identify emerging issues. needs to know more about community
expectations regarding the health and well-
This included: being of cows.
• A survey of Consultative Forum members • Community resilience. The dairy industry
regarding the content and quality of the depends on viable rural communities and
Australian Dairy Industry Sustainability contributes actively to local economies.
Progress Report, 2014. The survey provided Understanding the relationship between
some initial responses to the ranking of issues the industry and the communities in which
and feedback to improve the quality and it operates, the value it brings and how
relevance of reporting. communities respond to change all require
• Two meetings of the Consultative Forum. Among further exploration through the Framework and
other things, these meetings were used to review its ongoing development.
the 2014 Progress Report and discuss the nature
of emerging issues and trends in the sector.
Enhancing livelihoods Improving wellbeing Reducing environmental impact 14• Climate change. The Framework to date • Food waste. The challenge of food security
has focused on carbon mitigation efforts requires a reduction in the generation of food
by manufacturers. The impacts of climate waste across the dairy value chain. Wasted
change itself through the value chain food also represents significant resource waste
and adaptation responses will also require in the form of the energy, water and materials
increasing attention. used to produce it.
Stakeholder group Stakeholders Interests and concerns Engagement
Pressure on-farm milk prices; labour practices; bobby
Customers Retailers calves; responsible sourcing; household incomes in
Australia set to drop in next five years.
Industry capacity (people) — successional planning,
education; environmental, including waste management,
Suppliers Banking
water efficiency; rural -urban divide; health and wellbeing
(mental health).
2
Consultative
State and Federal Forum (CF) meetings
Land health — soils (nutrient efficiency, soil constraints,
Government Government per year
soil moisture).
Department
CF
meeting reports
Community Dairy’s non-financial contribution to regional
NGOs
development communities. 12
meetings with
individual
stakeholders
Climate change — must be discussed in terms of adaptation.
Representative Biosecurity — need to raise profile and on-farm adoption.
Primary Industry
groups Framework needs targeted communications: snapshot for Visit
consumers; in-depth reporting for better informed. to farm and
manufacturing
facility
Bobby calves; lameness; downer cows; mastitis;
Special interest Animal welfare
induction; intensification.
Health of farmers; animal welfare debate will grow —
Regional is dairy ready; social inclusivity — cultural diversity
Other
development in supply chain could present challenges for some
Australians; profitability of dairy farms.
Table 1: Stakeholders, their interests and our engagement mechanisms
Enhancing livelihoods Improving wellbeing Reducing environmental impact 15Issues across our value chain This year we have shown the dairy value chain with
the Framework’s major targets plotted where we
In order to explore the significant issues that have the
believe the issues to be most material. Inputs through
potential to affect the Australian dairy industry and
the value chain include water, hay, grain and fertiliser
its stakeholders, we have started developing a value
on farm, and logistics, ingredients, packaging,
chain map for the sector (see Figure 4).
energy and water in the manufacturing sector.
While many issues go well beyond the immediate
control of the dairy value chain, others resonate
strongly in several key places along the value chain
and this is where they need to be addressed.
Australian Dairy Industry value chain
1 2 3 4 1 2 3 4 1 2 3 4 1 2 3 4 1 2 3 4 1 2 3 4
5 6 7 5 6 7 5 6 7 5 6 7 5 6 7 5 6 7
8 9 10 11 8 9 10 11 8 9 10 11 8 9 10 11 8 9 10 11 8 9 10 11
1 Creating industry prosperity
5 All dairy products and ingredients sold
are safe 8 Improve nutrient, land and water
management
2 Increase the resilience and prosperity
of dairy communities 6 Dairy contributes to improved health
outcomes for Australian communities 9 Reduce the consumptive water intensity
of dairy manufacturers by 20%
3 Provide a safe work environment for all
dairy workers 7 Provide best care for all animals
10 Reduce greenhouse gas emissions
intensity by 30%
4 Attract, develop and retain a skilled and
motivated dairy workforce 11 Reduce waste to landfill by 40%
Figure 4: Sustainability Framework targets plotted against Australian Dairy Industry value chain map
Enhancing livelihoods Improving wellbeing Reducing environmental impact 16Industry snapshot
From Dairy Australia’s Australian Dairy Industry in Focus 2015:
size milk production export industry
National dairy herd Dairy industry workforce —
1.74
Total milk production direct employment of about
million cows 9.731
34%
34 %
39,000
Percentage of milk
billion litres production exported
284
Average herd size
cows
3%
Average production Total Australian exports
97 % vs
3 % 97%
environment
On-farm carbon footprint:
5730 $2.88 billion Dairy farms are 97% family owned
and operated and corporate
farms comprise 3% of farms
Family owned farms
1.11
Corporate farms
kg CO2 litres/ (6% of world dairy trade)
per litre of milk produced Share farming
18%
is employed on
approximately 18%
major markets of farms
Farms are predominantly pasture
milk utilisation
based with approximately
70–75% of dairy cattle feed
requirements coming from
grazing in a year of ‘normal’
Cheese 31%
Skim milk powder/butter milk powder 27%
Drinking milk 25%
for Australian dairy products:
18 %
seasonal conditions Other products 9%
Whole milk powder 8%
Supplementary feeding is
widespread, predominantly 9%
8%
31%
Drinking milk
$13.5 billion
grains, hay %
25
Australian dairy a $13.5b
25%
farm, manufacturing and
& silage 27%
Australia; Greater China; Japan; Singapore;
Indonesia; Malaysia
export industry
Enhancing livelihoods Improving wellbeing Reducing environmental impact 17Section 2: Detailed discussion on 2015 Progress Enhancing livelihoods Improving wellbeing Reducing environmental impact 18
Target
Target 1: Increase the future competitiveness and profitability of the
Australian dairy industry                                                                                               1

Enhancing livelihoods
Priority area 1: Creating industry prosperity
Target 1: Increase the future competitiveness and profitability of the
Australian dairy industry

Despite the many challenges, the dairy industry remains            international market is yet to recover as the supply
Australia’s third- largest rural industry behind beef and wheat,   and demand imbalance continues9.
with a farm-gate production value of more than $4 billion.
                                                                   2015 saw significant policy changes to improve
OUR STORY IN BRIEF                                                 the long-term competitiveness of the industry. The
                                                                   signing and coming into force of the China-Australia
Australian dairy performs in tough global                          Free Trade Agreement is a particularly significant
conditions                                                         achievement following a concerted industry effort to
The more stable returns for dairy products generated               promote a commercially meaningful result.
by the Australian domestic market, together with                   Despite the downturn in prices, farmer confidence
a diverse range of export markets and products,                    remains firm. The National Dairy Farmer Survey (NDFS
has helped cushion the industry through an                         2015)10 showed 20% of farmers were predicting an
internationally volatile 2014/15. Australian dairy                 improvement in farm business returns whilst 40%
farmers received some of the highest milk prices on                anticipate no change. However, the increasing
record in 2014. However, China’s oversupply issues,                dry conditions are impacting on farm input costs
Russian trade sanctions and a sharp increase in                    (water and feed) and this is likely to be reflected in
global supply had a negative effect on farmgate                    reduced confidence in 2016 and potentially lower
prices across the world.                                           milk production.
The 2015 financial year finished with softer
milk prices globally, but the Australian dairy                     9   Dairy Situation and Outlook 2015: www.dairyaustralia.com.au/~/
manufacturing sector maintained milk prices for                        media/Documents/Stats%20and%20markets/S%20and%20O/S%20
                                                                       and%20O%20October%202015/October%202015%20Dairy%20
farmers relative to other dairy trading nations.                       Situation%20and%20Outlook.pdf
Although global dairy commodity prices have                        10 NDFS 2015 www.dairyaustralia.com.au/Markets-and-statistics/Market-
increased from their recent extreme lows, the                         situation-and-outlook/National-Dairy-Farmer-Survey.aspx

Enhancing livelihoods                                                                                                                   19
Target
Target 1: Increase the future competitiveness and profitability of the
Australian dairy industry 1
After solid farm production growth of 3.8% in 2014/15 The private sector has also begun to position itself
(to a total of 9.7 billion litres), Dairy Australia’s initial for opportunities in both local and international
forecast was for a 2% increase in national production markets. Over the last two financial years, processors
for 2015/16, within a range of 9.8 to 10 billion litres11. have invested an estimated $1billion and there
However, this is likely to be revised to a 2% decrease is a further estimated $1billion on the horizon for
due to seasonal conditions and tight margins. upgrading and expanding capacity. There has
also been significant investment in the farm sector
Despite the many challenges, the dairy industry
during the past 18 months from groups such as
remains Australia’s third largest rural industry behind
Bestons, Leppington Pastoral, Camperdown Dairy
beef and wheat, with a farm-gate production value
International and ACE Farming.
of more than $4 billion.
11 Dairy Situation and Outlook 2015: www.dairyaustralia.com.au/~/
media/Documents/Stats%20and%20markets/S%20and%20O/S%20
and%20O%20October%202015/October%202015%20Dairy%20
Situation%20and%20Outlook.pdf
SUSTAINABLE DEVELOPMENT GOALS 8.2 Achieve higher levels of economic productivity
through diversification, technological upgrading and
The Australian dairy industry is aware innovation, including through a focus on high-value
of the role it can play in contributing added and labour-intensive sectors.
to global sustainability frameworks and
activities. With the recent agreement and 8.3 Promote development-oriented policies that
release of the United Nations Sustainable support productive activities, decent job creation,
Development Goals and the COP21 entrepreneurship, creativity and innovation, and
meetings in Paris, the global dairy sector, encourage the formalisation and growth of micro-,
aligned through the Global Dairy Agenda small- and medium-sized enterprises, including
for Action, is engaging on a global level. through access to financial services.
The Australian Dairy Industry’s Sustainability
Framework reflects a strong alignment with
these global activities, and the principles
and targets of specific Sustainable
Development Goals:
HOW WE’RE TRACKING
Target 1: INCREASE THE FUTURE COMPETITIVENESS AND PROFITABILITY OF THE AUSTRALIAN DAIRY INDUSTRY
Performance
Indicator Baseline 2020 Target
2015 Progress
1.1 % Profitable farms (rolling 3 year average) 55% 42% î Under review
1.2 Market preference Under review Under review Under review
1.3 Market access Under review Under review Under review
1.4 % of farmers planning capital investment 40% 52% ì Under review
1.5 Product diversity Under review Under review Under review
Understanding 2015 Performance
ì improvement on baseline towards target è no improvement towards target î regression baseline to target
* no measurement in 2015 (latest available shown) ✔ ongoing target achieved in 2015 × ongoing target not achieved in 2015
"Under review" indicates where an appropriate baseline measure or target has yet to be established
Enhancing livelihoods 20Target
Target 1: Increase the future competitiveness and profitability of the
Australian dairy industry 1
Baselines, targets: a work in progress 2014 performance measure: In 2013/14, 52%
of farmers had a positive farm business profits
The Framework outlines five performance measures
(ABARES). This compares with the ABARES
of industry competitiveness and profitability that are
adjusted figure of 35% in 2012/13, 64% in 2011/12
in various stages of evolution:
and 65% in 2010/11. The baseline measure
• Farm profitability agreed was profitability based on a three year
• Market preference rolling average using ABARES data. Based on
• Market access the ABARES adjusted 2011 to 2014 data, 51% of
farmers had a positive farm business profit.
• Capital investment
• Product diversity 2015 performance measure: In 2014/15, 39%
of farmers had a positive farm business profit
Our intention is to continue to develop measures (ABARES). This compares with the ABARES
that provide meaningful data and drive culture and adjusted figures of 52% in 2013/14, 35% in
practice change in the industry. 2012/13 and 64% in 2011/12. Based on the 2012
1.1 X% increase in the number of dairy farms that to 2015 data, 42% of farmers had a positive
are profitable farm business profit (ABARES)14,15.
In previous reports, we have used the Australian The NDFS 2015 showed that 79% of farmers
Bureau of Agricultural and Resource Economics surveyed expected to make an operating profit
and Science (ABARES) data as the baseline to in 2014/15 and 82% of respondents made an
reflect progress against the target. The ABARES operating profit in 2013/14.
data is based on dairy industry selected physical
1.2 X% increase in the market preference for
and financial estimates, by state. Whilst this was
buying Australian dairy products, compared
deemed to be the most appropriate measure
with our top 3 international competitors (NZ, EU
at the time, it has become increasingly clear
and US)
that the percentage increase in the number
of profitable dairy farms on its own is not a Performance measure: Still to be established —
particularly useful measure. A complete picture will be reviewed in 2016.
is not possible with one single parameter. 1.3 Ensuring sustainability criteria (e.g. carbon,
Ultimately, profitability should be assessed in animal welfare, environmental impact) do not
terms of cash, profit and wealth12. impede market access
In the short-term we will continue to use the Performance measure: Still to be established —
ABARES data (as it is still a good indicator of will be reviewed in 2016.
trend) until the newly launched DairyBase 1.4 Increase adoption of new technologies and
program provides sufficient data to better innovative management practices within the
reflect profitability on dairy farms. We have also dairy industry
included a metric based on the findings from the
Baseline performance measure: For farm: 40%
National Dairy Farmers Survey (NDFS) 2015 where
of dairy farmers reported they were planning
farmers were asked directly if they made an
capital investments in the next 12 months (NDFS
operating profit in the previous year, and if they
2013). For manufacturers: To be established.
expect to make a profit in the following year.
The data source for this measure will continue
to evolve as we endeavor to develop a more
meaningful measure of profitability.
Baseline performance measure: 55% of dairy
farms were profitable based on a three-year
rolling average to 2012/13 (ABARES)13. 14 As above.
15 Note: the three year rolling average is calculated using the most
recent ABARES estimates (available at the time of the report
12 Farm Profitability Report 2015, p. 7. Available at: www. preparation) on reported farm profitability for the latest three
australiandairyfarmers.com.au/PDF/Farm-profitability-Report-2015- financial years. ABARES estimates for the most recent two years
Final.pdf, www.dairyaustralia.com.au/Home/Standard-Items/~/ (FY2014 and FY2015) are provisional and preliminary and are
media/Documents/Farm-Business-management/Sustainable%20 expected to be both refined and finalised in subsequent years.
farm%20profitability%20report/Farm-profitability-Report-2015-Final.pdf Similarly, ABARES estimates reported as performance measures in
13 ABARES, 2015. Dairy industry selected physical and financial past Progress Reports have also changed, and amendments to
estimates, by state. Available at: www.agriculture.gov.au/ prior years estimates and rolling averages due to these updates are
SiteCollectionDocuments/abares/surveys/dairy-by-state.xls included here.
Enhancing livelihoods 21You can also read