Building disaster-resilient communities and economies
←
→
Page content transcription
If your browser does not render page correctly, please read the page content below

PSI
                                                                                  Principles
                                                                                  for Sustainable
                                                                                  Insurance

  The PSI
   Global
Resilience
   Project
                                               Building
                                               disaster-resilient
                                               communities
                                               and economies
                                               Part one of a research series by the
                                               UNEP FI Principles for Sustainable Insurance Initiative

 The PSI Global Resilience Project is led by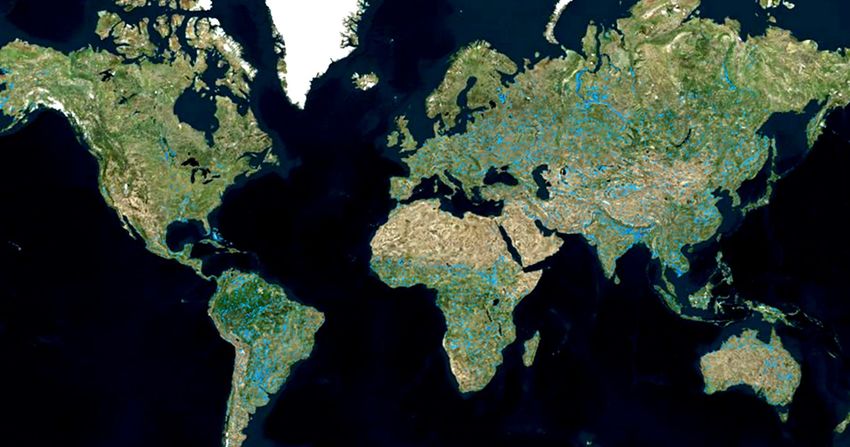
The PSI Global Resilience Project

This research paper was produced in collaboration with

Published by UNEP Finance Initiative in June 2014
Copyright © United Nations Environment Programme, 2014

This publication may be reproduced in whole or in part and in
any form for educational or non-profit purposes without special
permission from the copyright holder, provided acknowledgement
of the source is made. UNEP would appreciate receiving a copy
of any publication that uses this publication as a source.
No use of this publication may be made for resale or for any other
commercial purpose whatsoever without prior permission in writing
from the United Nations Environment Programme.

Disclaimer — The designations employed and the presentation of
the material in this publication do not imply the expression of any
opinion whatsoever on the part of the United Nations Environment
Programme concerning the legal status of any country, territory, city
or area or of its authorities, or concerning delimitation of its frontiers
or boundaries. Moreover, the views expressed do not necessarily
represent the decision or the stated policy of the United Nations
Environment Programme, nor does citing of trade names or
commercial processes constitute endorsement.

UNEP Finance Initiative
International Environment House
15 Chemin des Anémones
1219 Châtelaine, Geneva
Switzerland
T: +41 22 917 8777
psi@unepfi.org
www.unepfi.org/psi

Design: Rebus, Paris
www.rebusparis.com

UNEP promotes environmentally
sound practices globally and in its
own activities. UNEP policy is to specify
vegetable-based printing inks and
chlorine-free paper using recycled fibre
and wood pulp from sustainable forests.
Our distribution practices aim to reduce
UNEP’s carbon footprint.

                                                                             2
Building disaster-resilient communities and economies

Contents

The Principles for Sustainable Insurance Initiative .  .  .  .  .  .  .  .  .  .  .  .  .  .  .  .  .  .  .  .  .  .  .  .  .  .  .  .  .  .  .  . 5
                      The UNEP FI Principles for Sustainable Insurance Initiative (PSI Initiative) .  .  .  .  .  .  .  .  .  .  . 5
                      The Principles for Sustainable Insurance  .  .  .  .  .  .  .  .  .  .  .  .  .  .  .  .  .  .  .  .  .  .  .  .  .  .  . 5

Executive summary  .  .  .  .  .  .  .  .  .  .  .  .  .  .  .  .  .  .  .  .  .  .  .  .  .  .  .  .  .  .  .  .  .  .  .  .  .  .  .  .  .  .  .  .  .  .  .  .  .     6
                     The need for building resilience .  .  .  .  .  .  .  .  .  .  .  .  .  .  .  .  .  .  .  .  .  .  .  .  .  .  .  .  .  .  .  .                     6
                     How the PSI Initiative is responding to disaster risk .  .  .  .  .  .  .  .  .  .  .  .  .  .  .  .  .  .  .  .  .  .                              6
                     About this report  .  .  .  .  .  .  .  .  .  .  .  .  .  .  .  .  .  .  .  .  .  .  .  .  .  .  .  .  .  .  .  .  .  .  .  .  .  .  .              7
                     Research outcomes  .  .  .  .  .  .  .  .  .  .  .  .  .  .  .  .  .  .  .  .  .  .  .  .  .  .  .  .  .  .  .  .  .  .  .  .  .                    7
                     Impediments to effective disaster risk reduction  .  .  .  .  .  .  .  .  .  .  .  .  .  .  .  .  .  .  .  .  .  .  .                               8
                     The need for a portfolio approach  .  .  .  .  .  .  .  .  .  .  .  .  .  .  .  .  .  .  .  .  .  .  .  .  .  .  .  .  .  .                         9
                     Disasters, climate change and development .  .  .  .  .  .  .  .  .  .  .  .  .  .  .  .  .  .  .  .  .  .  .  .  .                                 9

Introduction  .  .  .  .  .  .  .  .  .  .  .  .  .  .  .  .  .  .  .  .  .  .  .  .  .  .  .  .  .  .  .  .  .  .  .  .  .  .  .  .  .  .  .  .  .  .  .  .  .  .  .  . 10
                             Disaster risk management – A continuum of activity  .  .  .  .  .  .  .  .  .  .  .  .  .  .  .  .  .  .  .  . 10
                             The role of insurers in disaster risk management  .  .  .  .  .  .  .  .  .  .  .  .  .  .  .  .  .  .  .  .  .  .  10
                             Disaster risk reduction – A better way .  .  .  .  .  .  .  .  .  .  .  .  .  .  .  .  .  .  .  .  .  .  .  .  .  .  .  .  11
                             The Post-2015 Framework for Disaster Risk Reduction – A major opportunity .  .  .  .  .  .  . 12

Data issues and research methodology .  .  .  .  .  .  .  .  .  .  .  .  .  .  .  .  .  .  .  .  .  .  .  .  .  .  .  .  .  .  .  .  .  .  .  .  .  13
                     Data issues .  .  .  .  .  .  .  .  .  .  .  .  .  .  .  .  .  .  .  .  .  .  .  .  .  .  .  .  .  .  .  .  .  .  .  .  .  .  .  .  .  13
                     Research methodology .  .  .  .  .  .  .  .  .  .  .  .  .  .  .  .  .  .  .  .  .  .  .  .  .  .  .  .  .  .  .  .  .  .  .  14

Risk reduction measures – Overview .  .  .  .  .  .  .  .  .  .  .  .  .  .  .  .  .  .  .  .  .  .  .  .  .  .  .  .  .  .  .  .  .  .  .  .  .  . 17
                    Key initiatives – Benefits and costs  .  .  .  .  .  .  .  .  .  .  .  .  .  .  .  .  .  .  .  .  .  .  .  .  .  .  .  .  .  17

Multi-hazard risk reduction measures – Cyclone, earthquake and flood  .  .  .  .  .  .  .  .  .  .  .  .  .  .  .  .  .  . 20
                     Risk mapping .  .  .  .  .  .  .  .  .  .  .  .  .  .  .  .  .  .  .  .  .  .  .  .  .  .  .  .  .  .  .  .  .  .  .  .  .  .  .  .  20
                     Education and communication  .  .  .  .  .  .  .  .  .  .  .  .  .  .  .  .  .  .  .  .  .  .  .  .  .  .  .  .  .  .  .  21
                     Emergency evacuation  .  .  .  .  .  .  .  .  .  .  .  .  .  .  .  .  .  .  .  .  .  .  .  .  .  .  .  .  .  .  .  .  .  .  .  24

Cyclone risk reduction measures .  .  .  .  .  .  .  .  .  .  .  .  .  .  .  .  .  .  .  .  .  .  .  .  .  .  .  .  .  .  .  .  .  .  .  .  .  .  .  . 25
                     Mangroves .  .  .  .  .  .  .  .  .  .  .  .  .  .  .  .  .  .  .  .  .  .  .  .  .  .  .  .  .  .  .  .  .  .  .  .  .  .  .  .  . 27
                     Coastal sand dunes .  .  .  .  .  .  .  .  .  .  .  .  .  .  .  .  .  .  .  .  .  .  .  .  .  .  .  .  .  .  .  .  .  .  .  .  .  29
                     Cyclone shelters  .  .  .  .  .  .  .  .  .  .  .  .  .  .  .  .  .  .  .  .  .  .  .  .  .  .  .  .  .  .  .  .  .  .  .  .  .  . 30
                     Early warning system .  .  .  .  .  .  .  .  .  .  .  .  .  .  .  .  .  .  .  .  .  .  .  .  .  .  .  .  .  .  .  .  .  .  .  .  31
                     Prediction .  .  .  .  .  .  .  .  .  .  .  .  .  .  .  .  .  .  .  .  .  .  .  .  .  .  .  .  .  .  .  .  .  .  .  .  .  .  .  .  .  .  33
                     Building codes .  .  .  .  .  .  .  .  .  .  .  .  .  .  .  .  .  .  .  .  .  .  .  .  .  .  .  .  .  .  .  .  .  .  .  .  .  .  . 34
                     Seawalls  .  .  .  .  .  .  .  .  .  .  .  .  .  .  .  .  .  .  .  .  .  .  .  .  .  .  .  .  .  .  .  .  .  .  .  .  .  .  .  .  .  . 35

                                                                                    3
The PSI Global Resilience Project
Earthquake risk reduction measures . . . . . . . . . . . . . . . . . . . . . . . . . . . . . . . . . . . . . . 37
Relocation . . . . . . . . . . . . . . . . . . . . . . . . . . . . . . . . . . . . . . . . . 39
Earthquake prediction . . . . . . . . . . . . . . . . . . . . . . . . . . . . . . . . . . . 40
Tsunami warning systems . . . . . . . . . . . . . . . . . . . . . . . . . . . . . . . . . . 41
Soil assessment . . . . . . . . . . . . . . . . . . . . . . . . . . . . . . . . . . . . . . 42
Building codes . . . . . . . . . . . . . . . . . . . . . . . . . . . . . . . . . . . . . . . 43
Retrofitting . . . . . . . . . . . . . . . . . . . . . . . . . . . . . . . . . . . . . . . . . 45
A word on ecosystems . . . . . . . . . . . . . . . . . . . . . . . . . . . . . . . . . . . 46
Flood risk reduction measures . . . . . . . . . . . . . . . . . . . . . . . . . . . . . . . . . . . . . . . . . . 47
Strategies for water control . . . . . . . . . . . . . . . . . . . . . . . . . . . . . . . . . 49
Permanent barrier . . . . . . . . . . . . . . . . . . . . . . . . . . . . . . . . . . . . . . 51
Controlled barrier . . . . . . . . . . . . . . . . . . . . . . . . . . . . . . . . . . . . . . 53
Temporary barrier . . . . . . . . . . . . . . . . . . . . . . . . . . . . . . . . . . . . . 54
Wetlands . . . . . . . . . . . . . . . . . . . . . . . . . . . . . . . . . . . . . . . . . . 55
Revegetation/Reforestation . . . . . . . . . . . . . . . . . . . . . . . . . . . . . . . . . 57
River modification . . . . . . . . . . . . . . . . . . . . . . . . . . . . . . . . . . . . . 58
Conveyance . . . . . . . . . . . . . . . . . . . . . . . . . . . . . . . . . . . . . . . . . 59
Basin storage . . . . . . . . . . . . . . . . . . . . . . . . . . . . . . . . . . . . . . . 60
Relocation . . . . . . . . . . . . . . . . . . . . . . . . . . . . . . . . . . . . . . . . . 61
Warning system . . . . . . . . . . . . . . . . . . . . . . . . . . . . . . . . . . . . . . . 62
Land-use planning . . . . . . . . . . . . . . . . . . . . . . . . . . . . . . . . . . . . . 63
Conclusion and next steps . . . . . . . . . . . . . . . . . . . . . . . . . . . . . . . . . . . . . . . . . . . . 65
Acknowledgements . . . . . . . . . . . . . . . . . . . . . . . . . . . . . . . . . . . . . . . . . . . . . . . . 66
References . . . . . . . . . . . . . . . . . . . . . . . . . . . . . . . . . . . . . . . . . . . . . . . . . . . . . 68
4Building disaster-resilient communities and economies
The UNEP FI Principles for Sustainable
Insurance Initiative (PSI Initiative)
Launched at the 2012 UN Conference on Sustainable Development, the UNEP FI Principles
for Sustainable Insurance serve as a global framework for the insurance industry to address
environmental, social and governance risks and opportunities.
Endorsed by the UN Secretary-General, the Principles have led to the largest collaborative
initiative between the UN and the insurance industry—the PSI Initiative. As of June 2014, 70
organisations have adopted the Principles, including insurers representing approximately 15%
of world premium volume and USD 8 trillion in assets under management. The Principles
are part of the insurance industry criteria of the Dow Jones Sustainability Indices and
FTSE4Good.
The vision of the PSI Initiative is of a risk aware world, where the insurance industry is
trusted and plays its full role in enabling a healthy, safe, resilient and sustainable society. The
purpose of the PSI Initiative is to better understand, prevent and reduce environmental, social
and governance risks, and better manage opportunities to provide quality and reliable risk
protection.
‘The Principles for Sustainable Insurance provide a global roadmap to develop and expand the innovative
risk management and insurance solutions that we need to promote renewable energy, clean water, food
security, sustainable cities and disaster-resilient communities.’
Ban Ki-moon, UN Secretary-General
The Principles for Sustainable Insurance
Principle 1 We will embed in our decision-making environmental, social and governance issues
relevant to our insurance business.
Principle 2 We will work together with our clients and business partners to raise awareness of
environmental, social and governance issues, manage risk and develop solutions.
Principle 3 We will work together with governments, regulators and other key stakeholders to promote
widespread action across society on environmental, social and governance issues.
Principle 4 We will demonstrate accountability and transparency in regularly disclosing publicly
our progress in implementing the Principles.
‘The Principles for Sustainable Insurance are a foundation upon which the insurance industry and society
as a whole can build a stronger relationship—one that puts sustainability at the heart of risk management in
pursuit of a more forward-looking and better managed world.’
Achim Steiner, UNEP Executive Director & UN Under-Secretary-General
5The PSI Global Resilience Project
Executive summary
The need for building resilience
Natural hazards have the potential to devastate communities and economies around the
world. Natural hazards are inevitable, but not natural disasters. When a natural hazard occurs,
it is the collective societal resilience that will determine whether that event results in a natural
disaster.
This century, more than one million people have lost their lives to natural disasters.1 Last year
alone around 20,000 people were killed or went missing in natural disasters, the majority in
storms, floods and other severe weather events.
The impact of natural disasters can reverberate long after the event itself—global economic
losses due to natural disasters in 2013 amounted to USD 131 billion, which represents almost
2% of GDP.2
The costs of recovery from these natural disasters—borne by governments, NGOs, business
and communities—consume scarce public and private resources which could otherwise
be used to develop social, economic and natural capital. Much of this can be prevented by
building disaster-resilient communities and economies. Reducing disaster risk before an event
can have a direct impact on how well, and how quickly, communities recover.
Across many nations, there is a funding imbalance between investing in pre-disaster
resilience and paying the costs of post-disaster relief and recovery. Investment in building up-
front resilience and hazard preparedness provides a positive return and reduces the need for
recovery. It is estimated that every dollar spent in disaster risk reduction returns between two
and ten dollars in recovery savings.3, 4, 5, 6
Building resilience to natural hazards requires an awareness of risk, a commitment by
all stakeholders to make change happen, and a structured approach to funding and
implementing effective measures for disaster risk reduction.
How the PSI Initiative is responding to disaster risk
In response to this global sustainability issue, the PSI Initiative embarked on the PSI
Global Resilience Project. Led by Insurance Australia Group, this project aims to
deepen understanding of disaster risk reduction globally, assess the social, economic
and environmental cost of disasters, and use this information to help governments and
communities around the world manage risk.
1 International Federation of Red Cross and Red Crescent Societies, World Disaster Report 2013. www.ifrc.org/wdr2013
2 Swiss Re Sigma report: http://media.swissre.com/documents/sigma1_2014_en.pdf
3 World Bank 2014 World Development Report: http://econ.worldbank.org/WBSITE/EXTERNAL/EXTDEC/EXTRESEARCH/EXTWDRS/EXTNWDR201
3/0,,contentMDK:23459971~pagePK:8261309~piPK:8258028~theSitePK:8258025,00.html
4 International Federation of Red Cross and Red Crescent Societies: https://www.ifrc.org/Global/global-alliance-reduction.pdf
5 Federal Emergency Management Agency: http://www.floods.org/PDF/MMC_Volume1_FindingsConclusionsRecommendations.pdf
6 Deloitte Access Economics: Australia, ‘Building our Nation’s Resilience to Natural Disasters’ 2013
6Building disaster-resilient communities and economies
The PSI Global Resilience Project is taking a phased approach to helping build more disaster-
resilient communities and economies:
l The first phase evaluates the effectiveness of risk reduction measures (the subject of this
report).
l The second phase will develop a global disaster map which can be used to identify the
most vulnerable communities, and the risk reduction measures which can offer them the
greatest protection.
l The third phase will focus on mentoring at-risk communities, supporting governments and
the private sector in investing in pre-disaster resilience and in implementing risk reduction
measures.
About this report
This report aims to assess the effectiveness of risk reduction measures and determine what
factors drive success and present obstacles.
There is a wealth of data and information available on risk reduction measures and their
effectiveness7—this report considered over 300 sources including academic papers,
government and scientific reports, case studies and media articles.
However, the research found the information to be often inconsistent and difficult to
compare, presenting a challenge to drawing meaningful insights on the effectiveness of
each risk reduction measure. For data to be useful on a global scale, it must be consistent,
standardised and globally accepted.
This report aggregates and synthesises a pool of existing information on risk reduction.
It applies consistent criteria, allowing comparison of the findings of a wide range of research,
and making the information accessible and usable. This is particularly important for audiences
which need sound evidence to drive risk reduction investment, such as businesses and
governments.
This report is neither an academic nor a scientific analysis of risk reduction measures.
The objective is to suggest a practical approach to reducing disaster risk and highlight the
areas of opportunity.
With its collective experience in disaster risk management, the PSI Initiative, and the
insurance industry generally, is well placed to engage collaboratively with other stakeholders
to promote deeper understanding of risk and drive better outcomes.
Research outcomes
This report focuses on the three most common and costly natural hazards—cyclone,
earthquake and flood.8 It analyses measures which can reduce the risk of social and
economic loss from each hazard.
7 The PSI Initiative commends the work of the UN Office for Disaster Risk Reduction in providing a global portal for disaster risk information and
connecting the disaster risk reduction community. See http://www.preventionweb.net/english/
8 From 1970 to 2012, the natural hazards that have created the most devastation globally are cyclone, earthquake and flood. These three natural
hazards accounted for 67% of deaths, 64% of persons affected, and 80% of economic damage of natural disasters worldwide: Center for Research
on the Epidemiology of Disasters, EM-DAT, http://www.emdat.be/disaster-list
7The PSI Global Resilience Project
In assessing risk reduction measures, the research focuses on three criteria:
l Net economic benefit – An assessment of the economic cost saved through risk
reduction measures
l Net social benefit – An assessment of the number of lives which could be saved through
risk reduction, the number of people who would be spared the need for emergency
assistance including food, shelter and medicine and downstream impacts including
environmental benefits
l Cost – An assessment of the relative cost to implement a particular risk reduction
measure compared to other measures
The availability and effectiveness of a risk reduction measure is highly dependent upon
the local environmental, social and economic conditions, governance systems, and the
disaster resilience maturity of the at-risk community. However, some broad conclusions on
effectiveness can be drawn across regions:
l For cyclones – Natural ecosystems, such as mangroves and sand dunes, provide
high net economic and social impact, as with structural measures such as seawalls.
These natural coastal protection ecosystems are particularly effective in reducing risk in
combination with structural measures, plus they bring downstream benefits
l For earthquakes – Targeting the structures with the highest exposure and largest risk
of collapse through retrofitting and building codes are seen as the best way to reduce
adverse impact
l For flooding – Structural measures that protect against high severity exposure (for
example, controlled and permanent barriers) will have a large impact, as will a strategic
focus on an entire flood basin (for example, upstream erosion management and
downstream basin storage). Wetlands are a natural alternative and bring downstream
benefits. Land-use planning is an effective measure to promote disaster risk-sensitive
development choices
Across all types of hazards, there are three risk reduction measures which can have a
significant impact:
l Developing more risk-aware communities through education and communication
l Understanding hazard exposure through risk mapping
l Robust warning systems and emergency evacuation
Impediments to effective disaster risk reduction
This report identifies two issues which have the potential to stand in the way of an effective
response to disaster risk reduction:
l Data quality and assessment tools – There are significant issues with currently available
data, which is inconsistent and difficult to compare. Universal data standards are needed
to assess the effectiveness of risk reduction measures and to make the case for pre-
disaster resilience investment to governments and other stakeholders
l Lack of standardised framework for decision-making – The adoption of standards
for decisions on risk reduction efforts is required for a globally consistent and effective
response to the threat of natural disasters. A standardised framework does not mean
8Building disaster-resilient communities and economies
a one-size-fits-all approach to risk reduction. Rather, it supports tailored and localised
measures by providing a robust framework for identifying the most effective areas of focus
for risk reduction.
The improvement of data quality, use of consistent data metrics and the adoption of
standards within a framework (for example, a cost-benefit analysis) would deliver insights
to make the case for risk reduction and support a shift to greater pre-disaster resilience
investment.
The need for a portfolio approach
While one risk reduction measure in isolation can be beneficial, this benefit is amplified by
adopting several measures which work together as part of a risk reduction portfolio.
For example, mangroves and sand dunes can work together to block storm surge over
a greater section of coastline. Also, some risk reduction measures are prerequisites for
others—evacuation can only be effective if the community has first been educated on how,
when and why to evacuate.
Each risk reduction measure needs to be tailored for the community it is protecting, so
different combinations will be effective under different circumstances. However, it is broadly
true that several measures work better than one, particularly when they form part of a clear
and integrated risk reduction strategy.
Disasters, climate change and development
Climate change is making the world a riskier place to live, particularly for communities
vulnerable to natural hazards.
As the risk exposure is evolving and changing, it is important to challenge assumptions based
on historical data to make sure they take increased risk into account.
Even the most effective, well-planned risk reduction measures can fail under previously
unforeseen stresses. Ongoing vigilance is needed to reevaluate risk exposures and the
effectiveness of existing measures.
Natural disasters hold back development; so risk-aware communities and disaster risk
reduction investments are critical to making sure that hard-won development gains are
protected. It is in this light that disaster resilience becomes a foundation for sustainable
development—one that sustains society, the economy, and the environment.
9The PSI Global Resilience Project
Introduction
Disaster risk management – A continuum of activity
Disaster risk management aims to systematically avoid, lessen or transfer the adverse
impacts of hazards and the possibility of disaster.9 It spans a range of activities and elements,
before and after an event:
l Understanding and assessing disaster risk – Effectively managing disaster risk must
start with an understanding of its causal factors. Hazards, exposure and vulnerability are
determinants of disaster risk
l Disaster risk reduction and prevention – Mitigating the causal factors of disasters
through reduced exposure to hazards, lessened vulnerability of people and property,
and increasing resilience. It also involves building the capacity of a community, and its
emergency services, to prepare for and cope with an event
l Disaster response and relief – Responding in the aftermath of an event to save lives,
treat the injured, protect property and meet basic human needs
l Disaster recovery – Restoring facilities, livelihoods and living conditions of disaster-
affected communities
l Disaster risk financing – The shifting of the economic burden of loss to another,
through risk sharing or risk transfer mechanisms such as insurance
The role of insurers in disaster risk management
In 2013, global economic losses due to natural disasters amounted to USD 131 billion, which
represents almost 2% of GDP. Of these losses, USD 37 billion were insured, down from a 10-
year average of approximately USD 55 billion.1
The insurance industry plays a critical role in providing financial protection and security to at-
risk communities to support, and preserve the gains of, social and economic development.
It is finding new ways to respond to the diverse needs of individuals, government and
commercial enterprise.10 Microinsurance provides protection to low-income communities
by insuring their crops, livestock or assets, and extends to accident, health, life and funeral
insurance. Catastrophe insurance pools and index-based insurance solutions can facilitate
the coverage of natural hazard risk in highly-exposed and vulnerable communities. Insurance-
linked securities, such as catastrophe bonds, can bring alternative capital to cover natural
hazard risk.
However, the insurance industry’s contribution to managing disaster risk extends well beyond
the losses it pays out.
9 UN Office for Disaster Risk Reduction
10 http://www.oecd.org/daf/fin/insurance/OECD_APEC_DisasterRiskFinancing.pdf
10Building disaster-resilient communities and economies
l Insurers are in the business of understanding, managing and carrying risk. Their expertise
looks back—leveraging aggregated data from past events—as well as forward—modelling
exposure in an evolving risk landscape. Insurance pricing and other policy terms and
conditions can provide clear risk signals and reward risk reduction efforts.
l Insurers live in the communities they serve and experience disasters first hand, as well as
their adverse consequences. When disaster strikes, insurers help communities recover
from the economic and social impact of events. Insurers mobilise their own resources and
those of their supply chain partners to respond to the losses suffered by their customers.
l Insurers help communities reduce disaster risk through research, advocacy, and practical
support at the local level.11
Disaster risk reduction – A better way
The insurance industry’s experience tells us that natural disasters and extreme weather
events are becoming more common and more severe. Together with higher exposure through
population growth and urbanisation, this is expected to result in a significant increase in
losses arising from natural hazards over coming decades.
Risk transfer mechanisms such as insurance will be important in helping communities and
economies meet these threats.
However, communities must also better protect themselves, reduce avoidable loss and build
resilience to cope with events that arise.
And it’s simple economic common sense. It is estimated that every dollar spent in disaster
risk reduction returns between two and ten dollars in recovery savings.3,4,5,6
More investment in disaster risk reduction will lead to:
l Safer and more resilient communities and economies
l Less public and private funds spent on disaster relief and recovery, enabling better
investment
l More access to affordable insurance to help communities manage the uncertainty of
adversity and the financial hardship associated with unexpected losses
These are complex challenges and require the goodwill and collective effort of many. With
the insurance industry’s long-standing expertise in disaster risk management, it can play a
key role in building the resilience of communities and economies to natural hazards.
The Post-2015 Framework for Disaster Risk Reduction – A major opportunity
The United Nations ‘Hyogo Framework for Action 2005-2015: Building the resilience of
nations and communities to disasters’ (HFA), is the first global plan to set out what is required
from all sectors and actors to reduce disaster losses and bring them into a coordinated
common system. The HFA outlines five priorities for action, and offers guiding principles
and practical means for achieving disaster resilience.12
11 See for example Tokio Marine & Nichido Fire Insurance’s commitment to mangrove planting:
http://www.tokiomarine-nichido.co.jp/en/news/pdf/131203e.pdf
12 United Nations Office for Disaster Risk Reduction: http://www.unisdr.org/we/coordinate/hfa
11The PSI Global Resilience Project
As the HFA is expiring in 2015, a new framework is under development and will be produced
at the 3rd UN World Conference on Disaster Risk Reduction in Japan in March 2015, then put
to the UN General Assembly for endorsement.
Within the consultation process for this new framework, there is much focus on the key roles
of different stakeholders in disaster risk reduction, including the insurance industry and the
broader private sector.
In 2013, the UN issued a stark warning to the world’s business community that economic
losses linked to disasters are ‘out of control’ and will continue to escalate unless disaster risk
management becomes a core part of business investment strategies.13
‘We have carried out a thorough review of disaster losses at national level and it is clear that direct losses
from floods, earthquakes and drought have been underestimated by at least 50%. So far this century, direct
losses from disasters are in the range of USD 2.5 trillion. Economic losses from disasters are out of control
and can only be reduced in partnership with the private sector which is responsible for 70% to 85% of all
investment worldwide in new buildings, industry and small to medium-sized enterprises. The principles of
disaster risk reduction must be taught at business schools and become part of the investor’s mindset.’
Ban Ki-moon, UN Secretary-General
Other international public policy processes will likely explore the opportunity for the insurance
industry and broader private sector to build resilience and drive sustainability, together with
governments, regulators and civil society.
These include:
l The UN Sustainable Development Goals, which will succeed the UN Millennium
Development Goals and form part of the Post-2015 Development Agenda
l An international climate agreement under the UN Framework Convention on
Climate Change to be decided by 2015
l The Global Framework for Climate Services
l The 2016 World Humanitarian Summit
The PSI Global Resilience Project highlights the role of the insurance industry across the
spectrum of activities in disaster risk management. The findings of this report can help guide
communities and policymakers towards public policies that will mobilise the risk management
expertise and resources of the global insurance industry to help meet these challenges.
13 United Nations Office for Disaster Risk Reduction: http://www.unisdr.org/files/33003_2013gar15final.pdf
12Building disaster-resilient communities and economies
Data issues and research methodology
Key points
l Data from over 300 sources was analysed, presenting challenges in terms of consistency
and data standardisation
l These challenges were addressed by assessing all data under three criteria—the social benefits,
economic benefits, and cost of disaster risk reduction
There is a wealth of data available on disaster risk reduction measures and their effectiveness.
This report considered over 300 sources including academic papers, government and scientific
reports, case studies and media articles.
The research found the information to be often inconsistent and difficult to compare, presenting
a challenge to drawing meaningful insights on the effectiveness of each risk reduction measure.
For data to be useful on a global scale, it must be consistent, standardised and globally
accepted.
To address this, the research used a relative analysis of measures, looking at net economic and
net social impact (including downstream impact) as well as cost. This section describes the
limitations presented in the data and the research methodology used to deal with these issues.
Data issues and research methodology
Data standardisation
l Inconsistent study goals – While all sources examined focused on projects aimed at
reducing risk, each study had unique goals, and a different area of focus. For example,
some studies were specifically focused on reducing economic loss, while others focused
on reducing human and social losses. Even when different studies had the same
objectives and focus, the data was often defined and measured differently
l Inconsistent study assumptions – The underlying assumptions that measure outcomes
vary greatly between studies. For example, economic loss can be limited to insured losses in
some cases, but can include uninsured losses in other cases. Some studies include deaths
as only those directly caused by the event, while others include both direct and indirect
deaths
Data validation
l Sources disagree on the economic and social impact that natural hazards have
caused – For example, EM-DAT reported the death toll from the 2010 earthquake in Haiti to
be 222,570 people. By contrast, the Haitian government reported the death toll at 316,000
people14 and the US Agency for International Development, which conducted a house-to-
house study, reported the death toll to be 65,575 15
14 O’Connor, Maura, Columbia Journalism Review, 2012, http://www.cjr.org/behind_the_news/one_year_later_haitian_earthqu.php?page=all
15 Schwartz, Timothy, USAID, 2011, www.sentinel.ht/documents/BARR_Report_PauP_Final.docx
13The PSI Global Resilience Project
l Expected benefits for risk reduction measures vary greatly between sources – This
is not surprising given the lack of consensus on data points between different sources for
events that have already occurred
Research bias
l Published research on disaster risk reduction measures focuses almost exclusively
on success stories – The lack of data on failures eliminates the possibility of learning
from them and creates an overall research bias 16
Research methodology
Disaster risk encompasses a range of hazards:
l Natural hazards – Including storms and cyclones, drought and extreme temperatures,
earthquakes and volcanic activity, fires and floods
l Biological hazards – Including epidemics, animal and insect infestation
l Technological hazards – Including industrial pollution, factory explosions and transport
accidents.
This report focuses on the three most common and costly natural hazards—flood, cyclone
and earthquake8 and examined three types of risk reduction measures:
l Behavioural – Measures which rely on human behaviour (for example, evacuation)
l Structural – Measures which rely on built infrastructure (for example, levees)
l Ecosystems – Masures which make use of or improve environmental features and natural
ecosystems (for example, mangroves, sand dunes) to reduce the impact of a hazard
This report considers risk reduction measures which address specific hazards. It does
not address the need for broader societal resilience to adaptively cope with the impact of
disasters when measures fail.
Focusing on the primary needs to save lives and protect property, all data was analysed
under three criteria:
Net economic benefit
l Loss prevention (cost savings) – What are the expected cost savings by implementing
this specific risk reduction measure compared to the other measures?
Net social benefit
l Loss prevention (lives saved) – How many lives will be saved by implementing this risk
reduction measure compared to the other measures?
l Reduction in lives adversely affected – How many fewer people will be adversely
affected as a result of implementing this risk reduction measure? ‘Affected’, in this case,
means people requiring immediate assistance during a period of emergency—people
requiring basic survival needs such as food, water, shelter, sanitation and immediate
medical assistance
16 According to Roy Lewis III of the National Association of Environmental Professionals in the United States, ‘Unsuccessful (or only partially successful)
projects are rarely documented.’
14Building disaster-resilient communities and economies
Relative cost
l How much does it cost to implement this risk reduction measure compared to the
other measures?
Downstream impacts were also considered. For example, does the risk reduction measure
positively or negatively impact the local economy, environment or surrounding communities?
Will it create prolonged displacement and unsafe or undesirable conditions in which to live?
The PSI Initiative acknowledges the work of the Partnership for Environment and Disaster
Risk Reduction17 and its member partners to consider the effectiveness of ecosystem-based
approaches to managing climate and disaster risk and the integration of biophysical and
environmental factors into this analysis.18 This is important to truly understand what is
at stake and to have a more holistic view of approaches that can be taken. This is why
ecosystem-based approaches were included in the types of risk reduction measures
researched, along with behavioural and structural approaches. However, a detailed
consideration of every type of risk reduction measure is beyond the scope of this report.
About the charts in this document
At the beginning of each section, the risk reduction measures discussed are analysed
according to their costs as well as their social and economic benefit (Figure 1). Downstream
impacts—positive or negative consequences which may result from the implementation of
these measures—are also considered.
Given the data challenges set out above, qualitative assessments of social and economic
benefit and cost were made based on the available material.
Figure 1 Template used for disaster risk reduction measure comparison
Net economic benefit Net social benefit
Risk reduction
Downstream impact
measure Loss prevention Loss prevention Reduction in lives
Relative cost
(cost savings) (lives saved) adversely affected
• Wild animal habitat
Measure 1 High impact High cost High impact High impact • Reduced
property values
• Empowered
Measure 2 Moderate impact Low cost Moderate impact Moderate impact citizens
• Abandoned
Measure 3 Low impact Moderate cost Low impact Low impact property
Also, risk reduction measures were analysed on the relative total cost of implementation
compared to other measures for the hazard. This analysis considers risk reduction measures
according to their type—behavioural, structural or ecosystems. The size of the circles in this
analysis (Figure 2) indicates the cost effectiveness of each risk reduction measure compared
to others for the same hazard.
17 Partnership for Environment and Disaster Risk Reduction: http://pedrr.org/
18 N. Doswald, R. Munroe, D. Roe, A. Giuliani, I. Castelli, J. Stephens, I. Möller, T. Spencer, B. Vira & H. Reid , Climate and Development
(2014): Effectiveness of ecosystem-based approaches for adaptation: review of the evidence-base, Climate and Development, DOI:
10.1080/17565529.2013.867247
15The PSI Global Resilience Project
Figure 2 Template used for comparison of cost effectiveness of risk reduction measures
Legend HIGH
Behavioural
Ecosystems
Structural
Net economic impact
Circle size indicates
relative total cost
of implementation
LOW Net social impact HIGH
16Building disaster-resilient communities and economies
Risk reduction measures – Overview
Key points
l Assessing the effectiveness of risk reduction measures needs to take into account economic
benefit, social benefit and cost
l Risk reduction can only be effective in an enabling environment, with engaged stakeholders,
a data-driven approach, appropriate planning, and the implementation of a range of measures
Key initiatives – Benefits and costs
Risk reduction measures outlined in this report were assessed according to economic
benefit, social benefit and cost, with each criteria ranked low, moderate or high.
The research focused on the three most frequent, and most destructive, natural hazard
risks—cyclone, earthquake and flood. Also, measures were identified which can have a
positive impact on all risks.
This table summarises the PSI Initiative’s findings in relation to risk reduction measures
discussed in this section.
Figure 3 Multi-hazard risk reduction measures – Cyclone, earthquake and flood
Initiative Economic benefit Social benefit Cost
Lives saved Reduction in lives
adversely affected
Education and communication High Moderate/High High Low
Risk mapping Moderate High High Moderate
Emergency evacuation Low High High Low
Figure 4 Cyclone risk reduction measures
Initiative Economic benefit Social benefit Cost
Lives saved Reduction in lives
adversely affected
Mangroves Moderate/High Moderate Moderate Moderate
Coastal sand dunes High Moderate Moderate Moderate/High
Cyclone shelters Low High Moderate Moderate
Early warning system Moderate/High High Moderate Low
Improved building codes Moderate/High Moderate High Low
Prediction Moderate Moderate Moderate Low/Moderate
Seawalls High High High High
17The PSI Global Resilience Project
Figure 5 Earthquake risk reduction measures
Initiative Economic benefit Social benefit Cost
Lives saved Reduction in lives
adversely affected
Relocation High High Low High
Earthquake prediction Low Low Low High
Tsunami warning systems Moderate High Low High
Soil assessment Moderate Moderate Moderate High
Building codes Moderate/High High Moderate Low
Retrofitting Moderate/High High Moderate High
Figure 6 Flood risk reduction measures
Initiative Economic benefit Social benefit Cost
Lives saved Reduction in lives
adversely affected
Permanent barrier – Block Moderate/High Moderate High Moderate/High
Controlled barrier – Block, divert High High High High
Temporary barrier – Block Low/Moderate Low Moderate Moderate
Wetlands – Block Moderate/High Moderate High Moderate
River modification – Block Low/Moderate Moderate Moderate High
Conveyance – Divert High High Moderate/High Moderate/High
Basin storage – Divert Moderate/High Moderate Moderate Moderate
Relocation – Reduce High Moderate Moderate Moderate/High
Warning system – Reduce Low High Low Low
Land-use planning – Reduce Moderate/High High High Low
Enabling environment
The research reveals important themes and common good practices necessary for an
enabling environment that builds disaster resilience.
1 Active engagement – All stakeholders across a range of disciplines and perspectives
need to be engaged collaboratively in resilience-building efforts
2 Proper planning – Stakeholders need a detailed understanding of the disaster risk
exposure and the environment in which the risk reduction measure is implemented.
This understanding is only possible with accurate and consistent data
3 Data-driven approach – To identify and justify resilience investments, potential funders
require hard data on the future benefits of implementation
4 Portfolio of measures – In most cases, a single risk reduction measure does not deliver
the maximum or sufficient benefit. It is the use of a portfolio of complementary measures
that is most effective to drive risk reduction. For cyclones, mangroves and coastal sand
dunes can block storm surge, while effective building codes and enforcement will protect
buildings from strong winds. Risk education together with effective early warning systems
will enable communities to best prepare for flooding. A tailored portfolio approach to risk
18Building disaster-resilient communities and economies
reduction will likely be most successful in reducing vulnerability to natural hazards. It also
allows communities to adapt their risk defenses as their situations develop
5 Designed for community – The engagement of at-risk communities at all levels helps
ensure the effectiveness of any measure. Cooperation among all stakeholders is needed
to understand disaster risk, how these risks are best met, and potential barriers to
effective implementation. While knowledge sharing across regions is important, simply
replicating a risk reduction measure without taking into account the unique circumstances
of the local geography, environment, demography and culture will limit effectiveness
Figure 7 Important themes and common good practices that build disaster resilience
Active Proper
engagement planning
Governments NGOs
Enabling
environment
Designed Data-
for driven
community Private industry Local communities approach
Portfolio of
measures
19The PSI Global Resilience Project
Multi-hazard risk reduction measures –
Cyclone, earthquake and flood
Key points
l Risk mapping, education, and effective evacuation procedures have the capacity to reduce
economic and social impacts across all disaster types
l Effective risk mapping enables the identification of at-risk communities, and the initiatives
most likely to benefit them
l Education creates risk-aware stakeholders and communities equipped to act on risk mapping
to reduce their level of risk
l Emergency evacuation procedures have obvious benefits in removing people from
dangerous situations, and can help communities recover more quickly
Risk mapping, education and evacuation preparedness are measures that are broadly
applicable to the hazards of cyclone, earthquake and flood. Like many risk reduction
measures, they can be interdependent.
Risk mapping
Risk mapping is the identification of high-risk areas susceptible to a hazard.
Risk mapping relies on a probability analysis of many variables such as frequency, severity
or magnitude. The inherent uncertainty in probability analysis makes mapping for natural
hazards helpful but still very susceptible to outliers, particularly for earthquake.19, 20
For risk mapping to be most effective, up-to-date data on population density and built assets
is needed.
Net social benefit
The net social benefit for this measure is moderate to high.
In isolation, the net social impact of risk mapping is limited. However, it is critical to informing
development and planning regulation and building code standards. When a community
maps out its risk exposure to natural hazards, it can better identify and plan for the types of
structures that can be built in certain areas and design building codes to reduce exposure.
Net economic benefit
The net economic benefit for this measure is moderate.
19 Lomnitz, Cinna, 1989, http://www.bssaonline.org/content/79/5/1662.full.pdf
20 Seth Stein, 2012, ‘Why earthquake hazard maps often fail and what to do about it’,
http://www.earth.northwestern.edu/people/seth/Texts/mapfailure.pdf
20Building disaster-resilient communities and economies
Cost
The cost for this measure is moderate.
The cost of risk mapping varies across regions, and also depends on data availability,
reliability and accessibility, and mapping resolution.
Hazard risk mapping
Recommended practices
l Foundational input to risk reduction investments
Obstacles
l Lack of available, reliable and accessible data
l Vast collection of hazard information sources
l Translation inaccuracy
Education and communication
Sharing knowledge among stakeholder groups including governments, NGOs, scientists,
communities, individuals, and business owners is critical to effective disaster risk reduction.
Education promotes a united and therefore more effective approach, improves safety,
generates risk awareness, and supports resilience-building efforts.
An organised and systematic method for coordinating communication among a variety of
stakeholders is a key success factor for effective risk reduction.21
The need for consistency in communication has been emphasised by the UN General
Assembly in a ‘call to action’ for disaster risk reduction education to be integrated into
humanitarian action plans. At least 4% of humanitarian budget allocations should go towards
education initiatives.22
Effective education needs to be appropriately tailored to each audience, and must focus on
three critical issues:
l Potential losses
l The chances that the losses will take place in a certain amount of time
l How to cut the losses23
But while education is a precondition for effective risk reduction, it does not automatically lead
to appropriate action.24
21 As stated by the US National Disaster Education Coalition ‘The coalition recognizes that it is important for all agencies to deliver consistent disaster
safety messages. When the public receives consistent information, they will prepare and respond appropriately when disaster threatens.’ The
National Disaster Education Coalition. http://www.disastereducation.org/about.html
22 Greubel Lauren, Xanthe Ackerman and Rebecca Winthrop. The Brookings Institution. ‘Prioritizing Education in the Face of Natural Disasters.’ October
2012. http://www.brookings.edu/blogs/up-front/posts/2012/10/31-natural-disasters-winthrop
23 Martin, II, James R., Federal Emergency Management Agency National Preparedness Directorate. ‘Session No. 13-Earthquake Hazard and
Emergency Management-Risk Communication Strategies and Public Outreach.’
24 Pacific Earthquake Engineering Research Center. ‘Framing Earthquake Retrofitting Decisions: The Case of Hillside Homes in Los Angeles.’ March
2000. http://peer.berkeley.edu/publications/peer_reports/reports_2000/0003.pdf
21The PSI Global Resilience Project
Risk awareness of itself may not be sufficient to motivate people to take action, which can be
impacted by levels of individual empowerment or anxiety, lived experience of hazards, and the
attitudes of peer networks. Sustained preparedness for high impact but rare events is also
problematic.25 26
Case study Education in Japan, Chile and Haiti
The INSEAD Humanitarian Research Group conducted a study on the link between economic development
and humanitarian response in earthquake and tsunami events that occurred in Japan, Chile and Haiti
between 2010 and 2011. The following statistics demonstrate the link between loss and existing levels of
disaster mitigation, preparedness, governance and socio-economic conditions in place at the time of each
disaster.
The 2011 Japan 9.0-magniude earthquake killed 13,858 people (or 0.01% of population).
l One of the most advanced earthquake early-warning systems with a network exceeding 1,000
seismographs
l Embedded public education models and disaster education in school curriculums
l Community level social education
l No major casualties as a result of the earthquake itself, but the tsunami was the major cause of deaths
The 2010 Chile 8.8-magnitude earthquake killed 562 people (or less than 0.01% of population).
l Seismic building codes and strict enforcement of laws on construction
l Community risk awareness based on past earthquakes
The 2010 Haiti 7.0-magnitude earthquake killed 230,000 people (or 2.4% of population).
l Policymakers did not mandate risk mitigation
l Poor quality buildings
l No culture of risk awareness
INSEAD concluded that behaviour of individuals can be influenced by education and training. People
in Japan knew the procedures and safest places to go to when the earthquake struck. Education and
training helped build disaster resilience and the ability to respond adequately. Similarly, Chile’s coastal town
population was able to use the lessons from the past when they felt the earthquake. However, people in
Haiti were unprepared for how to deal with a major earthquake.
Overall, they concluded that education of society and communities is an important element in risk
reduction. It helps avoid human losses and mitigate underlying risk factors. Therefore, local capacity
building through education and training can build disaster-responsive local communities.
Source: INSEAD, ‘Why the Japan disaster is so different from the other disasters,’
by Jurgita Balaisyte, and Luk N. Van Wassenhove, May 10, 2011.
25 Paton et al., ‘When good intentions turn bad: promoting natural hazard preparedness’ The Australian Journal of Emergency Management, Vol. 20 No
1. February 2005
26 Becker et al., ‘A model of household preparedness for earthquakes: how individuals make meaning of earthquake information and how this influences
preparedness’ Nat Hazards DOI 10.1007/s11069-012-0238-x
22Building disaster-resilient communities and economies
Net social benefit
The net social benefit of education is moderate to high.
Fewer lives are lost or affected when individuals understand fundamental hazard safety and
respond appropriately. Education enables communities to act in an organised and structured
way that facilitates emergency responses.27
Net economic benefit
The net economic benefit of education is high.
Educated communities, individuals and business owners who know what to expect before,
during and following a natural hazard can prepare in advance and recover more quickly from
property loss.28
Cost
The cost of education is low relative to other measures.29
Costs include the collaborative effort of civic organisations, scientists, educational institutions,
government and NGOs to get the right information to the target audience.
Education
Recommended practices
l Ensuring that there is communication to communities, and between governments
and stakeholders
Obstacles
l Differing literacy levels of individuals across regions
l Ensuring that communication is culturally-sensitive and appropriate
Emergency evacuation
When meteorological prediction systems identify the probable path and intensity of a severe
natural hazard, emergency evacuation requires an immediate and urgent response from
communities to move out of harm’s way. It also requires effectively addressing the concerns
of the community and communicating the severity of the event, as those asked to evacuate
may be concerned about the threat from looters and reluctant to abandon their property.
Net social benefit
If planned and executed well, the net social economic benefit is high.
The number of lives saved depends on population density and compliance with evacuation
orders.
27 Denver UASI, State of Colorado and Federal Stakeholders cooperating through the Wide Area Recovery and Resiliency Program. ‘Denver UASI All-
Hazards Regional Recovery Framework.’ October 2012. http://www.fema.gov/media-library-data/20130726-1910-25045-8957/51_rrkp_urban_area_
recovery_attachment_1_denver_framework___cbr_annexes.pdf
28 Gordon, Peter, et al. ‘Earthquake Disaster Mitigation For Urban Transportation Systems: An Integrated Methodology That Builds On The Kobe And
Northridge Experiences.’ http://www-bcf.usc.edu/~pgordon/pdf/earthquake.pdf
29 The California Seismic Safety Association. ‘California Earthquake Loss Reduction Plan.’ 2001. http://www.seismic.ca.gov/pub/CSSC_1997-02_
CELRP.pdf
23The PSI Global Resilience Project
The warnings must be strongly worded and indicate if the evacuation is mandatory or simply
recommended. According to a study conducted by the University of South Carolina, just
50% of survey respondents said they would go if evacuation was recommended instead of
mandatory.30 Also, evacuation depends on proper education on the best evacuation route,
what essential items to bring, and the best way to protect belongings left behind so they are
not damaged by the hazard.
Net economic benefit
The net economic benefit for this measure is low.
Evacuations do not preserve physical assets that are left unprotected and exposed to the
event. However, with preparedness education, communities can ‘harden’ their homes and
property well before an event strikes. While this can impact livelihoods, the trade-off is a high
social benefit as demonstrated above.
Cost
The cost of evacuation depends on the number of people requiring relocation and the
planning and infrastructure needed to support evacuation.31 The cost also depends on travel
distance to safety, the evacuation time period, and the physical welfare and demographics of
the evacuees.32
Evacuation
Recommended practices
l Evacuation plans and routes must be well communicated
l Appropriate funding and supplies to sustain displaced residents for an extended
period of time
Obstacles
l Refusal of residents to leave homes
l Finding a safe location which can house large amounts of people for
extended periods of time
30 Gannon, Megan, Live Science, 2012, http://www.livescience.com/22697-coastal-residents-hurricane-evacuations.html
31 Smith, Kevin, East Carolina University, 1999, http://www.cs.rice.edu/~devika/evac/papers/kevinsmith.pdf
32 John R. Maiolo of East Carolina University found the cost per household for evacuation is USD 112. Maiolo, John, 2000, Heading for Higher Ground:
Factors Affecting Real and Hypothetical Hurricane Evacuation Behavior, http://www.cs.rice.edu/~devika/evac/papers/Heading%20for%20higher%20
ground.pdf
24Building disaster-resilient communities and economies
Cyclone risk reduction measures
Key points
l Natural ecosystems, such as mangroves and sand dunes, can be used to reduce risk and provide
high net economic and social benefits, as with structural measures such as sea walls. These
natural coastal protection ecosystems reduce the wave height and energy of storm surges and are
particularly effective in combination with structural measures
l Warning systems and evacuations are also effective and are relatively low-cost
A cyclone—also known as a hurricane or typhoon—is a large, rotating storm system that
brings strong winds, torrential rain, and high coastal storm surges upon landfall.
Cyclones caused 762,832 deaths between 1970 and 2012.8 Deaths in Bangladesh accounted
for more than half of that figure. The United States has experienced more economic loss
(USD 513 billion) than all other countries combined between 1970 and 2012.8 Much of this
economic loss is due to a large exposure to infrastructure loss, particularly along the east
coast.
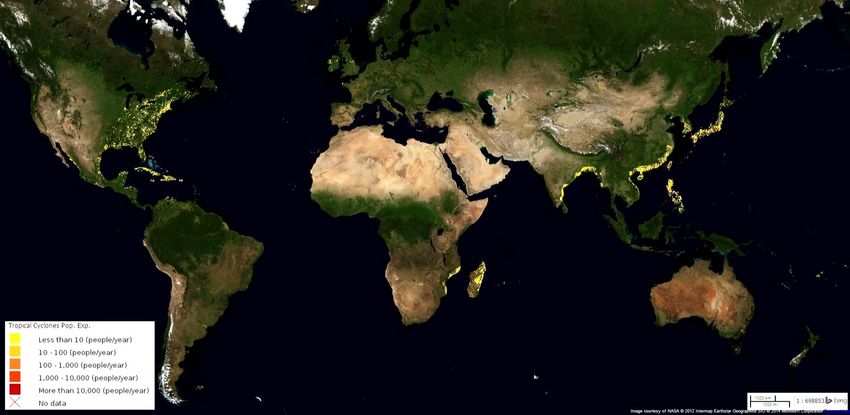
Figure 8 (below) shows the exposure of many coastal communities to the devastating impact
of cyclones.
Figure 8 Cyclone exposure by population
Source: Global Risk Data Platform. Created and hosted by UNEP/GRID-Geneva. Supported by UNISDR. Updated in 2013. http://preview.grid.unep.ch/index.
php?preview=about&lang=eng
25The PSI Global Resilience Project
Ecosystem-based risk reduction measures such as mangroves and sand dunes have proven
to be cost effective and, in combination with structural and behavioural measures such as
warning systems and evacuation, can be highly effective in protecting lives, property and
livelihoods.
The following table assesses the relative economic and social costs and benefits and
downstream impacts of each specific cyclone risk reduction measure. Risk reduction
measures also common to earthquake and flood are addressed in the ‘multi-hazard’ section
of this paper.
Figure 9 (below) provides an assessment of each measure’s economic and social impact
along with its downstream impact.
Figure 9 Cyclone risk reduction measure comparison criteria
Initiative Economic Social benefit Cost Downstream impact
benefit
Lives saved Reduction in
lives adversely
affected
Mangroves Moderate/ Moderate Moderate Moderate • Wildlife habitat
High • Biodiversity conservation
• Opportunities for aquaculture
Coastal sand dunes High Moderate Moderate Moderate/ • Wildlife animal habitat
High
Cyclone shelters Low High Moderate Moderate • Community infrastructure
Early warning system Moderate/ High Moderate Low
High
Improved building codes Moderate/ Moderate High Low
High
Prediction Moderate Moderate Moderate Low/Moderate
Seawalls High High High High • Unsightly
• Impact on sediment movement
may transfer hazard elsewhere
• Potential destruction of
ecosystems
Figure 10 Cyclone risk reduction measure comparison analysis
Legend HIGH
Behavioural
Ecosystems
Structural Sand dunes
Seawalls
Net economic impact
Circle size indicates
relative total cost Mangroves
of implementation Warning
system
Prediction Building
codes
Shelters
LOW Net social impact HIGH
26You can also read