International Evaluation
      of Public Policies for
Electromobility in Urban Fleets
←
→
Page content transcription
If your browser does not render page correctly, please read the page content below
International Evaluation
of Public Policies for
Electromobility in Urban Fleets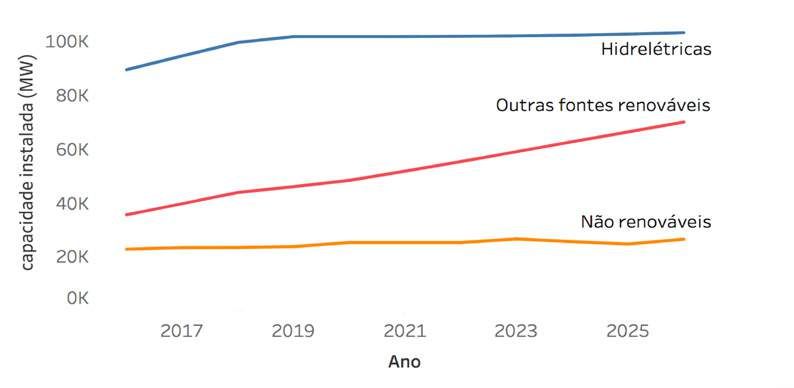
International Evaluation
      of Public Policies for
Electromobility in Urban Fleets

              Study prepared by the International Council on Clean
              Transportation (ICCT) requested by GIZ (German Agency for
              International Cooperation) and the Ministry of Industry, Foreign
              Trade and Services (MDIC).

              Authors:
              Peter Slowik
              Carmen Araujo
              Tim Dallmann
              Cristiano Façanha

              November 2018
FEDERATIVE REPUBLIC OF BRAZIL
Presidency of the Republic
Michel Temer
Ministry of Industry, Foreign Trade and Services
Marcos Jorge de Lima
Secretariat of Industrial Development and Competitiveness
Igor Nogueira Calvet
Director of the Department of Industries for Mobility and Logistic – DEMOB
Margarete Gandini
Technical Support
Cooperação Alemã para o Desenvolvimento Sustentável por meio da Deutsche
Gesellschaft für Internationale Zusammenarbeit (GIZ) GmbH
National Director
Michael Rosenauer
Project Coordinator
Jens Giersdorf
COORDINATION AND EXECUTION
Coordination and operation team Text review and translation
Igor Calvet, Margarete Gandini, Ricardo Zomer, Gustavo Victer, Ana Terra
Thomas Caldellas (MDIC), Bruno Carvalho, Fernando Fontes,
Jens Giersdorf e Marcos Costa (GIZ). Cover and graphical project
João Neves
Auhtors
Peter Slowik, Carmen Araujo, Tim Dallmann e Cristiano Façanha Layout
Barbara Miranda
Technical coordination
Cristiano Façanha and Marcos Costa PUBLISEHD BY
Projeto Sistemas de Propulsão Eficiente – PROMOB-e (Projeto
Technical review de Cooperação Técnica bilateral entre a Secretaria de
Marcos Costa (GIZ) Desenvolvimento e Competitividade Industrial – SDCI/MDIC e
Bruno Carvalho (GIZ) a Cooperação Alemã para o Desenvolvimento Sustentável (GIZ)
Ricardo Zomer (MDIC)
CONTACTS
SDCI/Ministério da Indústria, Comércio Exterior e Serviços Deutsche Gesellschaft für Internationale Zusammenarbeit
Esplanada dos Ministérios BL J - Zona Cívico-Administrativa, (GIZ) GmbH
CEP: 70053-900, Brasília - DF, Brasil. SCN Quadra 1 Bloco C Sala 1501 – 15º andar Ed. Brasília
+55 (61) 2027 – 7293 Trade Center, CEP: 70711-902, Brasília-DF, Brasil.
www.mdic.gov.br +55 (61) 2101-2170
www.giz.de/brasil
LEGAL INFORMATION
The partial or total reproduction of this document is allowed only if the project PROMOB-e it is cited as source. For other purposes like
commercial, duplication, reproduction or distribution of parts or all of this study, the written consent of the Ministry of Industry, Foreign
Trade and Services and GIZ is necessary.
The ideas and opinions expressed in this work are from the authors and do not reflect the entire ideological position of the Ministry of Industry,
Foreign Trade and Services or of the Deutsche Gesellschaft für Internationale Zusammenarbeit (GIZ) GmbH.ACKNOWLEDGMENTS The authors would like to thank all participants in the validation workshop for their important contributions to the document and for the fruitful discussion included in Annex A. For additional information: International Council on Clean Transportation 1225 I Street NW Suite 900 Washington, DC 20005 USA communications@theicct.org | www.theicct.org | @TheICCT
LIST OF FIGURES
Figure ES-1 | Annual global EV sales from 2010 through 2017..................................................... 9
Figure ES-2 | Total cost of ownership over 10 years for conventional and
alternative bus technology in São Paulo.................................................................12
Figure 1-1 | U.S. light-duty emissions standards and estimated EV sales shares (2015-2030).........16
Figure 1-2 | Incentive value for battery electric and plug-in hybrid vehicles and 2016
sales share in major EV markets (Hall et al., 2017a).................................................18
Figure 1-3 | Final price of a Nissan Leaf compared to a conventional Nissan vehicle
after the application of import duty and value-added tax.........................................19
Figure 1-4 | Public charging infrastructure and EV registrations per million population
by metropolitan area.............................................................................................22
Figure 2-1 | Licensing of new vehicles in Brazil..........................................................................33
Figure 2-2 |Fuel consumption for road transportation by fuel type in Brazil.................................34
Figure 2-3 |Participation of fossil fuels and renewable fuels in road transportation.......................35
Figure 2-4 |GHG emissions from fuel combustion in 2016 in Brazil (OC, 2017).............................35
Figure 2-5 | Share of sugarcane and biodiesel products in the Brazilian energy matrix...................36
Figure 2-6 | Estimates of GHG emissions for the transportation sector based on
the premises adopted in PDE 2026.........................................................................37
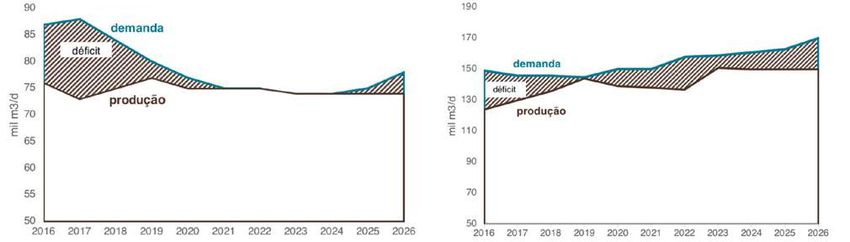
Figure 2-7 | Brazilian oil balance projections in 2017–2026 (PDE 2026)........................................37
Figure 2-8 | Brazilian balance of gasoline A (left) and diesel A (right)............................................37
Figure 2-9 | Relative emissions by type of source in the São Paulo Metropolitan Region
(Cetesb, 2018)......................................................................................................39
Figure 2-10 | Domestic supply of electric power by source (Aneel, 2018).....................................41
Figure 2-11 | CO2 emission factor of electric power generation (IGES, 2018)................................41
Figure 2-12 | Evolution of the installed capacity, by electricity generation source,
for the reference expansion (MME, 2017)...............................................................42
Figure 3-1 | System of governance for electric vehicles in Brazil..................................................43
Figure 4-1 | Sources of funding for the São Paulo public transportation system (SPTrans, 2017).....55
Figure 4-2 | Battery electric bus (BEB) uptake in Brazil...............................................................56
Figure 4-3 | Effect of battery electric bus uptake on annual well-to-wheel (WTW)
CO2 emissions in Brazil..........................................................................................56
Figure 4-4 | Market share of Diesel buses.................................................................................58
Figure 5-1 | Bus purchase price for electric drive transit buses compared to
a conventional diesel bus.......................................................................................62
Figure 5-2 | Energy consumption of electric transit buses compared to a conventional diesel bus..63
Figure 5-3 | Operating costs for alternative technology buses compared to
a conventional diesel bus......................................................................................63
Figure 5-4 | Regular vehicle maintenance costs for electric drive transit buses
compared to a conventional diesel bus....................................................................64
Figure 5-5 | Total cost of ownership estimates over 10 years for conventional and
alternative technology for Padron LE type buses in São Paulo...................................65
Figure 5-6 | Sensitivity analysis for TCO of a Padron LE type bus................................................68
Figure 5-7 | Sensitivity of TCO for a Padron LE BEB to bus ownership period...............................70
Figure 5-8 | Sensitivity of TCO for a Padron LE type bus to annual activity...................................70
Figure 5-9 | Total cost of São Paulo transit bus fleet replacement for diesel, diesel HEB,
and depot charge BEB procurement scenarios under 10-yr and
5-yr replacement schedules..................................................................................71
Figure 5-10 | Lifetime climate pollutant emissions from the São Paulo municipal transit bus
fleet under three separate fleet replacement procurement scenarios........................72
Figure 5-11 | Total lifetime direct and social costs for the replacement of the São Paulo
municipal transit bus fleet under three procurement scenarios................................73LIST OF TABLES
Table 1-1 | Summary of government promotion actions for EVs..................................................10
Table 1-2 | Summary of international clean vehicle and fuel regulations.......................................14
Table 1-3 | Summary of international consumer incentives for EVs..............................................17
Table 1-4 | Summary of international charging infrastructure programs for EVss..........................21
Table 1-5 | Example of electric carshare, ride-hail, taxi, urban delivery, and bus fleet initiatives....25
Table 1-6 | Summary of international planning, policy, and other EV promotions..........................28
Table 1-7 | Summary of government EV promotion actions in selected areas...............................30
Table 1-8 | Innovative EV support actions and example cities.....................................................31
Table 3-1 | Examples of consumer incentive initiatives in Brazil...................................................31
Table 3-2 | Governmental references for electromobility............................................................49
Table 4-1 | Targets for the reduction of pollutants established in the São Paulo Climate Law.........52
Table 4-2 | Current and future installed capacity of electric and hybrid buses in Brazil..................58
Table 5-1 | Components of total cost of ownership (Miller et al., 2017)........................................60
Table 5-2 | Projected composition and scheduled activity for São Paulo municipal public transit
bus fleet following system reorganization (Prefeitura de São Paulo Mobilidade e
Transportes, 2017).................................................................................................61
Table 5-3 | TCO modeling input data for P7 diesel buses equipped with AC (SPTrans, 2018).........61
Table 5-4 | Comparison of TCO estimates across bus types and technologies..............................66
Table 5-5 | Overview of sensitivity analysis...............................................................................67
Table A-1 | Actions and policies for electromobility...................................................................76
Table A-2 | Participants in the validation workshop....................................................................78LIST OF ACRONYMS ABDI Brazilian Industrial Development Agency Abeifa Brazilian Association of Motor Vehicle Importing and Manufacturing Companies ABNT Brazilian Association of Technical Standards ABVE Brazilian Association of Electric Vehicles AEA Brazilian Association of Automotive Engineering Aneel Brazilian Electricity Regulatory Agency ANP National Agency of Petroleum, Natural Gas and Biofuels ANTP National Association for Public Transport BEB Battery electric bus BEV Battery electric vehicle BNDES National Bank of Economic and Social Development Camex Foreign Trade Chamber CARB California Air Resources Board Cetesb São Paulo State Environmental Company CNPE National Energy Policy Council CO Carbon monoxide CO2 Carbon dioxide Denatran National Transit Department EMTU Metropolitan Urban Transportation Company of São Paulo EPE Energy Research Company VE Electric vehicle EVSE Electric vehicle supply equipment FCEB Fuel cell electric bus GEE Greenhouse gases GIZ Deutsche Gesellschaft für Internationale Zusammenarbeit GQA Air Quality Management HC Hydrocarbons HEB Hybrid electric bus HOV High-occupancy vehicle Ibama Brazilian Institute of the Environment and Renewable Natural Resources ICCT International Council on Clean Transportation IEA International Energy Agency IEC International Electrotechnical Commission IGES Institute for Global Environmental Strategies Inmetro National Institute of Metrology, Standardization and Industrial Quality INTD Intended nationally determined contribution IPI Tax on Industrialized Products ISO International Organization for Standardization LCFS Low-Carbon Fuel Standard Mcid Ministry of Cities MCTIC Ministry of Science, Technology, Innovation and Communications MDIC Ministry of Industry, Foreign Trade and Services MMA Ministry of the Environment MME Ministry of Mines and Energy MWh Megawatt hour NDC Nationally determined contribution NMHC Non-methane hydrocarbon NOx Nitrogen oxides NTU National Association of Urban Transportation Companies O3 Tropospheric ozone PDE Ten-Year Energy Plan
Petrobras		 Brazilian Petroleum Corporation
PHEV		 Plug-in hybrid electric vehicles
MP		 Particulate matter
Proconve		 Program for the Control of Air Pollution by Motor Vehicles
R&D		 Research and development
RMSP		 São Paulo Metropolitan region
SAE		 Society of Mobility Engineers
SIN		 National Interconnected System
Sindipeças		 National Union of the Motor Vehicle Components Industry
SPTrans		 São Paulo Transporte S.A.
TCO		 Total cost of ownership
tep		 Tonne of oil equivalent
EPA		 United States Environmental Protection Agency
UNFCCC		 United Nations Framework Convention on Climate Change
V2G		 Vehicle to grid
VAT		 Value-added tax
VKT		 Vehicle kilometers traveled
WHO		 World Health Organization
WTW		Well-to-wheel
ZeEUS		 Zero Emission Urban Bus System
ZEV		 Zero Emission Vehicle
TABLE OF CONTENTS
EXECUTIVE SUMMARY.......................................................................................... 9

1 INTERNATIONAL EVALUATION OF ELECTROMOBILITY POLICIES.......................... 14
Clean vehicle and fuel regulations............................................................................................15
Consumer incentives..............................................................................................................17
Charging infrastructure...........................................................................................................22
Planning, policy, and other promotions.....................................................................................25
Summary of international evaluation........................................................................................30

2 MOTIVATION FACTORS FOR VEHICLE ELECTRIFICATION IN BRAZIL..................... 33
Brazilian electric vehicle market overview.................................................................................33
Fuel consumption and CO2 emissions in the transportation sector...............................................34
Energy security and trade balances..........................................................................................37
Energy efficiency....................................................................................................................38
Air quality and noise...............................................................................................................38
Electricity generation mix in Brazil...........................................................................................40

3 CONTEXTUALIZATION OF ELECTROMOBILITY POLICIES FOR BRAZIL................... 43
Mapping key actors................................................................................................................43
Clean vehicle and fuel regulations............................................................................................48
Consumer incentives..............................................................................................................49
Charging infrastructure...........................................................................................................50
Planning policies and other promotions....................................................................................51

4 DEEP-DIVE ON PUBLIC TRANSPORTATION IN BRAZIL.......................................... 54
Municipal law on climate change: the case of São Paulo.............................................................54
Environmental benefits of bus electrification.............................................................................55
Captive fleets of public transportation and new business models................................................56
Production capacity for electric buses in Brazil..........................................................................57

5 TRANSIT BUS ELECTRIFICATION TOTAL COST OF OWNERSHIP ASSESSMENT........ 59
Total cost of ownership approach............................................................................................59
Fleet overview and data sources..............................................................................................60
Uncertainties and sensitivity analysis........................................................................................66
Life-cycle costs for fleet replacement.......................................................................................70
Climate emissions benefits of fleet electrification and social cost valuation..................................71
Summary...............................................................................................................................73
6 CHALLENGES AND OPPORTUNITIES FOR ELECTROMOBILITY IN BRAZIL............... 75

ANNEX A. VALIDATION SEMINAR – CONTRIBUTIONS TO THE ISSUE OF
ELECTROMOBILITY IN PUBLIC TRANSPORTATION................................................. 76

REFERENCES...................................................................................................... 79
EXECUTIVE SUMMARY

Transportation electrification is commonly seen as a key                        SALES OF EVS ARE INCREASING
measure to reduce greenhouse gas (GHG) emissions and                            SUBSTANTIALLY IN KEY VEHICLE MARKETS
mitigate climate change. Many urban environments are also
grappling with severe air pollution and the resulting threats                   Efforts to support the EV market are beginning to take
to public health, and cities are increasingly evaluating                        hold, and the early market steadily grows each year. Figure
and implementing robust policies to encourage the                               ES-1 illustrates the dramatic growth in annual global light-
adoption of electric vehicles (EVs). Governments are also                       duty EV sales since 2010, with ten markets accounting for
interested in the economic, industrial, and employment                          over 90% of total global sales. In 2017, EV sales surpassed
benefits from local development and manufacturing of                            1.2 million units, with China representing approximately
emerging technologies such as EVs and their supporting                          half. Cumulative global sales since 2010 surpassed 3
infrastructure. Research shows that countries that adopt                        million in November 2017 (ZEV Alliance, 2017). The
stringent environmental standards and a coordinated                             market for plug-in and electric vehicles in Brazil is, as of
strategy for electromobility secure early-mover advantage                       yet, nearly non-existent, with less than 200 cumulative
for their firms, leading to the conditions that allow for                       new EVs in the 2010-2017 period.
industrial competitiveness in international markets.
                                      1,200,000
                                                                                                                           Rest of the world

                                                                                                                           China
                                      1,000,000
      Annual eletric vehicles sales

                                                                                                                           Japan

                                                                                                                           Canada
                                       800,000
                                                                                                                           United States

                                       600,000                                                                             Netherlands

                                                                                                                           France

                                       400,000                                                                             Germany

                                                                                                                           United Kingdom

                                       200,000                                                                             Norway
                                                                                1

                                             0
                                                  2010   2011   2012   2013     2014     2015      2016       2017
Figure ES-1 | Annual global EV sales from 2010 through 20171

Electric buses, while smaller in volume, have also                              by urban pollution and supported with strong government
experienced high growth rates. Global electric bus stock                        financial incentives, infrastructure, and industrial policy.
more than doubled from 170,000 in 2015 to 345,000 in                            Electric buses in the United States and Europe are rapidly
2016 (IEA, 2017). More than 99% of the global electric bus                      reaching commercial deployment. In Brazil, there are
stock is in China, with rapid procurement driven largely                        about 296 electric trolley buses in circulation in São Paulo.

1
    Numbers include plug-in hybrid, battery electric, and fuel cell vehicles.
                                                                                                                                               10
EV UPTAKE LARGELY FOLLOWS THE LEVEL OF that currently limit vehicle eligibility could be modified or
GOVERNMENT ACTION AND SUPPORT extended to include the broader vehicle market.
Research on international experiences shows that Local support policies in leading cities are carefully tailored
government action – vehicle and fuel regulations, consumer to fit local contexts. For example, major cities in China,
incentives, charging infrastructure programs, planning, and suffering from heavy congestion and air pollution, have
local policies and initiatives – help to overcome barriers implemented strict vehicle registration quotas. As a result,
related to EV model availability, higher upfront costs, exempting EVs from this quota makes them very attractive
functional electric range and range anxiety, and overall to residents and sends a strong signal that electric mobility
lack of awareness and understanding. As a result, EV is the future. Additionally, some of these cities in China
uptake varies substantially, largely in parallel with the level allow electric cars to drive even on days when internal
of government action and support policies at the national, combustion engines are banned from circulation. In
provincial, and local levels. In the early years when EV California, congestion in major cities makes access to high-
production is low, automakers have tended to focus their occupancy vehicle lanes on freeways a valuable perk.
EV marketing and deployment efforts in regions with the
most supportive policies in place (Lutsey, 2015). Table Similarly, electric buses are being deployed where supporting
ES-1 summarizes the EV promotion actions considered in policies have been put in place. Around 99% of the global
this evaluation and their implementation in major markets, electric bus fleet on roads today is in China. Driven by the
which account for over 90% of cumulative global EV sales. urgent need for clean air, the central and local governments
have supported the electric bus transition with a strong
Although the data in the table is specific to light-duty policy vision and procurement targets, significant financial
vehicles, the policies are also applicable for public and purchase incentives, charging infrastructure support, and
private urban fleets, which are the focus of this study. Many friendly industrial policy for local bus manufacturing.
of the policies in place internationally are supporting the Between 2009 and 2017, Shenzhen converted its entire
electrification of passenger cars, commercial vehicles, and fleet of 16,000 buses to electric, a major success story that
buses; however, depending on the government decision, is ripe for further evaluation and understanding of the key
some policies only target a specific vehicle type. Programs lessons learned and best practice implementation strategies
that can be shared more broadly.
Table ES-1. Public EV promotion actions in selected areas
Area Approximate 2017 Clean vehicle and Consumer incentives Charging Planning, policy, and other
sales and sales fuel regulations infrastructure promotions
shares
Subsidies for vehicle purchase
Standard protocols for EVSE
Exemption from annual fees
Low-emission vehicle zones
Discounted or free charging
Preferential parking access
EVSE incentives or funding
Tax exemptions for vehicle
Electric-mobility strategy
Clean fuel standards that
Fuel efficiency standards
Outreach and awareness
EV-ready building codes
Clean vehicle mandates
Preferential lane access
Demonstration projects
Procurement targets
Financing programs
Direct deployment
credit electricity
Fleet initiatives
purchase
Canada 19,000 0.9% / X / / / X / / X / / / /
China 600,200 2.1% X X X X X / / X / / X X / X X /
France 36,900 1.8% X X X X / X X X X / / / X /
Germany 53,500 1.6% X X X X / / X / X X X X X X X X
Japan 55,900 1.1% X X X X X X X / X X / / X
Netherlands 9,200 2.2% X / X X X / X X X X X X X X X /
Norway 62,200 39.2% X X X X / X X X / X X X / X /
UK 48,400 1.9% X X X X / / X X X / X X X X X /
USA (excl. 96,000 0.7% / X X / / / / / / X / / X X / / /
California)
California 96,500 4.9% X X X X X / X X X X X / X X X X X
x denotes national program and / means smaller local or regional program.
Data retrieved from Hall and Lutsey (2017a, 2017b), Hall et al. (2017a, 2017b), Jin and Slowik (2017), Lutsey (2015), Slowik and Lutsey (2017), Tietge et
al. (2016), Yang et al. (2016). 2017 sales and sales shares based on CNCDA (2018) and EAFO (2018).
EXECUTIVE SUMMARY 11NATIONAL EXPERIENCE TO ENCOURAGE and decarbonization targets. They could also provide a
ELECTROMOBILITY HAS BEEN INSUFFICIENT basis for better articulation across multiple technology
WHEN COMPARED TO INTERNATIONAL BEST research and development (R&D) initiatives. Rota 2030,
Brazil’s new policy for industrial competitiveness,
PRACTICESS
could represent an opportunity to drive the rhythm of
Brazil has not yet adopted the comprehensive EV promotion electrification, encouraging coordinated action in R&D,
policies that are being implemented in the leading electric industry investments and leveraging complementary
markets depicted in Figure ES-1 and Table ES-1 above. action such as charging infrastructure investments.
Brazil’s efficiency targets for light-duty vehicles are
insufficient to encourage increased EV model availability Brazil needs to clearly articulate their motivations for
to launch the EV market. There are no substantial upfront electromobility so that they are translated into public
incentives to promote consumer EV sales. The regulations policies and implemented as complementary actions
and incentives in China, Europe, and the United States and programs. A key lesson learned is that, without
have made these the dominant EV markets around the clear motivations, as it is currently the case in Brazil,
world. In addition, there is no charging infrastructure plan this integration of efforts rarely happens. To contribute
in Brazil to ensure home charging or to instill broader to this debate, this study evaluated key motivations for
market confidence with public charging ecosystem. Finally, electromobility in Brazil accounting for energy sources
Brazil does not have planning, promotional activities, in transportation and the power sector in the country.
and awareness measures comparable to those in major Transport electrification brings significant reductions
international EV growth markets. in emissions of GHGs and local air pollutants, lowers
energy consumption due to higher engine efficiency,
To embrace international best practices, Brazil should and promotes energy security, amongst others. Even
build from existing projects to develop policies to accounting for a higher participation of biofuels compared
overcome EV barriers. A focus on urban buses makes to other countries, national energy projections still indicate
sense in the near and medium term because of Brazil’s a predominance of fossil fuels in transport in the short
reliance on diesel, which would leverage the benefits and long term. Additionally, power generation is and will
from electrification together with investments in urban continue to be composed of over 80% renewables, which
mobility. First, Brazil should implement stronger efficiency augments the environmental benefits from electrification.
targets and expand them to buses and trucks to ensure In large cities, large auto fleets will increase by 44% by
EV models are deployed as they approach cost parity in 2030, and air quality, already above the guidelines from the
the approximate 2025 timeframe. Second, with respect World Health Organization guidelines for most Brazilian
to the upfront cost differential between electric and cities, will worsen.
combustion vehicles, Brazil could modify import and
registration taxes to exempt or incentivize plug-in and
battery electric vehicles. In the case of urban buses, new ELECTRIC DRIVE TECHNOLOGIES CAN BE
financing models that include battery leasing and possibly MORE COST-EFFECTIVE
charging infrastructure (e.g., photovoltaic panels) should
be evaluated. Third, regarding charging infrastructure, One of the most important considerations when evaluating
an important starting point for Brazil would be to offer the potential for electric drive transition is the cost of
tax exemptions and cost-share charging infrastructure. these alternative technologies relative to conventional
Finally, to begin to expand consumer awareness and combustion engines. Electric drive technologies, such as
understanding, Brazil could invest in public campaigns that hybrid electric or battery electric vehicles, require greater
emphasize the benefits of electrification, in particular with capital expenditures for procurement, and, in the case of
respect to public buses. battery electric vehicles, charging infrastructure. However,
these technologies also offer the potential for operational
All of these actions would gain from coordinated action to cost savings from, for example, reduced fueling and
overcome technical, economic, and infrastructure barriers. maintenance costs, which can make them competitive with
However, Brazil has so far focused on isolated initiatives, combustion vehicles when lifetime costs are considered.
mostly involving demonstration projects, research Thus, a key question for electric drive transitions is the
studies, and tax incentives, still with modest or unclear degree to which operational savings offset the higher capital
results. There are no coordinated policies or initiatives to costs associated with these alternative technologies.
promote electromobility in the country. Near- and long-
term national energy plans would better signal vehicle This study compared the total cost of ownership (TCO) of
electrification as a viable alternative to energy efficiency electric drive and conventional combustion technologies,
EXECUTIVE SUMMARY 12and alternative bus technology in São Paulo2
using the São Paulo municipal transit fleet as a case study
to explore the costs of electric drive bus transitions in
Brazil. The evaluation included lifetime costs and emissions THE ELECTRIFICATION OF URBAN BUSES IS A
of black carbon and GHGs from conventional diesel, NEAR-TERM PRIORITY
biodiesel, diesel hybrid electric, battery electric, and fuel
cell electric buses. The analysis found life-cycle costs for While most of the international media attention focuses
diesel hybrid electric and battery electric bus technologies on electric passenger cars, a more adequate focus for
to be competitive with those for P7 (current regulatory Brazil in the near term is the electrification of urban buses,
standard for vehicle emissions in Brazil) diesel buses for which would combine the benefits from electrification with
most of the bus types in the São Paulo fleet. Figure ES-2 investments in urban mobility.
illustrates the differences in TCO for a Padron LE bus, one
of the most typical bus configurations in São Paulo. Electric buses would bring a series of environmental
improvements, including better urban air quality and
In addition to lower costs, a transition to electric buses public health, less noise, and lower emissions of climate
in São Paulo would result in significant reduction of GHG pollutants. The majority of urban buses rely on diesel
and black carbon emissions. Accounting for the monetized technology, which represent the lion’s share of emissions
climate and health damage (not included in the results in of particulate matter and nitrogen oxides, two of the most
Figure ES-2), diesel hybrid electric and battery electric important air pollutants contributing to worsen public
buses would reduce TCO by 10% and 27%, respectively. It health. The replacement of diesel buses with electric
is important to emphasize that these results reflect current buses would eliminate tailpipe emissions while improving
costs, which will likely decrease substantially in future noise pollution. In addition, the replacement of diesel
years as technology improves and production volumes with electricity that is roughly 80% renewable would bring
increase. In contrast, transitions to a biodiesel bus fleet sizeable climate benefits.
are estimated to be slightly more costly than conventional
diesel buses, and could also significantly increase well- In addition to environmental benefits, investments in
to-wheel climate emissions due to relatively high land use electric urban buses align well with government incentives
emissions assumed in this analysis for soy-based biodiesel. towards urban mobility and the promotion of public
transit over individual motorization. Urban mobility has
brought to the forefront increasingly complex problems
3.55 (+90%)
3.5 related to the uncontrolled growth of cities, and vehicle
technology should not be dissociated from the main
10-year total cost of ownership (million R$)
0.52
3.0 mobility principles and guidelines. Based on guidelines
of the National Policy on Urban Mobility, in addition
2.5
1.36
to prioritizing non motorized and public transportation
over motorized individual transportation, scientific and
2.0
1.87
1.99 (+6%)
1.91 (+2%) technology development and the use of renewable and
1.80 (-4%)
0.41
0.47 1.69 (-9%) 0.31 cleaner energy sources must be encouraged.
1.5 0.36
0.31 0.42
0.44
0.49
The comparative cost analyses of bus technologies
1.0
1.02 1.07
0.78
0.34 presented in this study, with advantages for electric
0.17
buses, reinforce the opportunities for electrification and
1.25
0.5
0.77
strengthen their business case. As Brazil is already in a
0.77
0.44 0.45
0.66 position to migrate to this niche more speedly, considering
0.0
Euro VI Euro VI BEB BEB FCEB
the cost and production capacity advantages, the efforts
P7 diesel
biodiesel diesel HEB depot on-route to overcome barriers would bring innumerable benefits.
charge charge
Lower operating and total costs may reduce tariffs, and
Maintenance Net infrastructure acquisition leverage the nation’s industrial competitiveness position
Operating Net bus acquisition for new technologies.
Figure ES-2 | Total cost of ownership over 10 years for conventional Brazil can leverage São Paulo’s commitment to zero
2
Data labels indicate contributions of individual cost components to TCO estimates. Percentages show change in TCO relative to the baseline P7
diesel technology. Acquisition costs include down payment and loan payments minus any bus resale value at the end of the ownership term.
EXECUTIVE SUMMARY 13emission buses. With over 14,000 buses transporting 9.5 understanding. A system of vehicle and fuel regulations,
million passengers per day, São Paulo’s experience could consumer incentives, charging infrastructure programs,
be replicated in other cities, especially with support to planning, and local policies and initiatives are a proven path
overcoming barriers through better coordinated public overcoming EV adoption barriers and driving adoption. This
policies. Other Brazilian cities could adopt emission would bring benefits in terms not only of energy efficiency
reduction targets for their public transportation service and emissions but also of industrial competitiveness. Over
concession contracts, further increasing the demand for 75% of global EV sales are manufactured in the same region
electric buses. in which they are sold. Brazil has an opportunity to learn
from leading global examples and lead the growing South
American market. Setting clear volume targets and providing
BRAZIL CAN BE PART OF A GLOBAL financial incentives ultimately have vested governments
TRANSITION TO ELECTROMOBILITY and companies in developing an EV market and domestic
manufacturing base (Lutsey et al., 2018).
Regions across North America, Europe, China, and
elsewhere are developing long-term regulatory policy, The first challenge is to position vehicle electrification,
implementing incentives, and deploying charging particularly for public transportation, and to internalize it as
infrastructure to support the EV market. Markets in Europe a public policy, which would lead to a natural coordination
and China, especially, are experimenting with similar and of efforts to accelerate its introduction. The various key
even bolder policies that explicitly promote EVs. Every actors would have a unique understanding and move in
region including Brazil can learn from these experiences the same direction. The development of knowledge, now
regarding the identification of which measures work best dispersed across research centers and universities, would
and which can be improved. Expanding the application of be channeled into common work streams, thus improving
best-practice promotion policies will continue to accelerate final results. Additional investments would be made by the
the transition to a global EV fleet. private sector based on firmer policy signals, scale gains
would be achieved, and cost barriers would be reduced.
A major challenge for electrification in Brazil is to go The automotive industrial policy, currently under discussion,
beyond current solutions for GHG mitigation and energy would clearly follow such policy signals, increasing the
security, currently focused on biofuels, and advance toward competitive advantages for Brazil vis-à-vis opportunities
complementary alternatives. Biofuels, a praiseworthy in international markets. Energy plans would incorporate
solution for Brazil considering its agricultural vocation, do consistent advances towards electrification. Additional
not improve urban air quality, nor do they reduce long-term efforts to improve electric bus technology and operations
GHG emissions considering the projected fleet growth. In would intensify, with positive results.
the case of biodiesel, the limitations are stronger due to
its indirect land use changes that can offset its climate The international experiences to stimulate electromobility
benefits, and potential restrictions on production capacity. have indicated a wide range of alternatives to be considered
Along a pathway towards transportation decarbonization, in the Brazilian context. Again, these experiences can serve
vehicle electrification would complement biofuels, with as inspiration for actions to be taken once there is a clear
added gains in energy efficiency that cannot be obtained policy path to follow. Subsequent steps will naturally arise
with conventional technologies. The Brazilian electricity from coordinated efforts, and mechanisms for monitoring
generation matrix, strongly based on renewable energy and evaluation of results may require adjustments to the
even in future projections, would leverage the benefits routes adopted as an evolutionary process of public policies.
from electromobility.
.
It is important to enact policies that help remove the barriers
to model availability, higher upfront costs, functional electric
range and range anxiety, and overall lack of awareness and
EXECUTIVE SUMMARY 141
INTERNATIONAL EVALUATION
OF ELECTROMOBILITY
POLICIES
This evaluation of international electric mobility public electric buses are being discussed in select markets in
policies is focused on light-duty passenger vehicles South America, including Chile and Colombia, they are
including public and private fleets, buses, and urban in relatively early stages of development and thus not
delivery vehicles. The geographic scope includes the included in this evaluation. This chapter provides an in-
major markets in North America, Europe, and Asia, and depth look at the various public policies and initiatives that
the analysis highlights emerging developments in India are supporting electric mobility development, divided in
when relevant. Although preliminary policies for public the four categories listed in Table 1-1.
Table 1-1 | Government promotion actions for EVs
Category Action
Clean vehicle and fuel regulations • Clean vehicle mandates
• Fuel efficiency standards
• Clean fuel standards that credit electricity
Consumer incentives • Vehicle purchase incentives (subsidies and tax exemptions)
• Exemptions from annual fees
• Preferential lane access
• Preferential parking access
• Discounted/free charging
• Financing programs
Charging infrastructure • Standard protocols for EVSE
• EVSE incentives or funding
• Direct deployment
• EV-ready building codes
Planning, policy, and other promotions • Procurement targets
• Electric-mobility strategy
• Outreach and awareness
• Demonstration projects
• Fleet initiatives
• Low-emission vehicle zones
Some of the public policies and actions included in this The following sections analyze the various actions and
assessment are designed to encourage the adoption of their potential impacts on electric vehicle (EV) adoption,
privately-owned electric cars. However, they are often according to the four categories indicated in Table 1-1,
highly applicable to other ownership models (privately- namely clean vehicle and fuel regulations; consumer
owned, public fleets, private fleets) and vehicle types incentives; charging infrastructure; and planning, policy,
(passenger cars, light commercial vehicles, buses). In and other promotions. The last section in this chapter
theory, these policies could be modified or extended to summarizes the findings from this analysis and provides
include the broader market. several anecdotes. The evaluation includes a discussion
of key factors for success, best practice elements, and
potential challenges, when applicable.
15CLEAN VEHICLE AND FUEL REGULATIONS and job growth in clean vehicle technology in California.
Similar policies could be introduced or extended to include
This section summarizes the clean vehicle and fuel requirements for public or private fleets, urban delivery
regulations supporting EV adoption around the world. The vehicles, or other vehicle modes.
actions assessed here include clean vehicle mandates, fuel
efficiency standards, and clean fuel standards. At the local level, London has introduced licensing
requirements for new taxis starting 2018. All taxis seeking
CLEAN VEHICLE MANDATES initial licensing must be zero-emission capable (i.e.,
plug-in hybrid electric or all-electric). In 2020, similar
The major markets of California and China have introduced requirements extending to other for-hire vehicle fleets
sales quotas for EVs. The programs incrementally require phase in (Transport for London, 2018). The policies create
greater EV sales over time by placing annual mandatory EV major disincentives for fleets that do not comply with the
sales requirements for auto manufacturers. The programs emission standards by establishing a daily charge. The
significantly boost EV markets and push automakers announcements have sparked actions from the private
for greater EV model availability and greater marketing for-hire sector as a result. Uber, for example, is exploring
efforts (NESCAUM, 2016, 2017). Consumer vehicle make paths to integrate fully EVs into its platform, citing
and model preferences vary widely, so the availability of a forthcoming regulations regarding tailpipe emissions as a
range of EV models is a key factor in the broader adoption key motivation (Lewis-Jones & Roberts, 2017).
of EVs (see, e.g., NRC 2015).
FUEL EFFICIENCY STANDARDS
California’s Zero Emission Vehicle (ZEV) regulation
requires 8% of new vehicle sales to be electric in 2025 Most major vehicle markets have established fuel
(CARB, 2017a). The state accounts for half of the United economy or greenhouse gas (GHG) emissions standards
States EV market, underscoring the major impact of direct for passenger vehicles and light commercial vehicles.
requirements for EVs (Lutsey, 2017). China’s 2017 New Such regulations reflect the commitment of governments
Energy Vehicle mandate policy is similar to California’s to improve global environmental health, ensure energy
program and requires approximately 4% of new vehicle security, mitigate climate change, protect consumers’
sales to be electric in 2020 (Cui, 2018). The programs economic interests, and drive technological innovation
are globally unique by mandating EV deployment with (Yang and Bandivadekar, 2017). The United States is
enforceable fines (Lutsey, 2015). With China as the world’s among the leading markets with regard to the stringency
largest automobile market, the New Energy Vehicle of the emission standards adopted. To some extent, the
policy is a global milestone that will surely accelerate U.S. regulations are promoting greater EV uptake.
transportation electrification globally. Similar yet smaller
programs include Québec’s ZEV standard, which came U.S. Environmental Protection Agency (EPA), for example,
into effect in January 2018 (MDDELCC, 2018). estimates that only about 5% of the national new light-duty
vehicle sales will need to be plug-in electric to comply with
Only light-duty passenger vehicles are included under the 54.5 fleet mile-per gallon (163g CO2-e/mi) target in
the mandate programs in China, California, and Québec. 2025 (U.S. EPA, 2016). Figure 1-1 shows the U.S. fleet-
However, the policy in theory could extend to other wide CO2 target (left y-axis) by year (x-axis), and the
vehicle types. California for example has proposed the estimated EV sales share as a result of the standards (right
Innovative Clean Transit rule, which would phase in zero y-axis). The U.S. EPA’s estimate (5% by 2025) is shown,
emission bus procurement requirements for municipal along with a hypothetical extension of the standards into
transit agencies in the state (CARB, 2017b). As currently 2030, at 4-6% lower CO2/year. As shown, the EV share
drafted, the rule would require all bus purchases to be increases as a result of more stringent emission standards.
zero-emission by 2029 (CARB, 2017b). Such policies are
expected to significantly contribute to urban air pollution
reduction while spurring economic investment, innovation,
INTERNATIONAL EVALUATION OF ELECTROMOBILITY POLICIES 16300 40%
Eletric vehicle share of new vehicle sales
250 30%
Emissions (gCO2/mile)
200 20%
150 10%
2025: 5%
Electric vehicle share
2016: 1%
100 0%
2015 2020 2025 2030
Figure 1-1 | U.S. light-duty emission standards and estimated EV sales shares (2015-2030)3
Of course, less stringent standards would promote EVs to In 2017, the European Commission published its proposed
a smaller extent, putting more pressure on non-regulatory regulation for post-2020 CO2 targets for cars and light-
policies to develop the market (Lutsey, 2017). On its commercial vans. The proposal includes incentives and the
website, ICCT (2018) provides a global comparison of the following targets for zero- and low-emission vehicle sales of
fuel economy or GHG emissions standards for passenger both cars and light-commercial vans: 15% for 2025-2029
vehicles and light-commercial vehicles. and 30% for 2030 (Dornoff et al., 2018). There are currently
no penalties for failing to meet the targets.
The European Union first introduced mandatory CO2
standards for new passenger cars in 2009. Today, the Continuing to increase the stringency of fuel efficiency and
regulations have been finalized to 2020, setting the fleet CO2 standards will progressively promote more advanced
target to 95gCO2/km (Mock, 2014). Previous analysis shows vehicle technologies into the fleet, including EVs. Where
that the targets can be met by increasing conventional EVs receive incentives within the regulatory accounting (e.g.,
combustion vehicle efficiencies, thereby requiring zero or in China, Europe, India, and the U.S.), artificial incentives
a very low market share of EVs (Mock, 2017). However, can partially undermine the short-term benefits of the
the regulation includes incentives for EVs, namely by standards. For example, applying super-credits allows the
neglecting upstream emissions and allowing super-credits rest of the vehicle fleet to emit higher levels of emissions or
(i.e., counting each vehicle as it if were multiple vehicles). remain at lower miles-per gallon efficiencies which erode the
Despite these incentive provisions at the EU level, EV stringency of fuel consumption standards. This is the case
markets vary widely across member states; EVs had a 9.7% in the U.S., Europe, and China. Preventative measures and
share of new-vehicles in the Netherlands, but only a 0.7% policies could be implemented to minimize the degradation
share in Germany in 2015 (Mock, 2016). This illustrates of the standards as a result of EV incentive provisions (Cui,
the important role of fiscal and other non-regulatory EV 2018; Lutsey, 2017).
incentives in national and local levels (Tietge et al., 2016).
3
Based on efficiency technology and cost assessment for U.S. 2025-2030 light-duty vehicles (Lutsey et al., 2016).
INTERNATIONAL EVALUATION OF ELECTROMOBILITY POLICIES 17CLEAN FUEL STANDARDS THAT CREDIT ELECTRICITY are integrating electric buses, rail, and other low-carbon
transit options (CARB, 2018a).
British Columbia and California have adopted low-
carbon fuel policies that incentivize the use of low-carbon Clean fuels regulations provide strong long-term signals for
transportation fuels, including electricity, and impose the incremental decarbonization of transportation fuels.
deficits for higher-carbon fuels. In California, the Low- California’s program has the dual-benefit of generating
Carbon Fuel Standard (LCFS) requires decarbonization direct financial incentives for transportation electrification,
of transportation fuels by setting GHG emissions limits and thus is helping to overcome key market barriers related
and includes provisions to incentivize electricity as to affordability and charging infrastructure deployment.
a transportation fuel. The program offers a funding
mechanism by allowing low-carbon fuel providers to Other clean fuel standards currently promote EVs to
generate credits, thereby assisting EV charging providers. a lesser degree. The European Union’s Fuel Quality
LCFS credits help promote low carbon transportation Directive, for example, placed a mandatory target for fuel
across many vehicle modes, fuels, and income brackets suppliers to reduce life-cycle GHG emissions by 6% for
(CARB, 2018a). energy supplied for transportation in 2020. Electricity
can contribute toward the target (Official Journal of the
Under the LCFS program, electric utilities are required to European Union, 2015), which, however, is expected to
pass incentive credits to current or future EV customers. be met largely with first-generation biofuels together with
Several utilities (PG&E, LADWP, SMUD, SDG&E) launched upstream emission reductions (Bitnere & Searle, 2017).
consumer rebates (valued at about USD 500-600) in Continuing to increase the stringency of the standard would
2017 for EVs or their infrastructure. The program also do more to promote electrification as a transportation fuel.
provides separate credits to local transit agencies that
Table 1-2 summarizes international clean vehicle and fuel
regulations.
Table 1-2 | International clean vehicle and fuel regulations
Regulation Description Rationale Typical stake- Implications for EV adop-
holder tion
Clean vehicle Requires vehicle Commercialize National or Generate major market impact
mandates manufacturers to produce advanced technologies, provincial from direct sales requirements
more ZEVs long-term emission government and greater availability of EV
reductions models
Fuel efficiency Regulations to incrementally Limit CO2 emissions National or Currently push few EVs into
standards improve average vehicle fuel and reduce petroleum provincial the fleet
economy consumption government
Clean fuel Regulations to reduce Reduce emissions and National or Incentivize electricity as a low-
standards that the carbon intensity of petroleum consumption provincial carbon fuel supporting EV and
credit electricity transportation fuels government EVSE deployment
CONSUMER INCENTIVES 2017; Tal & Nicholas, 2016; Vergis & Chen, 2014; Vergis
et al., 2014; Yang et al., 2016; Zhou et al., 2016, 2017).
Consumer fiscal incentives to promote the adoption of EVs Many national and subnational governments offer one or
are in place in many nations and include vehicle purchase more consumer incentives. This section summarizes their
incentives, exemptions from annual fees, preferential implementation across several markets.
lane and parking access, discounted or free charging,
and vehicle financing. Such incentives help consumers VEHICLE PURCHASE INCENTIVES (SUBSIDIES & TAX
overcome key cost and convenience barriers, thereby giving EXEMPTIONS)
impetus to the early EV market while technology costs
fall and consumers become familiar with the technology Many governments provide fiscal incentives that reduce the
(Slowik & Lutsey, 2016). Numerous studies have shown purchase price for EVs. Such incentives fall into two broad
that purchase and other consumer incentives are linked to categories: subsidies and vehicle tax reductions. Subsidies
EV uptake (Hall & Lutsey, 2017a; Jin et al., 2014; Lutsey tend to be relatively transparent and direct, generally
et al., 2015, 2016; Mock & Yang, 2014; Slowik & Lutsey, with a vehicle-specific dollar value attached. Vehicle tax
INTERNATIONAL EVALUATION OF ELECTROMOBILITY POLICIES 18reductions can be much more variable, opaque, and are basis. Many regions have chosen to fully or partially
dependent on both the tax system and the vehicle specs exempt eligible EVs from at least one type of purchase tax.
(Yang et al., 2016). Norway, for example, levies high value-add tax (VAT) and
registration tax on vehicles. Battery electric vehicles (BEVs)
EV purchase subsidies are implemented at the national are fully exempt from both whereas plug-in hybrid electric
and provincial levels, and are available in many regions: vehicles (PHEVs) claim partial exemption (Slowik & Lutsey,
Canadian provinces (British Columbia, Ontario, Québec), 2016). Other regions with vehicle purchase tax reductions
China Central Government, regions in China (e.g., Beijing, include China, Denmark, France, Japan, Netherlands, and
Shenzhen, Shanghai, Hefei, and Hangzhou), France, United Kingdom (Yang et al., 2016).
Germany, India Central Government and some state
governments (e.g., Delhi), Japan, Korea, Sweden, the United Urban areas benefit from, and are constrained by, policy
Kingdom, many U.S. states (including California), and the at the regional and national level, especially for financial
U.S. federal government (Yang et al., 2016). France’s Bonus- incentives (Hall et al., 2017a). Figure 1-2 shows the value
Malus feebate system provides a subsidy for EV purchase of financial incentives for BEVs and PHEVs (bars, left-axis)
along with a system of fees for higher-emission vehicles, in several cities worldwide, as well as their respective sales
and thus helps to lock in revenue source durability. shares in 2016. As shown, the leading markets in terms of
EV sales shares tend to offer substantial fiscal incentives.
Vehicle purchase tax reductions are most commonly
implemented at the national level and on a one-time
$35,000 35%
Total incentive value for electric car
$30,000 30%
$25,000 25%
Electric vehicle share
$20,000 20%
$15,000 15%
$10,000 10%
$5,000 5%
$0 0%
Shanghai
Beijing
Tianjin
Shenzhen
Qingdao
Hangzhou
Taiyuan
Oslo
Amsterdam
Paris
Bergen
London
Utrecht
Stockholm
Rotterdam-Hague
Tokyo
Los Angeles
San Francisco
San Jose
New York
China Europe Japan U.S.
BEVs incentive PHEVs incentive EVs share of new 2016 sales
Figure 1-2 | Incentive value for BEVs and PHEVs and 2016 sales share in major EV markets (Hall et al., 2017a)
Researchers have studied the relationship between fiscal 2017). Research shows that incentives can be optimized to
incentives and EV adoption in more detail. A recent encourage EVs. In general, consumer financial incentives
multivariate linear regression analysis of 350 metropolitan that are substantial in value, available at the point of sale
areas worldwide identified consumer financial incentives for multiple vehicle and ownership types, crystal clear in
as statistically linked with greater EV uptake (Hall & Lutsey, value, and locked into place for several years tend to be
2017a). A separate analysis of 200 metropolitan areas in effective (Yang et al., 2016).
the U.S. also revealed a strong relationship (Slowik & Lutsey,
INTERNATIONAL EVALUATION OF ELECTROMOBILITY POLICIES 19You can also read