Implementation Approach for Electric Vehicles at Marine Corps Base Camp Lejeune: Task 4 - Stephen Schey Jim Francfort November 2015
←
→
Page content transcription
If your browser does not render page correctly, please read the page content below
INL/EXT-15-36476

Implementation Approach for
Electric Vehicles at Marine
Corps Base Camp Lejeune:
Task 4

Stephen Schey
Jim Francfort

November 2015

  The INL is a U.S. Department of Energy National Laboratory
  operated by Battelle Energy Alliance
DISCLAIMER
     This information was prepared as an account of work sponsored by an
agency of the U.S. Government. Neither the U.S. Government nor any
agency thereof, nor any of their employees, makes any warranty, expressed
or implied, or assumes any legal liability or responsibility for the accuracy,
completeness, or usefulness, of any information, apparatus, product, or
process disclosed, or represents that its use would not infringe privately
owned rights. References herein to any specific commercial product,
process, or service by trade name, trade mark, manufacturer, or otherwise,
does not necessarily constitute or imply its endorsement, recommendation,
or favoring by the U.S. Government or any agency thereof. The views and
opinions of authors expressed herein do not necessarily state or reflect
those of the U.S. Government or any agency thereof.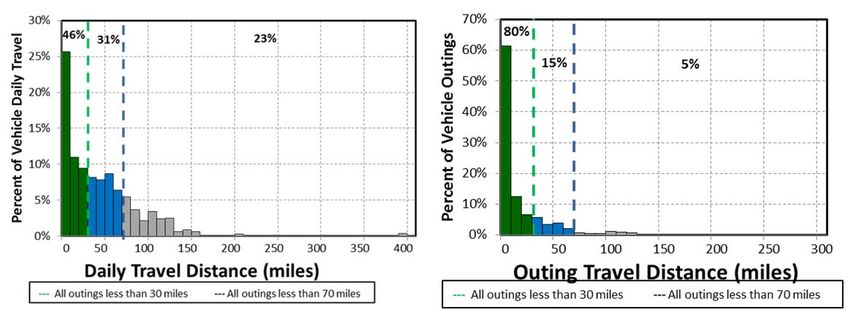
INL/EXT-15-36476

     Implementation Approach for Adoption of Electric
    Vehicles at Marine Corps Base Camp Lejeune: Task 4

                                      Stephen Schey
                                      Jim Francfort2

1
Stephen Schey, Project Manager, Infrastructure Planning and Analysis, Intertek Testing Services,
                                North America, Phoenix, Arizona
 2
  Jim Francfort, Vehicle Systems Principal Investigator, Idaho National Laboratory, operated by
                           Battelle Energy Alliance, Idaho Falls, Idaho

                                      November 2015

                             Idaho National Laboratory
                              Idaho Falls, Idaho 83415

                                    http://avt.inl.gov

                                    Prepared for the
                               U.S. Department of Energy
                                Office of Nuclear Energy
                            Under DOE Idaho Operations Office
                              Contract DE-AC07-05ID14517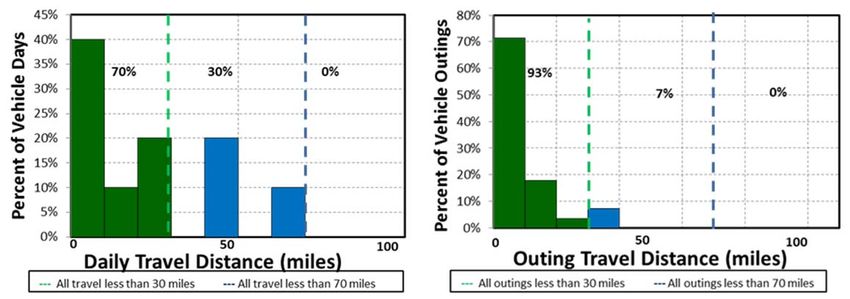
ABSTRACT
     Battelle Energy Alliance, LLC, managing and operating contractor for the
U.S. Department of Energy’s Idaho National Laboratory, is the lead laboratory
for the U.S. Department of Energy’s advanced vehicle testing. Battelle Energy
Alliance, LLC contracted with Intertek Testing Services, North America
(Intertek) to conduct several U.S. Department of Defense-based studies to
identify potential U.S. Department of Defense transportation systems that are
strong candidates for introduction or expansion of plug-in electric vehicles
(PEVs). This study focused on the Marine Corps Base Camp Lejeune (MCBCL),
which is located in North Carolina.
    Task 1 consisted of a survey of non-tactical fleet vehicles at MCBCL to
begin review of vehicle mission assignments and types of vehicles in service. In
Task 2, daily operational characteristics of vehicles were identified to select
vehicles for further monitoring and attachment of data loggers. Task 3 recorded
vehicle movements in order to characterize the vehicles’ missions. The results of
the data analysis and observations were provided. Individual observations of the
selected vehicles provided the basis for recommendations related to PEV
adoption (i.e., whether a battery electric vehicle or plug-in hybrid electric vehicle
[collectively referred to as PEVs] can fulfill the mission requirements). It also
provided the basis for recommendations related to placement of PEV charging
infrastructure.
   This Task 4 report focuses on an implementation plan for the near-term
adoption of PEVs into the MCBCL fleet.
    Intertek acknowledges the support of Idaho National Laboratory, Marine
Corps headquarters, and MCBCL fleet management and personnel for
participation in this study.

                                         iv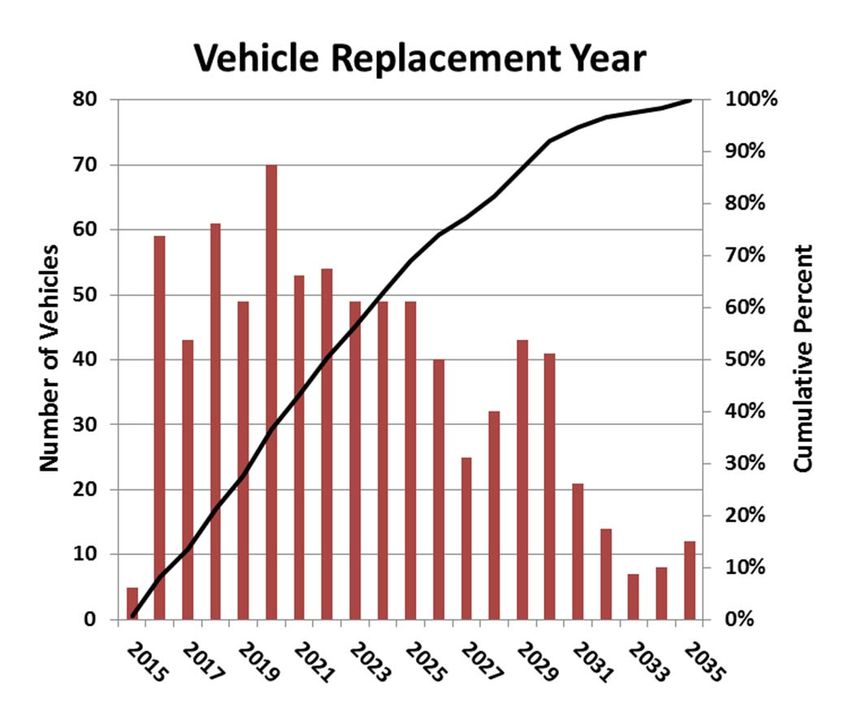
EXECUTIVE SUMMARY
                   Federal agencies are mandateda to purchase alternative fuel vehicles, increase
              consumption of alternative fuels, and reduce petroleum consumption. Available
              plug-in electric vehicles (PEVs) provide an attractive option in the selection of
              alternative fuel vehicles. PEVs, which consist of both battery electric vehicles
              (BEVs) and plug-in hybrid electric vehicles (PHEVs), have significant
              advantages over internal combustion engine (ICE) vehicles in terms of energy
              efficiency, reduced petroleum consumption, and reduced production of
              greenhouse gas emissions, and they provide performance benefits with quieter,
              smoother operation. This study intended to evaluate the extent to which Marine
              Corps Base Camp Lejeune (MCBCL) could convert part or all of their fleet of
              vehicles from petroleum-fueled vehicles to PEVs.
                  More fuel-efficient ICE vehicles, including hybrid electric vehicles, exist that
              may provide improvements for the current fleet; however, this study’s focus is on
              replacing ICE vehicles with suitable PEVs.
                   BEVs provide the greatest benefit when it comes to fuel and emissions
              savings because all motive power is provided by the energy stored in the onboard
              battery pack. These vehicles use no petroleum and emit no pollutants at their
              point of use. PHEVs provide similar savings when their battery provides all or a
              majority of motive power (depending on the PHEV design), but they also have
              the ability to extend their operating range with an onboard ICE. Because a PHEV
              can meet all transportation range needs, the adoption of a PHEV will be
              dependent on its ability to meet other transportation needs such as cargo or
              passenger capability. Operation of PHEVs in charge depleting-mode, where all or
              a majority of motive power is provided by the battery, can be increased with
              opportunity charging at available charging stations. However, not all PHEVs
              have a mode where the battery provides all motive power at all speeds. Previous
              work on this study focused on the non-tactical fleet of vehicles at MCBCL to
              identify a subset of 60 vehicles for data logging in an effort to identify vehicles
              that may be replaced with PEVs, with emphasis on BEVs that provide the
              maximum benefit. This report provides an approach for near-term adoption of
              PEVs at MCBCL.
                   MCBCL borders on the Atlantic Ocean near Jacksonville, North Carolina.
              The base and surrounding community is home to an active duty, dependent,
              retiree, and civilian employee population of approximately 170,000 people.
              MCBCL contains 156,000 acres and 11 miles of beaches.b Adoption of PEVs at
              MCBCL can have a positive effect on PEV adoption by the retiree and civilian
              population of the area.
                  The Task 3 report observed that a mix of BEVs and PHEVs are capable of
              performing most of the required missions using BEVs for the short trips and
              PHEVs for the longer trips. It also observed that replacement of vehicles in the
              current fleet could result in significant reductions in the emission of greenhouse
              gases and reductions in petroleum use, as well as reductions in fleet operating

a
  Energy Policy act of 1992, Energy Policy Act of 2005, Executive Order 13423, and Energy Independence and Security Act of
     2007.
b
  www.lejeune.marines.mil/About.aspx [accessed January 22, 2015].

                                                             v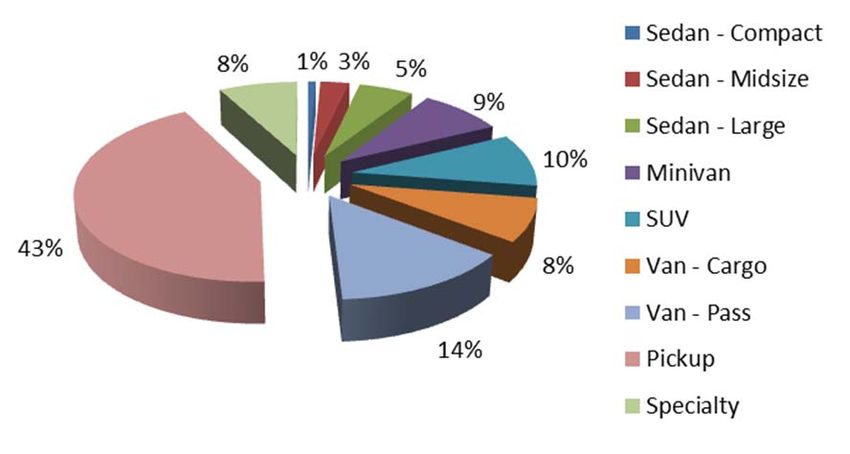
costs. The other Task 3 report identified potential PEV charging locations should
PEV replacements occur.
     This report presents a replacement approach for adoption of PEVs at
MCBCL. This approach provides a gradual introduction of PEVs into the
MCBCL operation and into the balance of the non-tactical fleet. The gradual
approach provides a transitional period to allow greater experience in operation,
maintenance, and support for PEVs in daily missions. The vehicles introduced by
this approach result in 50% of the fleet as PEVs by 2026, assuming the size of
the fleet remains as it was in 2015. The projected PEV adoption rate for sedans,
non-sedans, and total fleet is presented in Figure ES-1.

Figure ES-1. Projected PEV adoption rate at MCBCL.

     MCBCL will decide whether to adopt PEVs as provided by the General
Services Administration only, which now consists only of sedan-type vehicles, or
to justify the adoption of non-General Services Administration-listed vehicles.
While the greater emphasis and initial adoption is for General Services
Administration-listed vehicles, both approaches are presented in this report.

                                       vi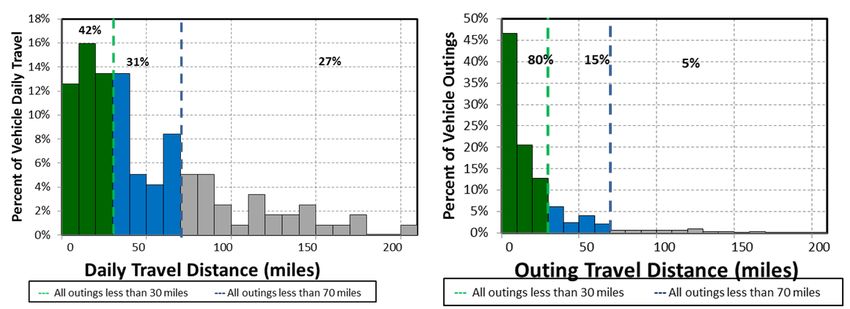
CONTENTS
ABSTRACT................................................................................................................................................. iv

EXECUTIVE SUMMARY .......................................................................................................................... v

ACRONYMS ................................................................................................................................................ x

1.       INTRODUCTION ............................................................................................................................ 11

2.       NON-TACTICAL VEHICLES ........................................................................................................ 12

         2.1       Vehicle Missions .................................................................................................................... 13

         2.2       General Services Administration Vehicle Replacement Requirements ................................ 14

         2.3       Plug-In Electric Vehicle Availability ..................................................................................... 15

         2.4       Plug-In Electric Vehicle Charging ......................................................................................... 17

3.       VEHICLE MISSION REPLACEMENT GUIDANCE .................................................................... 17

         3.1       Background and Methods ...................................................................................................... 17

         3.2       Pool Mission Guidance .......................................................................................................... 18

         3.3       Support Mission Guidance ..................................................................................................... 19

         3.4       Enforcement Mission Guidance ............................................................................................. 20

         3.5       Specialty Mission Guidance ................................................................................................... 21

4.       MARINE CORPS BASE CAMP LEJEUNE REPLACEMENT APPROACH .............................. 22

         4.1       Marine Corps Base Camp Lejeune Summary Replacement Approach ................................ 23

                   4.1.1       Replacement Approach for Sedans ........................................................................... 26
                   4.1.2       Replacement Approach for Non-Sedan Vehicles...................................................... 27

         4.2       Analysis Results – Commands Group.................................................................................... 28

                   4.2.1       Replacement Approach for Commands Group Sedans ............................................. 28
                   4.2.2       Replacement Approach for Commands Group Non-Sedan Vehicles ....................... 29

         4.3       Analysis Results – Marine Corps Installations East Fleet...................................................... 29

                   4.3.1       Replacement Approach for Marine Corps Installations East Group Sedans............. 30
                   4.3.2       Replacement Approach for Marine Corps Installations East Group
                               Non-Sedan Vehicles .................................................................................................. 30

         4.4       Balance of Marine Corps Base Camp Lejeune Fleet ............................................................. 31

                                                                            vii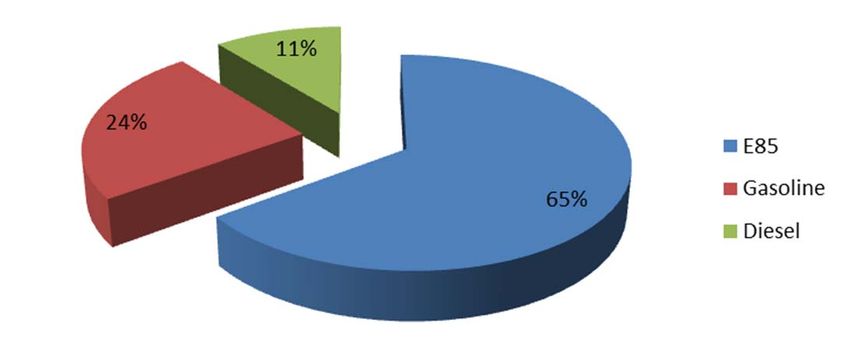
5.      PLUG-IN ELECTRIC VEHICLE CHARGING INFRASTRUCTURE .......................................... 31

        5.1       Plug-in Electric Vehicle Charging Infrastructure for Sedans................................................. 32
        5.2       Plug-in Electric Vehicle Charging Infrastructure for Non-Sedans ........................................ 32

6.      OBSERVATIONS ............................................................................................................................ 33

Appendix A, Commands Group Vehicle Data Sheets ................................................................................ 34

Appendix B, Marine Corps Installations East Vehicle Data Sheets ........................................................... 44

Appendix C, Commands Fleet Vehicle Replacement Approach ................................................................ 67

Appendix D, Marine Corps Installations East Fleet Vehicle Analysis ....................................................... 71

                                                                  FIGURES
ES-1.         Projected PEV adoption rate at MCBCL ..................................................................................... vi

1.            Vehicle type distribution for all non-tactical vehicles ................................................................ 12

2.            Fuel-type distribution for all vehicles ......................................................................................... 13

3.            Vehicle missions ......................................................................................................................... 14

4.            MCBCL pool vehicle daily and outing travel............................................................................. 18

5.            MCBCL support vehicle daily travel and outage distance ......................................................... 19

6.            MCBCL enforcement vehicle daily travel and outing travel ...................................................... 20

7.            MCBCL specialty vehicle daily travel and outage distance ....................................................... 21

8.            Full fleet vehicle replacement projection ................................................................................... 24

9.            Projected PEVs in MCBCL fleet ................................................................................................ 25

10.           PEV introduction of fleet sedan types 2015 through 2026 ......................................................... 26

11.           PEV introduction of fleet non-sedan types 2015 through 2026.................................................. 27

                                                                   TABLES
1.            MCBCL non-tactical fleet summary .......................................................................................... 12

2.            MCBCL monitored vehicles by group ....................................................................................... 12

                                                                          viii
3.    GSA vehicle replacement requirements ..................................................................................... 14

4.    GSA-certified PHEVs for 2015 .................................................................................................. 15

5.    GSA-certified BEVs for 2015 .................................................................................................... 15

6.    OEM PHEV cars and availability ............................................................................................... 16

7.    OEM BEV cars and availability ................................................................................................. 16

8.    OEM PHEV trucks and vans and availability ............................................................................ 16

9.    OEM BEV trucks and vans and availability ............................................................................... 17

10.   MCBCL pool vehicle travel summary ........................................................................................ 18

11.   MCBCL support vehicle travel summary ................................................................................... 19

12.   MCBCL enforcement vehicle travel summary ........................................................................... 20

13.   MCBCL specialty vehicle travel summary................................................................................. 21

14.   Projected fleet vehicle replacements at MCBCL ........................................................................ 23

15.   Projected approach for the introduction of PEVs into the MCBCL fleet ................................... 25

16.   Planned approach for the introduction of PEV sedans at MCBCL ............................................ 26

17.   Planned approach for the introduction of non-sedan PEVs at MCBCL ..................................... 27

18.   The anticipated replacement schedule for the Commands Group vehicles at MCBCL ............. 28

19.   Planned approach for the introduction of PEV sedans into the Commands Group .................... 28

20.   Planned approach for introduction of non-sedan PEVs into the Commands Group .................. 29

21.   Projected MCIE Group anticipated vehicle replacement schedule at MCBCL .......................... 29

22.   Planned approach for the introduction of PEV sedans in the MCIE Group ............................... 30

23.   Planned approach for the introduction of non-sedan PEVs in the MCIE Group ........................ 31

24.   EVSE infrastructure adoption for sedans ................................................................................... 32

25.   EVSE infrastructure adoption for non-sedan fleet ...................................................................... 32

26.   MCBCL charging infrastructure approach ................................................................................. 33

                                                               ix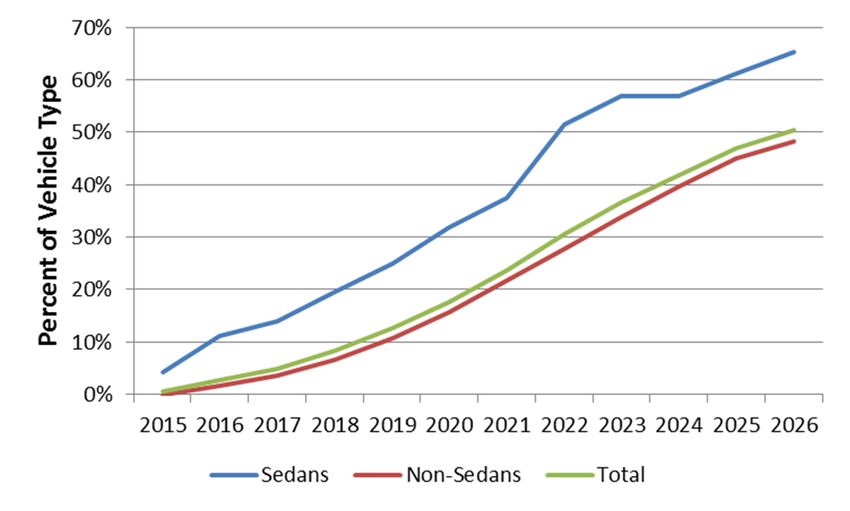
ACRONYMS
AC         alternating current
BEV        battery electric vehicle
DC         direct current
EPA        U.S. Environmental Protection Agency
EVSE       electric vehicle supply equipment
GHG        greenhouse gas emissions
GSA        General Services Administration
ICE        internal combustion engine
Intertek   Intertek Testing Services, North America
MCBCL      Marine Corps Base Camp Lejeune
OEM        original equipment manufacturer
PEV        plug-in electric vehicles
PHEV       plug-in hybrid electric vehicle
SUV        sports utility vehicle

                                                  x
Electric Vehicle Preparedness: Implementation
Approach for Plug-in Electric Vehicles at Marine Corps
Base Camp Lejeune: Task 4
1. INTRODUCTION
The U.S. Department of Energy and the U.S. Department of Defense signed a memorandum of
understanding on July 22, 2010, for strengthening coordination of efforts to enhance national energy
security and to demonstrate federal government leadership in transitioning the United States to a low
carbon economy. The memorandum of understanding included efforts in the areas of energy efficiency,
fossil fuels, alternative fuels, efficient transportation technologies and fueling infrastructure, grid security,
smart grid, and energy storage.
In support of the memorandum of understanding, the Idaho National Laboratory, with funding
provided by the U.S. Department of Energy’s Vehicle Technologies Office and Federal Energy
Management Program, directed Intertek Testing Services, North America (Intertek) to conduct several
U.S. Department of Defense-based studies to identify potential transportation systems that are strong
candidates for introduction or expansion of plug-in electric vehicles (PEVs). Intertek previously
conducted similar fleet, city, state, and countrywide studies using their micro-climate assessment process,
which consists of the following four main tasks:
Task 1: Conduct a non-tactical fleet and infrastructure assessment
Task 2: Select vehicles for mission and fleet characterizations
Task 3: Perform detailed assessment of selected vehicles and charging infrastructure needs
Task 4: Prepare adoption approach for PEV and charging infrastructure.
Assessment of the potential for replacing Marine Corps Base Camp Lejeune (MCBCL) fleet vehicles
with PEVs starts with an assessment of the fleet vehicles’ missions and vehicle characteristics. This
assessment was conducted through correspondence with fleet managers and records analysis. The Task 1
report titled, Assessment of Data and Survey Results for Marine Corps Base Camp Lejeune, dated January
2015, provided a summary and fleet assessment.
PEVs generally are classified into two vehicle types: battery electric vehicles (BEVs) and plug-in
hybrid electric vehicles (PHEVs). A BEV contains an onboard battery that provides all motive power.
PHEVs also have an onboard battery that provides some motive power but there is also another motive
power source (such as a gasoline engine). PHEVs have, in general, two modes: (1) charge-depleting (CD)
mode, where the battery provides all or most (depending on the PHEV design) motive power and the
battery is being depleted, and (2) charge-sustaining (CS) mode, where the non-battery power source
provides the majority of the motive power while being supplemented by the battery power with the
battery state of charge being maintained within a designed range. A BEV can be considered to operate
solely in CD mode. Collectively, BEVs and PHEVs are PEVs.
The Task 1 effort led to identification of fleet vehicles that appeared to be good candidates for
replacement by PEVs. The Task 2 report titled, Identification of Marine Corps Base Camp Lejeune
Vehicles for Installation of Data Loggers, dated February 2015, identified 60 vehicles within the
candidate groups for further monitoring and analysis through addition of vehicle data loggers. The data
loggers were installed and data were collected on the selected vehicles. The Task 3 report titled,
Utilization Assessment of Target Electrification Vehicles at Marine Corps Base Camp Lejeune, dated
August 2015, provided a summary and details of data collection for the monitored vehicles and
extrapolated that to the entire non-tactical fleet of vehicles at MCBCL. The other Task 3 report, titled,
Assessment of Charging Infrastructure for Plug-in Electric Vehicles at Marine Corps Base Camp
11Lejeune, dated August 2015, provided the related charging infrastructure assessment. This report provides
an implementation approach for adoption of PEVs at MCBCL in the next few years.
2. NON-TACTICAL VEHICLES
MCBCL reported 784 vehicles in its non-tactical fleet, not counting non-powered equipment,
low-speed vehicles, and heavy-duty trucks. The Task 1 report identified the 25 tenant commands
(i.e., Commands) and Marine Corps Installations East (i.e., MCIE) departments and divisions to which
the vehicles were assigned. Table 1 provides a summary of the vehicle types by class and group.
Table 1. MCBCL non-tactical fleet summary.
Sedan – Sedan – Sedan – Van Van
Compact Midsize Large Minivan SUV Cargo Pass Pickup Specialty Total
Commands 1 7 5 30 20 12 66 108 — 249
MCIE 5 16 38 37 56 50 43 228 62 535
Total 6 23 43 67 76 62 109 336 62 784
Figure 1 shows the vehicle type distribution for all vehicles for comparison.
Figure 1. Vehicle type distribution for all non-tactical vehicles.
MCBCL identified 60 vehicles for further study as described in the Task 2 report. Table 2 categorizes
the monitored vehicles. This distribution is approximately representative of the entire non-tactical fleet.
Table 2. MCBCL monitored vehicles by group.
Sedan - Sedan - Sedan- Van Van
Compact Midsize Large Minivan SUV Cargo Pass Pickup Specialty Total
Commands — — — 2 3 — 6 7 — 18
MCIE 2 2 — 3 6 4 2 21 2 42
Total 2 2 — 5 9 4 8 28 2 60
The fleet vehicles are used for a variety of purposes by several different divisions on base. Section 2.2
provides details about these purposes or missions. The category of the mission can be helpful in
identifying PEVs as potential replacements.
The initial survey also identified the fuel used by the fleet vehicles. In particular, MCBCL has
implemented a significant emphasis on E85 fuel used by a majority of the vehicles types. Diesel fuel is
12used primarily for specialty vehicles, larger pickup trucks, and cargo vans. Figure 2 illustrates fuel types
in use at MCBCL.
Figure 2. Fuel-type distribution for all vehicles.
2.1 Vehicle Missions
Vehicle mission is an important characteristic in the fleet study. Intertek has established the following
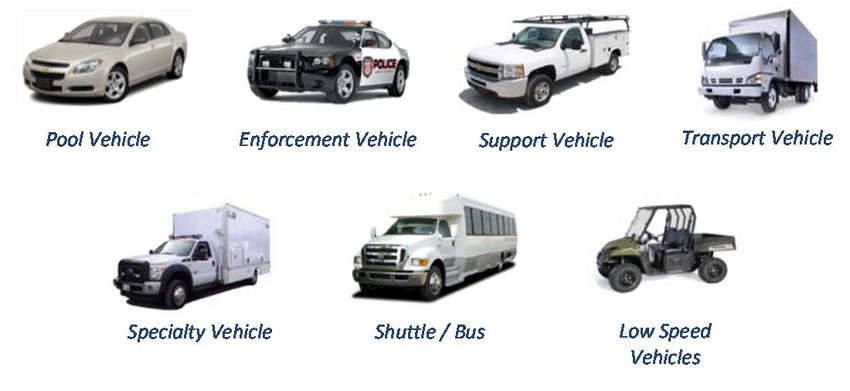
seven mission/vehicle categories for analysis. The categories are listed as follows and depicted in
Figure 3:
1. Pool vehicles: A pool vehicle is any automobile (other than the low-speed vehicle identified below)
manufactured primarily for use in passenger transportation, with not more than 10 passengers.
2. Enforcement vehicles: Vehicles specifically approved in an agency’s appropriation act for use in
apprehension, surveillance, police, or other law enforcement work. This category also includes site
security vehicles, parking enforcement, and general use, but the vehicles are capable of requirements
to support enforcement activities.
3. Support vehicles: Vehicles assigned to a specific work function or group to support the mission of
that group. Vehicles are generally passenger vehicles or light-duty pickup trucks and may contain
after-market modifications to support the mission.
2. Transport vehicles: Light, medium, or heavy-duty trucks used to transport an operator and tools or
equipment of a non-specific design or nature. The vehicle’s possible uses include repair, maintenance,
and delivery.
3. Specialty vehicles: Vehicles designed to accommodate a specific purpose or mission (such as
ambulances, mobile cranes, and handicap controls).
4. Shuttles/buses: Vehicles designed to carry more than 12 passengers and further outlined in
49 CFR 532.2.
5. Low-speed vehicle: Vehicles that are legally limited to roads with posted speed limits up to 35 or 45
mph (depending on state law) and that have a limited load-carrying capability.
Vehicle mission assignments can be useful for identifying the type of potential replacement PEV (see
Section 3).
13Figure 3. Vehicle missions.
2.2 General Services Administration Vehicle
Replacement Requirements
Table 3 presents the General Services Administration (GSA) replacement requirements for fleet
vehicles. Both the age and mileage requirements need to be met in order for the vehicle to qualify for
replacement, except where noted as “or.”
Table 3. GSA vehicle replacement requirements.
GSA Vehicle Replacement Requirements3
Fuel Type Years Miles
Passenger vehicles Gasoline or 3 36,000
alternative fuel 4 24,000
vehicle 5 Any mileage
Any age 75,000
Hybrid 5 Any mileage
Low-speed BEV 6 Any mileage
Light trucks 4 x 2 Non-diesel 7 or 65,000
Diesel 8 or 150,000
Hybrid 7 Any mileage
Light trucks 4 x 4 Non-diesel 7 or 60,000
Diesel 8 or 150,000
Hybrid 7 Any mileage
Medium trucks Non-diesel 10 or 100,000
Diesel 10 or 150,000
Heavy Trucks Non-diesel 12 or 100,000
Diesel 12 or 250,000
3
http://www.gsa.gov/graphics/fas/VehicleReplacementStandardsJune2011Redux.pdf [accessed March 12, 2015].
142.3 Plug-In Electric Vehicle Availability
The adoption of PHEVs and BEVs is the primary goal of GSA and it supports many directives in this
area. As GSA increases its certification of PHEVs and BEVs, agencies can plan for vehicle replacement
through GSA for passenger vehicles and trucks. GSA provides a summary of light and medium-duty
passenger vehicles available for lease or purchase through the GSA portal;4 however, not all BEVs and
PHEVs currently on the market are ‘certified’ to be GSA replacements. Vehicles not on the GSA list of
‘certified’ vehicles require an agency to self-certify a functional need or alternative measures for
exemptions. Tables 4 and 5 summarize the vehicles that may be suitable replacements and are certified
replacements through GSA. Note that the “CD/CS” column provides the U.S. Environmental Protection
Agency (EPA) fuel economy values for CD and CS modes of the PHEVs, while the city and highway fuel
economy values are provided for BEVs. The fuel economy of the PHEV CD mode and BEVs is provided
in units of miles-per-gallon-of-gasoline-equivalent (MPGe). This metric allows electricity consumption to
be compared with fuel consumption during CS mode (or against conventional vehicles). The Nissan Leaf
and Mitsubishi i-MiEV are not included in the alternative fuel guide for 2015, but they have appeared in
previous guides. For MCBCL, replacement is dependent on vehicle configuration characteristics and the
PEV’s ability to meet the vehicle’s mission.
Original equipment manufacturers (OEM) provide information related to a vehicle’s range in CD
mode and EPA provides test results. However, actual results may vary depending on several factors other
than travel that may also deplete a vehicle’s battery. These factors include changes in the battery’s
capacity over time, area topography, weather conditions (e.g., cabin cooling/heating), payload, and so
forth. This report will identify a BEV’s “safe range” as 70 miles because this typically is less than the
advertised range of most BEVs. The PHEV’s safe range in CD mode is 30 miles.
Tables 6 through 9 provide summaries of PHEVs and BEVs that are either currently available or near
commercialization in both passenger cars and pickup trucks, but do not appear on the GSA ‘certified’
vehicle list. These vehicles may qualify for use by the agency through demonstrating a functional need.
Table 4. GSA-certified PHEVs for 2015.
Make/Model GSA Class Type CD/CS GSA Incremental Price
Chevrolet Volt* Sedan, Subcompact PHEV 98 MPGe/37 mpg $17,692.17
Ford C-MAX Energi Sedan, Subcompact PHEV 88/38 mpg $14,062.23
Ford Fusion Energi Sedan, Compact PHEV 88/38 mpg $13,640.05
*The Chevrolet Volt has an all-electric CD mode rated for 38 miles. The Ford vehicles have blended CD modes rated for 20 miles.
Table 5. GSA-certified BEVs for 2015.
Make/Model GSA Class Type City/Highway GSA Incremental Price
Ford Focus Electric Sedan, Subcompact BEV 110/99 MPGe $11,351.15
Smart Fortwo ED Sedan, Microcompact BEV 123/93 MPGe $7,277.05
Note that EPA differs from GSA in vehicle class designation. EPA identifies the Volt as a compact,
the C-MAX Energi as a midsize, the Fusion Energi as a midsize, and the Focus as a compact.5
4
http://www.gsa.gov/portal/content/104211 [accessed August 1, 2014]
5
http://www.fueleconomy.gov/feg/Find.do?action=sbs&id=34130 [accessed August 1, 2014]
15Table 6. OEM PHEV cars and availability.
Initial Model Year/Estimated
Make EPA Class Model Year for Commercialization
Chevrolet Compact Volt 2011
Ford Midsize C-MAX Energi 2013
Ford Midsize Fusion Energi 2013
Toyota Midsize Prius PHEV 2012
Honda Midsize Accord PHEV* 2014
Cadillac Subcompact ELR 2014
Porsche Large Panamera S E-Hybrid 2014
BMW Subcompact i3 REx 2014
BMW Subcompact i8 2014
Hyundai Midsize Sonata PHEV 2015 (estimate)
Audi Compact A3 e-Tron 2016 (estimate)
Mercedes Subcompact C350 PHEV 2016 (estimate)
Mercedes Large S550 PHEV 2016 (estimate)
* Honda did not release a MY2015 Accord PHEV; the return of this vehicle model is uncertain.
Table 7. OEM BEV cars and availability.
Initial Model Year/Estimated
Make EPA Class Model Year for Commercialization
Nissan Midsize Leaf 2011
Ford Compact Focus Electric 2012
Tesla Large Model S 2012
Mitsubishi Subcompact i-MiEV* 2012
Fiat Mini 500e 2013
Honda Small Station Wagon Fit EV 2013
smart Two Seater Fortwo ED 2013
BMW Subcompact i3 2014
Chevrolet Subcompact Spark EV 2014
Kia Small Station Wagon Soul EV 2014
Volkswagen Compact e-Golf 2015
Mercedes-Benz Midsize B-Class Electric Drive 2015
Chevrolet Compact Bolt 2017 (estimate)
* Mitsubishi did not manufacture a MY15 i-MiEV; the vehicle returned in the 2016 MY.
Table 8. OEM PHEV trucks and vans and availability.
Initial Model Year/Estimated
Make EPA Class Model Year for Commercialization
Via Standard Pickup Truck VTRUX VR300 2013
Via Special Purpose Vehicle VTRUX Cargo Van 2013
Via Vans, Cargo Type VTRUX Pass Van 2013
Mercedes SUV GLE 550e 2016 (estimate)
Mitsubishi Small SUV Outlander PHEV 2016 (estimate)
Volvo SUV XC90 T8 2016 (estimate)
BMW SUV X5 xDrive 40e 2016 (estimate)
Chrysler Minivan Town & Country 2017 (estimate)
Audi SUV Q7 e-Tron Quattro 2017 (estimate)
16Table 9. OEM BEV trucks and vans and availability.
Initial Model Year/Estimated
Make EPA Class Model Year for Commercialization
Tesla Standard SUV Model X 2015 (estimate)
Nissan Van e-NV200 2016 (estimate)
As further indication of the expanding market for PEVs, companies are offering after-market vehicle
upgrades involving addition of plug-in capabilities to OEM vehicles. For example, Echo Automotive
headquartered in Scottsdale, Arizona offers a “…low-cost, bolt-on, plug-in hybrid system that can quickly
be installed on new or existing fleet vehicles to increase fuel efficiency and decrease operating costs – all
without affecting the OEM power train or requiring costly infrastructure.”6 EVAOS conducts upgrades of
Ford F-series pickup trucks to PHEV models and has delivered vehicles to the U.S. Air Force.7 Options
such as these conversions might be of benefit for vehicles in the MCBCL fleet for which no replacement
PEV is currently available.
2.4 Plug-In Electric Vehicle Charging
Refueling electric vehicles presents some challenges and some opportunities not encountered when
refueling petroleum-fueled vehicles. Recharging the battery of a PHEV follows the same methodology as
that for BEVs. The Task 3 infrastructure report provides detailed information on recharging PEVs.
Most PEV manufacturers supply an alternating current (AC) Level 1 cordset with the vehicle, which
provides sufficient capabilities for some drivers, but more typically provides an emergency backup
capability because of the long recharge times. AC recharging capabilities found in the public arena more
typically are AC Level 2.
Because the battery of a BEV is typically much larger than that of a PHEV, recharge times are longer.
BEVs that see daily mileage near the limits of the advertised range do better when recharged using AC
Level 2 electric vehicle supply equipment (EVSE) or direct current (DC) fast charging, because AC
Level 1 recharge times are usually extensive. PHEVs, on the other hand, generally can use AC Level 1
EVSE for overnight charging to ensure a fully charged battery at the start of daily use. AC Level 2 EVSE
units provide greater range in the shortest amount of time when intermediate or opportunity charging. DC
fast charging provides the fastest recharge capability for those vehicles equipped with DC fast charge
inlets; however, currently, no PHEVs have DC fast charging capability available and there are no
announced plans for one to be introduced. The Task 3 reports show that the PEVs studied do not need to
rely on DC fast charging to complete their missions.
3. VEHICLE MISSION REPLACEMENT GUIDANCE
3.1 Background and Methods
Section 2.2 identified the mission categories for analysis. The Task 3 report provided specific
information for the monitored fleet based on vehicle mission. When suitable PEV types are available to
replace the internal combustion engine (ICE) vehicles in the current fleet, the specific mission of the
vehicle to be replaced can be a guide in determining whether a BEV or PHEV should be selected. As
previously noted, the greater fuel cost savings and greenhouse gas (GHG) reductions occur with BEVs
than with PHEVs, which suggests a greater emphasis on BEVs. For MCBCL, the missions monitored
included pool, support, enforcement, and two specialty vehicles.
6
http://www.echoautomotive.com/index.php?option=com_content&view=article&id=8 [accessed July 14, 2014].
7
http://www.evaos.com [accessed November 20, 2014].
17Aside from specific mission functions, the distance a PEV can travel in CD mode between charge
opportunities is the most important factor in considering vehicle replacement. The two most significant
considerations in vehicle analysis include the vehicle’s total daily travel and vehicle outings.
3.2 Pool Mission Guidance
Ten of the vehicles monitored at MCBCL were assigned a pool mission. These vehicles included
one sedan, two minivans, two sports utility vehicles (SUVs), two passenger vans, one cargo van, and two
pickups. The overall summary for these vehicles is shown in Table 10. These vehicles traveled
6,672 miles, logged 446 hours, and idled for 155 hours during the 31-day study period.
Table 10. MCBCL pool vehicle travel summary.
Pool Vehicles Travel Summary
Per Day Per Outing Per Trip
Average/Peak Average/Peak Average/Peak Total
Travel Distance (Miles) 35.9/289.4 8.9/537.2 4.6/258.5 6,672
Travel Time (Minutes) 144.0/1,140.0 35.9/875.0 18.4/504.0 26,781
Idle Time (Minutes) 50.2/NA 12.5/NA 6.4/NA 9,328
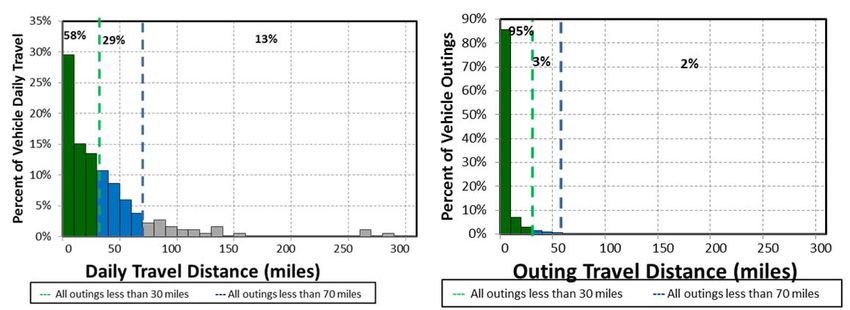
Figure 4 shows daily travel and outing travel for the group of pool vehicles.
Figure 4. MCBCL pool vehicle daily and outing travel.
The highest outing distance of 537 miles is not displayed in Figure 4 for clarity of scale. A BEV’s
safe range is considered to be 70 miles (blue and green bars in Figure 4). While a BEV’s range can vary
based on several factors, most BEVs provide at least 70 miles of vehicle range on a single battery charge.
The average travel distance per day when driven for pool vehicles was 35.9 miles. On 87% of the
vehicle travel days, the daily travel was less than the 70 miles considered to be within the BEV safe
range. Meanwhile, 58% of vehicle travel days were less than 30 miles considered to be within the CD
range of a PHEV (green bars of Figure 4).
The average outing distance driven by pool vehicles was 8.9 miles. Further, 98% of the outing travel
was less than the 70 miles considered to be within the BEV safe range (blue and green bars in Figure 4).
Meanwhile, 95% of the vehicle outings were less than the 30 miles considered to be within the CD range
of a PHEV (green bars of Figure 4).
In general then, if a suitable PEV body style meets vehicle requirements, then 87% of a pool fleet
could be BEVs and 13% PHEVs to allow for daily travel greater than the range of the BEV. The fleet
18manager would likely desire a more conservative approach to allow for flexibility, but this shows the high
capability of BEVs to meet the pool mission at MCBCL.
3.3 Support Mission Guidance
Forty-three of the vehicles monitored at MCBCL provided a support mission. These vehicles included
three compact and mid-size sedans, three minivans, five SUVs, 23 pickup trucks, six passenger vans, and
three cargo vans. The overall summary for these vehicles is shown in Table 11. These vehicles traveled
36,601 miles, logged 1,745 hours, and idled for 439 hours during the study period.
Table 11. MCBCL support vehicle travel summary.
Support Vehicles Travel Summary
Per Day Per Outing Per Trip
Average/Peak Average/Peak Average/Peak Total
Travel Distance (Miles) 46.0/405.0 18.1/1,012.4 6.8/208.1 36,601
Travel Time (Minutes) 131.5/836.0 51.7/1,443.0 19.4/362.0 104,690
Idle Time (Minutes) 33.1/NA 13.0/NA 4.9/NA 26,336
Figure 5 shows the daily travel and outing travel for the group of support vehicles.
Figure 5. MCBCL support vehicle daily travel and outage distance.
Figure 5 does not show the highest outings of 1,012; 788; and 785 miles for clarity of scale.
The average travel distance per day when driven for support vehicles was 46 miles. On 77% of the
vehicle travel days, the daily travel was less than the 70 miles considered to be within the BEV safe range
(blue and green bars in Figure 5). In addition, 46% of vehicle travel days were less than 30 miles
considered to be within the CD range of a PHEV (green bars of Figure 5).
The average travel outing when driven for support vehicles was 18.1 miles. On 95% of these vehicle
outings, the distance traveled was less than the 70 miles considered to be within the BEV safe range.
Meanwhile, 5% of support outing travel was greater than 70 miles. Furthermore, 80% of vehicle travel
outings were less than the 30 miles considered to be within the CD range of a PHEV.
In general then, if a suitable PEV body style meets vehicle requirements, 77% of the support fleet
could be BEVs and 23% PHEVs to allow for daily travel greater than the range of the BEV. The fleet
manager would likely desire a more conservative approach to allow for flexibility, but this shows the high
capability of BEVs to meet the support mission at MCBCL.
193.4 Enforcement Mission Guidance
Enforcement vehicles are typically light-duty motor vehicles specifically approved in an agency’s
appropriation act for use in apprehension, surveillance, police, or other law enforcement work.
Enforcement missions can vary by agency, location, and jurisdiction; however, they typically utilize
sedans, minivans, vans, or small pickup trucks and typically do not carry specific cargo or equipment with
the exception of K-9 units. Five of the vehicles monitored at MCBCL provided the enforcement mission.
These vehicles included two SUVs and three pickup trucks. The overall summary for these vehicles is
shown in Table 12. These vehicles traveled 6,106 miles, logged 520 hours, and idled for 295 hours during
the study period.
Table 12. MCBCL enforcement vehicle travel summary.
Enforcement Vehicles Travel Summary
Per Day Per Outing Per Trip
Average/Peak Average/Peak Average/Peak Total
Travel Distance (Miles) 51.3/208.1 20.6/167.6 6.8/99.7 6,106
Travel Time (Minutes) 262.4/1,464.0 105.5/1,209.0 35.0/752.0 31,228
Idle Time (Minutes) 149.7/NA 60.2/NA 20.0/NA 17,726
Figure 6 shows the daily travel and outing travel for the group of enforcement vehicles. The average
travel distance per day when driven for enforcement vehicles was 51.3 miles. On 73% of the vehicle
travel days, the daily travel was less than the 70 miles considered to be within the BEV safe range (blue
and green bars in Figure 6). Meanwhile, 27% of vehicle travel days were less than the 30 miles
considered to be within the CD range of a PHEV (green bars of Figure 6).
The average outing distance driven by support vehicles was 20.6 miles. Further, 95% of the outing
travel was less than the 70 miles considered to be within the BEV’s safe range (blue and green bars in
Figure 6). Meanwhile, 80% of vehicle outings were less than the 30 miles considered to be within the CD
range of a PHEV (green bars of Figure 6).
Figure 6. MCBCL enforcement vehicle daily travel and outing travel.
In general, if a suitable PEV body style meets vehicle requirements, 73% of an enforcement fleet
could be BEVs and 27% PHEVs to allow for daily travel greater than the range of the BEV. However,
enforcement fleet managers typically will desire vehicles without range limitations and would favor a
higher percentage of PHEVs. The specific duties of some enforcement vehicles, such as parking
20enforcement, could be accomplished by BEVs. Although more PHEVs might be desired, this analysis
shows the high capability of BEVs to meet this enforcement mission at MCBCL.
3.5 Specialty Mission Guidance
Two of the vehicles monitored at MCBCL provided a specialty mission. One is a refrigeration truck
and the other a bucket truck. The refrigeration truck, operated as a pool vehicle, was not used during the
study period. The overall summary for the bucket truck is shown in Table 13. This vehicle traveled
237 miles, logged 21 hours, and idled for 12 hours.
Table 13. MCBCL specialty vehicle travel summary.
Specialty Vehicles Travel Summary
Per Day Per Outing Per Trip
Average/Peak Average/Peak Average/Peak Total
Travel Distance (Miles) 23.7/69.4 8.5/39.0 4.8/39.0 237
Travel Time (Minutes) 126.6/271.0 45.2/171.0 25.8/152.0 1,266
Idle Time (Minutes) 2.1/NA 26.6/NA 5.2/NA 746
Figure 7 shows the daily travel and outing travel for this specialty vehicle.
Figure 7. MCBCL specialty vehicle daily travel and outage distance.
The average travel distance per day when driven for this specialty vehicle was 23.7 miles. On all
vehicle travel days, the daily travel was less than the 70 miles considered to be within the BEV safe range
(blue and green bars in Figure 7). In addition, 70% of vehicle travel days were less than the 30 miles
considered to be within the CD range of a PHEV (green bars of Figure 7).
The average outing distance driven by this specialty vehicle was 8.5 miles. All outing travel was less
than the 70 miles considered to be within the BEV safe range (blue and green bars in Figure 7).
Meanwhile, 93% of vehicle outings were less than the 30 miles considered to be within the CD range of a
PHEV (green bars of Figure 7).
In general, if a suitable PEV body style meets vehicle requirements, all of the specialty fleet could be
BEVs. However, at this writing, bucket trucks are available only in a PHEV model. This model could
fulfill the bucket truck requirements for MCBCL.
214. MARINE CORPS BASE CAMP LEJEUNE
REPLACEMENT APPROACH
Executive Order 13693 issued on March 25, 2015, directs “…that by December 31, 2020, zero
emission vehicles or plug-in hybrid vehicles account for 20 percent of all new agency passenger vehicle
acquisitions and by December 31, 2025, zero emission vehicles or plug-in hybrid vehicles account for
50 percent of all new agency passenger vehicles…”.8 The goal of the approach outlined here is to be
consistent with this executive order.
Sixty vehicles belonging to Commands and MCIE were included in the study at MCBCL. The
specific requirements of each necessitated that data be analyzed for each individual fleet. The results were
extrapolated to the entire non-tactical fleet at MCBCL.
Tables 4 and 5 identified that at the time of this report, GSA has certified five sedan vehicles for
replacement as PEVs: three PHEVs and two BEVs. Consequently, the group of potential replacements
involves only sedans – a rather small subset of fleet vehicles and only 9% of the vehicles at MCBCL.
Tables 6 through 9 identified other vehicles that are currently or soon to be available but are not listed
by GSA. These vehicles provide potential replacements for all non-tactical fleet vehicles except
heavy-duty trucks, buses, and specialty vehicles. While the PEV market has introduced and delivered
several specialty vehicles on heavy-duty truck frames (e.g., delivery trucks) and electric buses to several
customers, their charging needs are typically specialized and generally are not included in this report.
Bucket trucks were the primary exception because electric utilities are promoting the conversion of ICE
vehicles to PHEV models.
If all PEVs in the tables are included for replacement consideration, the potential includes most
(i.e., 775) of the vehicles at MCBCL, except heavy-duty trucks, non-powered vehicles, material handling
equipment, and 53 specialty vehicles.
After-market vehicle modifications are also available for converting ICE vehicles to PHEVs and may
be considered by MCBCL for vehicles types not currently available.
Appendices A and B provide the details of each monitored vehicle as reported in the Task 3 report.
These also identify the suggested PEV replacement vehicle. Note that these replacements are examples of
potential PEV replacement. When the ICE vehicle at MCBCL is scheduled for replacement, the available
PEV replacements at that time may provide a greater selection opportunity.
The replacement approach for each of the groups and the balance of the MCBCL vehicles is
presented in Appendices C and D.
There are four approaches identified for each group:
Monitored vehicles
- GSA-listed PEVs only
- All potential PEV types
Balance of the full fleet
GSA-listed PEVs only
-
- All potential PEV types.
MCBCL will need to develop their approach based on specific conditions and requirements. For
example, if GSA continues to list sedans only, either MCBCL will need to justify vehicles not listed by
8
http://www.gpo.gov/fdsys/pkg/FR-2015-03-25/pdf/2015-07016.pdf [accessed August 4, 2015]
22GSA or review vehicle needs to replace other vehicle types with sedans. For example, pickup trucks are
the most popular vehicle type, but it may be possible that the mission for many of the pickups can be
accomplished by a sedan. It is more likely that GSA will list other PEV body types in the coming years to
provide more options as more PEVs become available.
The extensive analysis conducted for monitored vehicles (Task 3) results in high confidence that the
suggested vehicle can meet the mission requirements. The suggested vehicles for the full fleet rely on
extrapolation of those monitored vehicles and the guidance identified in Section 3.
The overall plan is presented first in this section followed by the effects to each of the fleet groups.
4.1 Marine Corps Base Camp Lejeune Summary
Replacement Approach
Table 1 identified the types of vehicles by fleet group at MCBCL at the time of the analysis.
Supporting incorporation of PEVs into this fleet is the objective of this task. The full fleet inventory was
analyzed in 2015 and replacement vehicles were projected for 2015 through 2035. Tale 14 provides the
full fleet replacement projections based on GSA replacement criteria and current fleet inventory age,
quantity, and mileage. Many of the MCBCL vehicles have exceeded the minimum replacement criteria;
this is expected to continue into the coming years of these projections. Note that heavy-duty trucks and
buses were excluded from this list. Some heavy-duty specialty trucks have completed conversion to PEVs
in demonstration projects. However, few have become commercialized. Electric utilities have promoted
bucket trucks with electric drive and these were considered in this replacement approach.
Table 14. Projected fleet vehicle replacements at MCBCL.
Sedan - Sedan - Sedan- Cargo Pass.
Year Compact Midsize Large Minivan SUV Van Van Pickup Specialty Total
2015 — — 3 1 — — 1 — — 5
2016 — — 20 — 5 3 13 13 5 59
2017 — 2 — 7 6 5 5 16 2 43
2018 — 1 5 7 9 3 12 22 2 61
2019 — — 4 3 13 1 7 21 — 49
2020 — 3 3 6 12 3 13 27 3 70
2021 — 2 2 10 8 4 7 19 1 53
2022 3 12 — 3 6 6 7 16 1 54
2023 2 2 1 4 1 2 9 27 1 49
2024 — — — 6 5 5 8 23 2 49
2025 — 1 3 9 1 4 6 21 4 49
2026 1 — 2 3 — 4 2 21 7 40
2027 — — — 6 — 3 4 12 — 25
2028 — — — — 2 3 6 18 3 32
2029 — — — 2 1 8 1 23 8 43
2030 — — — — 4 1 1 33 2 41
2031 — — — — 2 1 3 12 3 21
2032 — — — — 1 1 — 5 7 14
2033 — — — — — — — 1 6 7
2034 — — — — — 3 — 2 3 8
2035 — — — — — 2 4 4 2 12
Total 6 23 43 67 76 62 109 336 62 784
23Replacing vehicles in accordance with this schedule is illustrated in Figure 8. Note that vehicles
replaced in the next few years may be replaced prior to 2035. Vehicles projected for replacement in 2030
through 2035 (i.e., 15 to 20 years from this writing) are primarily low-mileage specialty vehicles, pickups,
and vans.
As noted above, the vehicles projected for replacement in the later years of this analysis are primarily
low-mileage specialty vehicles. Because many of the vehicles projected for replacement in the next few
years will likely be replaced themselves, only the vehicles to be replaced during years 2015 through 2026
are projected for further analysis.
The projected approach to PEV introduction is to replace selected ICE vehicles with PEVs as they
would normally be replaced. The replacement approach presents a structured and gradual introduction of
PEVs into the MCBCL fleet. This approach is based on an increasing percentage of PEVs as
replacements are considered over the next few years. While no PEVs are currently in the MCBCL fleet,
this approach allows for growth in experience in management, support, and maintenance of the PEV fleet.
The presented approach for incorporation of PEVs at MCBCCL is presented in Table 15. Non-sedan
types are included to gain initial experience with the vehicle types even though they are not listed on the
GSA schedule. GSA may list some of these vehicles in the next few years.
Figure 8. Full fleet vehicle replacement projection.
24Table 15. Projected approach for the introduction of PEVs into the MCBCL fleet.
Sedan - Sedan - Sedan- Cargo Pass. Percent of all
Year Compact Midsize Large Minivan SUV Van Van Pickup Specialty Total Replacements
2015 — — 3 — — — — — — 3 60%
2016 — — 5 — 2 1 3 2 — 13 22%
2017 — 2 — 3 2 1 1 3 — 12 28%
2018 — — 4 1 2 2 2 9 — 20 33%
2019 — — 4 1 5 1 4 10 — 25 50%
2020 — 3 2 2 4 3 6 10 — 30 43%
2021 — 2 2 2 6 4 5 14 — 35 66%
2022 3 7 — 2 4 4 7 12 1 40 74%
2023 2 2 — 2 1 2 5 20 1 35 71%
2024 — — — 3 2 4 5 15 1 30 61%
2025 — 1 2 5 1 4 4 13 — 30 61%
2026 1 — 2 2 — 2 1 9 3 20 50%
Total 6 17 24 23 29 28 43 117 6 293
The vehicles replaced by this approach would result in 50% of the fleet as PEVs in 2026, assuming
the size of the fleet remains as it was in 2015. This approach exceeds the purchase percentages of the
Executive Order (Figure 9). Certainly, MCBCL can include PEVs at a greater rate if desired.
Figure 9. Projected PEVs in MCBCL fleet.
When considering replacement of vehicles with PEVs, MCBCL fleet managers may note the vehicle
mission guidance of Section 3. It would be most desirable to select a BEV if the body type and
capabilities meet the vehicle’s mission in order to gain the most benefit in fuel cost and GHG emission
reduction. In most cases, the greatest component of a particular fleet can be BEVs. The analysis in Task 3
shows that the average vehicle travels less than 8,000 miles per year. This is an average of 667 miles per
month or about 150 miles per week. This also reflects the opportunity for increasing the percentage of
BEVs over PHEVs in each fleet.
254.1.1 Replacement Approach for Sedans
Table 16 presents a planned approach for replacement of sedans with PEVs; this is the sedan portion
of Table 14. At the end of the 12-year period with this approach, 65% of fleet sedans will be PEVs with
47% BEVs and 53% PHEVs. Note that the initial years are populated more toward the PHEV because the
sedans replaced already have high usage and mileage and this allows an easier transition to PEVs. Of
course, MCBCL can select BEVs as replacement vehicles with consideration of fleet capabilities. Note
that no sedans are projected to be replaced in the year 2024.
Table 16. Planned approach for the introduction of PEV sedans at MCBCL.
Total Vehicles Percentage Cumulative
Year ICE BEV PHEV PEVs Replaced PEV/Year Percent PEV
2015 — — 3 3 3 100% 4%
2016 15 — 5 5 20 25% 11%
2017 — — 2 2 2 100% 14%
2018 2 — 4 4 6 67% 19%
2019 — — 4 4 4 100% 25%
2020 1 4 1 5 6 83% 32%
2021 — 2 2 4 4 100% 38%
2022 5 7 3 10 15 67% 51%
2023 1 3 1 4 5 80% 57%
2024 — — — — — — 57%
2025 1 3 — 3 4 75% 61%
2026 — 3 — 3 3 100% 65%
Total 25 22 25 47 72 4%
Assuming the total fleet inventory remains at 72 sedans, this replacement approach results in the fleet
composition shown in Figure 10 for the years 2015 through 2026.
Figure 10. PEV introduction of fleet sedan types 2015 through 2026.
See Appendices A and B for a list of potential replacement PEV sedans.
264.1.2 Replacement Approach for Non-Sedan Vehicles
As noted above, the non-sedan portion of the MCBCL fleet is presented separately because there are
no current GSA-listed vehicles as potential replacements. These are included in the suggested
replacement approach to allow MCBCL to gain initial experience with the vehicle types. GSA may in fact
list some of these vehicles in the next few years. The non-sedan portion of Table 14 is shown in Table 17.
Table 17. Planned approach for the introduction of non-sedan PEVs at MCBCL.
Cargo Pass. Percentage
Year Minivan SUV Van Van Pickup Specialty Total PEV/Year
2015 0 0 0 0 0 0 0 0%
2016 0 2 1 3 2 0 8 21%
2017 3 2 1 1 3 0 10 24%
2018 1 2 2 2 9 0 16 29%
2019 1 5 1 4 10 0 21 46%
2020 2 4 3 6 10 0 25 39%
2021 2 6 4 5 14 0 31 63%
2022 2 4 4 7 12 1 30 77%
2023 2 1 2 5 20 1 31 70%
2024 3 2 4 5 15 1 30 61%
2025 5 1 4 4 13 0 27 60%
2026 2 0 2 1 9 3 17
Total 23 29 28 43 117 6 246
Percent 39% 43% 70% 48% 52% 21% 48%
At the end of the 12-year period, with this approach and assuming 784 vehicles remain in the total
fleet, 48% of the non-sedan fleets will be PEVs with approximately 55% BEVs and 45% PHEVs. This
adoption is illustrated in Figure 11.
Figure 11. PEV introduction of fleet non-sedan types 2015 through 2026.
274.2 Analysis Results – Commands Group
The Commands Group fleet contains 249 vehicles, with 18 of those vehicles monitored in this study.
The monitored vehicles include two minivans, three SUVs, six passenger vans, and seven pickup trucks.
The details of each vehicle monitored are included in Appendix A. Appendix C provides the detailed
evaluation for the approach summarized in the following sections.
Table 18 identifies the projected year the current vehicle will be replaced based on GSA requirements
and extrapolated vehicle mileage. This table factors into the full table provided in Table 14.
Table 18. The anticipated replacement schedule for the Commands Group vehicles at MCBCL.
Sedan
Compact/ Sedan Sedan Mini- Cargo Pass.
Year Subcompact Midsize Large Van SUV Van Van Pickup Specialty Total
2015 — — — 1 — — 1 — — 2
2016 — — — — — — 12 6 — 18
2017 — — — 5 2 — 4 3 — 14
2018 — 1 — 7 2 — 10 9 — 29
2019 — — — 1 6 — 5 10 — 22
2020 — — 1 3 3 — 8 14 — 29
2021 — — 1 7 1 — 6 11 — 26
2022 1 6 — 1 1 2 3 5 — 19
2023 — — — — 1 — 5 4 — 10
2024 — — — 2 — — 1 4 — 7
2025 — — 2 1 1 — 1 5 — 10
2026 — — 1 — — — 1 6 — 8
Total 1 7 5 28 17 2 57 77 — 194
4.2.1 Replacement Approach for Commands Group Sedans
Table 19 presents a planned approach for the replacement of sedans with PEVs that flows into the
totals shown in Table 15. The percentage of vehicles replaced each year by PEVs is also shown in the
table. Appendix C notes that none of the sedans in the Commands group are projected for replacement
until 2022.
Table 19. Planned approach for the introduction of PEV sedans into the Commands Group.
Year ICE BEV PHEV Total PEVs Percentage PEV/Year
2015 — — — — —
2016 — — — — —
2017 — — — — —
2018 1 — — — —
2019 — — — — —
2020 — — 1 1 100%
2021 — — 1 1 100%
2022 4 3 — 3 43%
2023 — — — — —
2024 — — — — —
2025 — 2 — 2 100%
2026 — 1 — 1 100%
Total 5 6 2 8
Percent 38% 46% 15% 62%
28You can also read


