ECONOMIC IMPACT OF RIO GRANDE VALLEY REEF PROJECT - PREPARED FOR THE SOUTH PADRE ISLAND ECONOMIC DEVELOPMENT CORPORATION BY AARON ECONOMIC ...
←
→
Page content transcription
If your browser does not render page correctly, please read the page content below
ECONOMIC IMPACT OF RIO GRANDE
         VALLEY REEF PROJECT

                                           PREPARED FOR
THE SOUTH PADRE ISLAND ECONOMIC DEVELOPMENT CORPORATION
                                                     BY
                         AARON ECONOMIC CONSULTING, LLC.
                                           JANUARY, 2018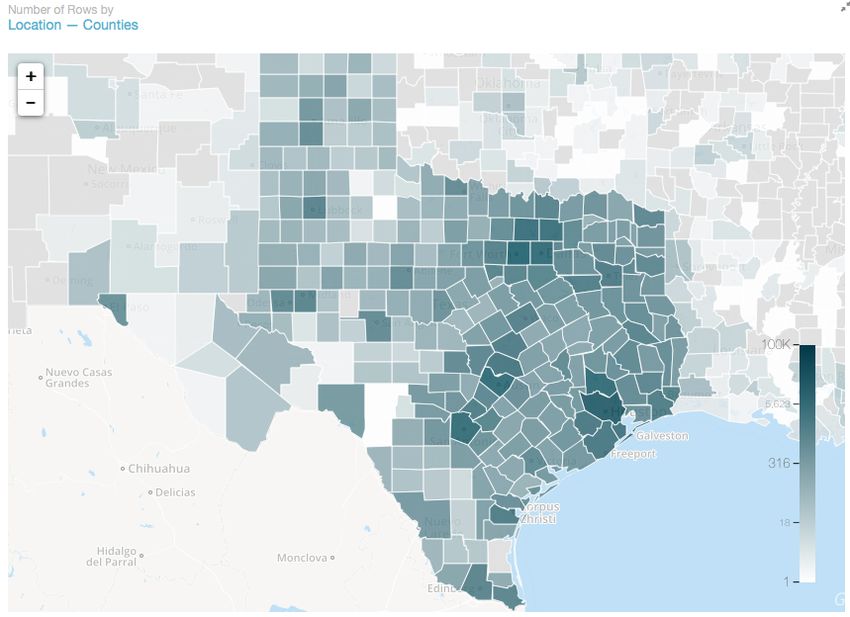
Table of Contents
EXECUTIVE SUMMARY ...................................................................................................................... 4
I- INTRODUCTION ................................................................................................................................. 6
    1.1- TEXAS ARTIFICIAL REEFS ........................................................................................................................... 7
       Figure 1: Oil and Gas Platforms in the Gulf of Mexico...........................................................................9
    1.2- THE RIO GRANDE VALLEY REEF PROJECT ........................................................................................... 9
II- STATE AND REGIONAL ANGLERS AND BOATERS DATA .............................................. 11
      Table 1. Summary of Expenditures for Fishing: 2016 ........................................................................ 12
      Figure 2: Fishing Expenditure in 2016 ..................................................................................................... 13
      Table 2. Anglers, Days of Participation, and Trips of Fishing: 2016............................................ 13
   2.1- FISHING IN TEXAS ...................................................................................................................................... 13
      Table 3. Anglers in Texas - State residents 16 years old and older .............................................. 14
      Table 4. In State/Out of State - State residents and nonresidents 16 years old and older 14
      Table 5. Fishing Expenditures in Texas - State residents and nonresidents 16 years old
      and older ................................................................................................................................................................ 15
      Table 6. Summary of Expenditures in Texas by State Residents and Nonresidents
      Combined for Fishing: 2011 - Population 16 years old and older ................................................ 15
      Table 7. Saltwater Anglers, Trips, and Days of Fishing in Texas: 2011 - Numbers in
      thousands .............................................................................................................................................................. 16
      Table 8. Saltwater Anglers, Trips, and Days of Fishing in Texas: 2011 ...................................... 17
   2.2 - BOATERS DATA .......................................................................................................................................... 17
      Table 9. Distribution of Boats by Length ................................................................................................. 18
      Table 10. Distribution by Gulf Coast County .......................................................................................... 18
      Figure 3. Distribution of Boats by Length ............................................................................................... 19
      Figure 4. Distribution of Boats by County ............................................................................................... 20
      Table 11. Hull Description of Boats............................................................................................................ 20
      Table 12. Distribution of Boats by Use...................................................................................................... 20
      Figure 5. Vessel Description .......................................................................................................................... 21
      Figure 6. Vessel Use ........................................................................................................................................... 21
      Table 13. Total Boating Expenditures ...................................................................................................... 22
   2.3- OBJECTIVES AND METHODS .................................................................................................................... 22
   2.4- ECONOMIC INPUT-OUTPUT MODEL APPLICATION - IMPLAN .................................................... 23
III- ECONOMIC IMPACT .................................................................................................................... 24
   3.1- FISHING IMPACT – RIO GRANDE VALLEY RESIDENT ..................................................................... 25
      Table 14. Fishing Impact Summary (RGV Residents)......................................................................... 25
      Table 15. Fishing Top Ten for Employment (RGV Residents) ......................................................... 25
      Table 16. Fishing State and Local Tax Impact (RGV Residents) ................................................... 26
      Table 17. Fishing Federal Tax Impact (RGV Residents) .................................................................... 26
   3.2- FISHING IMPACT – NON-RESIDENT ....................................................................................................... 27
      Table 18. Fishing Impact Summary (Non Residents) ......................................................................... 27
      Table 19. Fishing Top Ten for Employment (Non Residents) ......................................................... 27
      Table 20. Fishing State and Local Tax Impact (Non Residents) .................................................... 28
      Table 21. Fishing Federal Tax Impact by Total (Non Residents) .................................................. 28
   3.3- TOTAL FISHING IMPACT – RIO GRANDE VALLEY RESIDENT AND NON-RESIDENTS ........... 29
      Table 22. All Fishing Impact Summary (Residents and Non Residents) .................................... 29
      Table 23. All Fishing Top Ten for Employment (Residents and Non Residents) .................... 29
      Table 24. All fishing State and Local Tax Impact (Residents and Non Residents) ................ 30

                                                                                                                                                                                2
Table 25. All Fishing Federal Tax Impact (Residents and Non Residents) ............................... 30
3.4- SCUBA DIVING IMPACT............................................................................................................................. 31
Table 26. Scuba Diving Impact Summary ............................................................................................... 31
Table 27. Scuba Diving Top Ten for Employment ............................................................................... 31
Table 28. Scuba Diving State and Local Tax Impact .......................................................................... 32
Table 29. Scuba Diving Federal Tax Impact .......................................................................................... 33
3.5- TOTAL IMPACT FROM FISHING AND SCUBA DIVING ....................................................................... 33
Table 30. Total Impact Summary (Scuba Diving and Fishing) ...................................................... 33
Table 31. Total Impact Top Ten for Employment (Scuba Diving and Fishing) ...................... 34
Table 32. Total Impact State and Local Tax Impact (Scuba Diving and Fishing) ................. 34
Table 33. Total Impact Federal Tax Impact (Scuba Diving and Fishing) ................................. 35
IV- CONCLUSION ............................................................................................................................... 35
3EXECUTIVE SUMMARY
The primary goal of this report was to provide measures of overall economic value from
the Rio Grande Valley Reef Project. To accomplish that goal the objective was to use
current expenditure and artificial reef use information to determine overall spending
levels associated with diving and fishing related artificial reef activities then use the
obtained results as input into the IMPLAN models.
Survey research data was obtained from the National Survey of Fishing, Hunting, and
Wildlife-Associated Recreation, saltwater fishing license holders data from the Texas
Parks and Wildlife Department (TPWD), watercraft registration data from
Data.Texas.Gov, and scuba divers data from the author’s surveys. Impact Planning for
Analysis (IMPLAN) models for Texas and Cameron County were used with the spending
data collected from the surveys to estimate the economic impact for the Rio Grande
Valley (RGV) Reef Project.
Results from the modeling indicated that fishing and diving activity on RGV Reef Project
are expected to:
· provides 537 jobs for RGV residents.
· generates $45.6 million of economic output.
· accrues $13.9 million in income to RGV residents.
· produces $3.6 million in state and local tax revenues.
Artificial reefs are undeniably important resources both from an ecological standpoint
and an economic standpoint. RGV Reef Project is an ambitious unprecedented project
that aims to create the largest artificial reef in Texas water combining low, medium and
high profile structures. One of the principal objectives of the RGV Reef Project is to
boost the population of red snapper and offer anglers the opportunity to fish for red
snapper year round. There are over 751,000 licensed saltwater anglers in Texas and more
than 44,000 anglers in Rio Grande Valley. The average spending by saltwater anglers
statewide was $1,303 in 2011 and the average spending per angler in Rio Grande Valley
was$1,186. Saltwater anglers in Texas had an average of 7 fishing trips per year and
4spent on average 11 days fishing. RGV Reef Project could prove to be a very attractive
fishing site for anglers especially if the prospect of catching red snapper and other prized
fish species is greatly enhanced. In Addition, RGV Reef Project could attract a sizable
number of scuba divers because its design combines different relief structure and
provides a habitat for a large variety of fish and invertebrates.
The RGV Reef Project could be an economic catalyst for South Padre Island’s economy
especially if other marine related projects like the proposed marina in South Padre Island
are constructed. Combining a marina project with RGV Reef project could magnify the
multiplicative effects of increase economic activity at the island, especially if the marina
is designed to accommodate large vessels.
Watercraft registration data show that Texas Gulf coast counties have more than 114,000
registered vessels. The average expenditure by each vessel owner is around $2,500 and
includes food and drinks, boat fuel, lodging, fishing supplies, boat launch fees, as well as
maintenance and repair expenditures.
5I- INTRODUCTION
Artificial reefs are human-made underwater structures that promote marine life in areas
with a generally featureless and barren bottom. Artificial reefs are techniques by which
humans can effect changes in a marine ecosystem to enhance ecosystem conservation,
fishery production, or to be used as platforms for ecological experimentation. Artificial
reefs are not products of modern technologically advanced societies but can be traced
back to ancient times. In fact, artificial reefs date back to the times of ancient
Persians who built them in the mouth of the Tigris River not for ecological purposes
but to stop Indian pirates.1 Romans also built artificial reefs during the First Punic War
across the mouth of the Carthaginian harbor in Sicily to lock enemy ships within2.
The first artificial reefs built for ecological purposes was constructed in 17th century
Japan when rocks and rubble were used for alga-culture to grow kelp3 and to increase fish
population.
In the United States, the earliest recorded use of artificial reefs was in the 1830s when US
fishermen used interlaced logs to build artificial reefs off the coast of South Carolina to
improve fishing.4
Artificial reefs have been used for centuries to enhance fishing opportunities. However,
the placement of structures and solid materials in the marine environment can result in
some negative side impacts. Sometimes the targeted objectives to be achieved with the
construction of artificial reefs are rarely well defined, and result in inefficient use of
resources and conflicts among competing interests. For example, the indiscriminate
1. Williams, Thomas Wayne. A Case Study of Artificial Reef Decision-Making in the Florida Keys (PDF).
2. Hess, Ron; Rushworth, Denis; Hynes, Michael V.; Peters, John E. "Disposal Options for
Ships" (PDF). Rand Corporation. Archived from the original (pdf) on June 29, 2007. Retrieved 20
December 2006.
3. "Fisheries Technologies for Developing Countries". National Academies Press. Retrieved 20
December2006.[
4
"Guidelines For Marine Artificial Reef Materials" (PDF). Gulf States Marine Fisheries Commission.
Archived from the original (pdf) on January 10, 2007. Retrieved 20 December 2006.
6disposal of rigid materials in the Gulf of Mexico in sites sometimes inaccessible to
anglers obstructed navigation, and led to expensive marking. The United States
Congress, recognizing the need for comprehensive planning to guide future artificial reef
development in the U.S., passed the National Fishing Enhancement Act of 1984. That
legislation mandated the development of a National Artificial Reef Plan. The
development of the National Artificial Reef Plan was also motivated by the U.S.
Department of Interior requirement that off-shore oil and gas platforms must be removed
completely when they are no longer producing and that the sea floor must be restored to
its original condition. The conversion of offshore platforms to artificial reefs became a
practical and economical alternative to platform dismantling.
In Texas, the state legislature the passage of the Artificial Reef Act of 1989 was
acknowledgment of the potential benefits of using artificial reefs along with other fishery
management techniques to achieve optimal yield from fisheries. The act defined an
artificial reef as a structure or system of structures constructed, placed, or permitted in the
navigable water of Texas or water of the Federal Exclusive Economic Zone adjacent to
Texas for the purpose of enhancing fishery resources and commercial and recreational
fishing opportunities. The Act provided guidance for planning and developing artificial
reefs in a cost effective manner to minimize conflicts and environmental risks.
1.1- Texas Artificial Reefs
Artificial reefs have often been used to help mitigate the effects of overfishing and
environmental damages, however, there is an important economic dimension to their
creation. Artificial reefs can provide a direct economic impetus to the hospitality and
tourism industry by attracting divers and anglers and can stimulate other sectors of local
economies that are not directly connected to the reefs because of increased economic
activity.
Because of the Gulf of Mexico featureless and barren bottom and the absence of a
naturally hard sea floor, the Texas Parks and Wildlife Department (TPWD) Artificial
Reef Program promotes the creation of artificial reefs to enhance and create vital marine
habitat in the Gulf. In 1989, the Texas Legislature directed TPWD to promote, develop,
7maintain, monitor, and enhance the artificial reef potential in state waters and federal
waters adjacent to Texas to enhance fishery resources and commercial and recreational
fishing opportunities. Improvement of fishery resources is defined as the restoration or
creation of habitat to improve recruitment and spawning potential of reef associated
marine life. The direct beneficiaries of this goal are not only fishermen, but also divers,
and local industries impacted by these artificial reefs. To achieve this objective, TPWD
was directed to develop a state artificial reef plan in accordance with Chapter 89 of the
Texas Parks and Wildlife Code. TPWD has repurposed decommissioned ships and
obsolete petroleum platforms, concrete bridge material, predesigned concrete reefs such
as reef balls and pyramids, concrete culverts, natural quarry rock and other materials to
create complex, durable and stable homes for a variety of fish and marine invertebrates.
Many reefs are built using repurposed objects that were originally designed and built for
other uses, for example the Rigs-to-Reefs program sinks obsolete oil rigs, scuttling
decommissioned ships, or by deploying rubble or construction debris. Other artificial
reefs are purpose built like the Reef Ball Foundation artificial reefs built with PVC or
concrete. Some artificial reefs are the results of shipwrecks that are preserved on the sea
floor. Artificial reefs provide hard surfaces for algae and invertebrates to attach and
grow, which in turn provides elaborate structure and food for fish and other marine life.
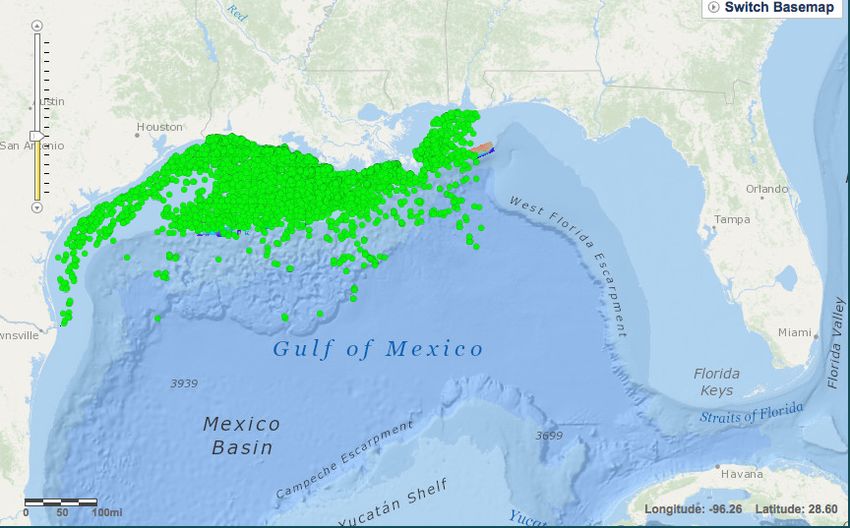
The National Oceanic and Atmospheric Administration map in Figure 1 shows the
location of the oil and gas platforms in the Gulf of Mexico. Many of these platforms
have been in service long enough for a complex marine reef system to develop and thrive.
These structures provide habitat and shelter where fish and other marine life can
congregate and reproduce. In addition, Artificial reefs help in the recovery and the
resilience of marine life especially in the aftermath of natural and human-made disasters
like hurricanes and oil spills.
8Figure 1: Oil and Gas Platforms in the Gulf of Mexico
Source: https://www.ncddc.noaa.gov/website/google_maps/FGB/mapsFGB.htm
The Gulf now has over 4,000 oil and gas platforms in State and Federal waters with a
large number of them converted to artificial reefs through national Rigs-to-Reefs
Programs. In fact, every Gulf State has an artificial reef development program. This
experience has promoted new removal techniques and cost-saving technologies making
reef development the ideal disposal alternative.
1.2- The Rio Grande Valley Reef Project
Not all artificial reefs are government funded. The Rio Grande Valley (RGV) Reef
Project is a private project spearheaded by the Friends of Rio Grande Valley Reef, a
non-profit organization dedicated to rehabilitation, restoration, and the
preservation of a healthy marine ecosystem in Texas state waters. The RGV Reef
Project is roughly 13 nautical miles north of the South Padre Island jetties and less
than 8 miles offshore.
9The permitting for RGV Reef was managed and paid for by Texas Parks and
Wildlife’s Artificial Reefing Program at the request of multiple local stakeholders
organized by Friends of RGV Reef. Permits/Leases were secured from the Texas
Historical Commission, the Texas Archeological Commission, the Texas General Land
Office, the US Coast Guard, and the US Army Core of Engineers.
The permitting process was long and tortuous. It took two years and cost TPWD
$67,000, mostly for a seafloor survey and magnetometer survey to reveal the presence of
historical shipwrecks. The final permit was issued in August of 2016.
Friends of RGV Reef raised all the deployments funds through calendar year
2017. South Padre Island’s Convention Center, and South Padre Island’s Economic
Development Corporation contributed $50,000 of the $400,000 spent so far.
In summer 2017, 600 tons of broken concrete roof tile were deployed in two large patch
reefs, equivalent to 30 semi dump truck loads, 67,000 concrete cinder blocks in 250
nursery patches, test patches of broken limestone cobbles, oyster shell, and 4
manufactured concrete slab-based low relief modules were deployed to build low relief
nursery habitat.
Mid relief habitat included 3,000 tons of broken concrete slabs and road building
concrete, including 180 eight-foot long concrete highway dividers, 75 ten-foot square box
culverts and 60 five-foot round culverts deployed in 120 patch reefs. Additionally 47
eight-foot tall manufactured reefing pyramids were placed in the reef.
Two 65-foot steel hulled vessels were deployed in the fall of 2016 to construct high relief
habitat and harvest points for snapper and other pelagic species.
In spring of 2018 a grant from the Texas General Land Office in the amount of $400,000
with a slightly smaller match from TPWD will fund the placing of 250 eight-foot tall
manufactured reefing pyramids along with 250 six-foot square slab low relief modules in
the reef.
The RGV Reef Project will be significantly larger than any other artificial reef in Texas
waters. In fact, it will cover an area equal to 41.25 percent of the combined area of all
artificial reefs in Texas. It is an unprecedented innovative large-scale multi-year project
that plans to combine low, medium, and high-relief structures over a 1,650 acres area.
10The combination of different relief profiles will provide habitat for a wide variety of fish
and other marine life. The first material sunk is two derelict vessels that will serve as
high-relief reef and will attract large fish. In addition, 3,000 tons of additional reef
material consisting of large concrete structures is readied to build mid-relief reefs.
One of the primary objectives of the RGV Reef project is to boost the stock of red
snapper and provide anglers with fishing opportunities for red snapper year-round.
Currently, no other artificial reef in Texas waters contains low-relief material, which is
unarguably an ideal nursery habitat for red snapper. This unique reef project will
provide an innovative model for artificial reef building and will boost fish populations
along the Texas Gulf coast. The benefits of the RGV Reef Project are expected to
spillover to other communities along the Texas Gulf coast because Gulf undercurrent
along the coast sweeps to the north and will distribute the increased fish population and
other marine life along the Gulf coast.
The importance of artificial reefs is undeniable whether from an ecological, biological, or
economic standpoint. However, the focus of this report is solely on the economic
benefits of the RGV Reefs Project as anglers and divers visiting the RGV Reef Project
will inject millions of dollars in direct spending to local economies through the tourism
and hospitality industry, and stimulate other sectors of the economy that are completely
unrelated to the reef project, or to fishing and diving, through indirect and induced
spending.
II- STATE AND REGIONAL ANGLERS AND BOATERS DATA
The U.S. Census conducts a periodic outdoors recreation survey, the National Survey of
Fishing, Hunting, and Wildlife-Associated Recreation. The Survey estimated that in
2016, fishing attracted 42 million individuals, 35.8 million 16 years old and older and 8.1
million youths between the ages of 6 and 15 years old, making fishing one of the most
popular outdoor recreational activities in the United States. According to the report,
anglers spent $46.1 billion on trips, equipment, licenses, and other items to support their
fishing activities, an average expenditure of $1,290 per angler. Almost $22 billion, 47
11percent of total spending, was spent on food, lodging, transportation, and other trip-
related costs. Expenditures on equipment were more than $21 billion or 46 percent of
total spending. The remaining 7 percent or $3.3 billion was spent on magazines,
membership dues and contributions, licenses, and other fishing expenditures. The U.S.
Census divides these anglers into three separate categories: Freshwater anglers (29.5
million), Great Lakes anglers (1.8 million) and Saltwater anglers (8.3 million). Anglers
fished 600 million days and took 492 million fishing trips. Saltwater fishing attracted 8.9
million anglers who enjoyed 86 million trips on 99 million days. They spent $10.3
billion on their trips and equipment. Table 1 summarizes anglers expenditures and Table
2 shows the number of anglers by type of fishing, number of days spent fishing, and the
number of fishing trips taken.
Table 1. Summary of Expenditures for Fishing: 2016
Expenditures Spenders
Amount Average per
(Thousands sportsperson Number Percent of Average per
Expenditure item of Dollars) (Dollars) (Thousands) sportspersons spender (Dollars)
Total, all items $80,461,445 $2,034 37,045 94 $2,172
Trip-Related Expenditures
Total trip-related $30,926,023 $782 35,300 89 $876
Food and lodging, total 10,962,927 277 30,859 78 355
Food 7,266,256 184 30,598 77 237
Lodging 3,696,672 93 9,922 25 373
Transportation, total 8,233,085 208 30,215 76 272
Public 736,002 19 3,667 9 201
Private 7,497,083 190 29,583 75 253
Other trip costs 11,730,011 297 27,574 70 425
Equipment
Expenditures
Fishing equipment 7,445,695 188 22,584 57 330
Auxiliary equipment 6,082,746 154 9,723 25 626
Special equipment 20,791,143 526 3,943 10 5,273
Source: U.S. Census. National Survey of Fishing, Hunting, and Wildlife-Associated Recreation
A 5 years comparison of the survey results (2011-2016) shows an 8 percent increase in
the number of anglers. However, total fishing-related expenditures increase was less than
proportional with a 3 percent increase.
12Figure 2: Fishing Expenditure in 2016
Fishing Expenditures: 2016
Lodging , 7%
Other Trip Costs, 19%
Food, 10%
Other Expenditures, 6%
Licenses and Fees, 1%
Equipment , 46%
Total Fishing Expenditure in 2016: $46.1 billion
Source: U.S. Census. National Survey of Fishing, Hunting, and Wildlife-Associated Recreation
Table 2. Anglers, Days of Participation, and Trips of Fishing: 2016
Participants Days of participation Trips
Type of Fishing Number Percent Number Percent Number Percent
Total Anglers 35,754 100 459,341 100 383,296 100
Total, all freshwater 30,137 84 383,192 83 322,266 84
Freshwater, except Great Lakes 29,490 82 372,660 81 311,237 81
Great Lakes 1,824 5 13,440 3 11,029 3
Saltwater 8,320 23 75,392 16 61,030 16
Source: U.S. Census. National Survey of Fishing, Hunting, and Wildlife-Associated Recreation
2.1- Fishing In Texas
Water related recreational opportunities abound in Texas Gulf coast. The most current
data for Texas is from the 2011 U.S. Census survey. The data show that 3 million Texas
residents and nonresidents fished in Texas (2.4 million anglers 16 years old and older and
523,000 anglers 6 to 15 years old). Texas residents accounted for 95 percent of all
anglers in Texas and nonresidents accounted for 5 percent. Anglers fished a total of 30.7
million days in Texas with an average of 14 days of fishing per angler. Texans fished
1329.6 million days (96 percent of all fishing days) and nonresidents fished 1.1 million days
in Texas (4 percent of all fishing days). Fishing-related expenditures in Texas totaled
$1.5 billion in 2011. Anglers spent 68 percent of total fishing expenditures on food and
lodging, transportation, and other expenses. Expenditures for food and lodging totaled
$423 million and transportation expenditures were $298 million. Spending on equipment
rental, bait, and cooking fuel, and other trip expenses totaled $325 million. In addition,
anglers spent $471 million on equipment or 31 percent of all fishing expenditures.
Fishing equipment spending, including rods, reels, and lines totaled $204 million or 43
percent of the equipment total. Auxiliary equipment expenditures, and special equipment
expenditures5 totaled $267 million or 57 percent of the equipment total. About 2 percent
of total fishing expenditures ($24 million) were on items, such as magazines, membership
dues, licenses, permits, and stamps. The average expenditure per angler was $459-$34
per day on trip-related costs in 2011 and $473 in 2016. The average expenditure per
saltwater angler was $748 with a daily average of $69 almost three times the average
expenditure of freshwater anglers ($275-$21 per day).
Table 3. Anglers in Texas - State residents 16 years old and older
Anglers 2.2 million
Residents 2.1 million
Nonresidents 114,000
Days of fishing 30.7 million
Residents 29.6 million
Nonresidents 1.1 million
Source: U.S. Census
Table 4. In State/Out of State - State residents and nonresidents 16 years old and older
Texas anglers 2.4 million
In Texas 2.1 million
In other states 523,000
Days of fishing 34.7 million
In Texas 29,6 million
In other states 5.2 million
Source: U.S. Census
5 Auxiliary equipment includes tents, special outdoors clothing, etc. while special equipment includes
boats, and vans. These items are usually purchased for fishing but could be used in activities other than
fishing.
14Table 5. Fishing Expenditures in Texas - State residents and nonresidents 16 years old
and older
Total $1.5 billion
Trip-related $1.0 billion
Equipment $471 million
Fishing $204 Million
Auxiliary and special $267 Million
Other $24 million
Source: U.S. Census
Table 6. Summary of Expenditures in Texas by State Residents and Nonresidents
Combined for Fishing: 2011 - Population 16 years old and older
Amount Average per Average per
Spenders
Expenditure item (thousands of spender sportsperson
(thousands)
dollars) (dollars) (dollars)
FISHING
Total 1,540,434 1,957 787 667
Food and lodging 422,885 1,564 270 188
Transportation 297,817 1,682 177 126
Other trip costs 324,629 1,490 218 145
Equipment (fishing) 203,698 1,431 142 79
Auxiliary equipment 27,174 217 125 11
Special equipment - - - -
Magazines, books, and DVDs - - - -
Membership dues and
- - - -
contributions
Other 17,636 539 33 8
SALTWATER FISHING
Total 890,556 684 1,303 394
Food and lodging 239,063 549 435 106
Transportation 114,357 634 180 48
Other trip costs 208,540 582 358 93
Equipment 328,596 365 900 146
SALTWATER FISHING IN RIO GRANDE VALLEY
Total 53,079 684 1,186 394
Food and lodging 14,249 549 318 106
Transportation 6,816 634 152 48
Other trip costs 12,429 582 278 93
Equipment 19,585 365 438 146
Source: U.S. Census
15In 2011, Residents and nonresidents in Texas took 5.2 million saltwater fishing trips and
spent 8.2 million days fishing. Texas residents accounted for 94 percent of all saltwater
fishing trips (4.9 million trips) and 93 percent of all fishing days (7.56 million days
fishing). Nonresidents accounted for 6 percent of saltwater fishing trips (321,000 trips)
and 7 percent of fishing days (595,000 days fishing).
Saltwater anglers in RGV spent $53.08 million on food and lodging, transportation, other
trip costs, and equipment. The average expenditure per angler was $1,186 in 2011. The
average angler spent $318 on food and lodging, $152 on transportation, $278 on other
fishing trip costs, and $438 on equipment. Table 7 shows the number of anglers and the
distribution of days spent fishing and number of fishing trips taken by residents and non-
residents.
Table 7. Saltwater Anglers, Trips, and Days of Fishing in Texas: 2011 - Numbers in
thousands
Activity in Texas
Anglers, trips, and days of Total, state residents
fishing and nonresidents State residents Nonresidents
Number Percent Number Percent Number Percent
Total anglers 751 100 685 91 6 9
Total trips 5,203 100 4,882 94 321 6
Total days 8,157 100 7,562 93 595 7
Average days of fishing 11 - 11 - 9 -
Source: U.S. Census
Among the 751,000 saltwater anglers, 27 percent fished for flounder (flatfish) on 3.8
million days of fishing, 69 percent fished for red drum (red fish) on 7.1 million days, 39
percent fished for sea-trout (weak fish) on 4.8 million days, and 31 percent fished for
other types of fish on 1.7 million days. For Texas residents red drum was the most
popular type of fish they fished for with 75 percent of Texas saltwater anglers fished for
red drum on 6.7 million fishing days, sea-trout with 42 percent of anglers on 4.5 million
days, flounder with 28 percent of anglers on 3.4 million days, and other types of fish with
32 percent on 1.6 million days.
16Table 8. Saltwater Anglers, Trips, and Days of Fishing in Texas: 2011
Numbers in thousands
Activity in Texas
Anglers and Total, state residents and
State residents Nonresidents
days of fishing nonresidents
Percent of Percent of Percent of Percent of
Number Number Number
total types anglers/days anglers/days anglers/days
ANGLERS
Total, all types
751 100 100 685 91 66 9
of fish
Flatfish
200 27 - 191 28 - -
(flounder)
Red drum
520 69 - 505 74 - -
(redfish)
Sea-trout
293 39 - 289 42 - -
(weakfish)
Another type of
231 31 - 219 32 - -
saltwater fish
DAYS
Total, all types
8,157 100 - 7,562 93 595 7
of fish
Flatfish
3,783 46 - 3,446 91 - -
(flounder)
Red drum
7,090 87 - 6,732 95 - -
(redfish)
Sea-trout
4,776 59 - 4,481 94 - -
(weakfish)
Another type of
1,655 20 - 1,590 96 - -
saltwater fish
Source: U.S. Census
2.2 - Boaters Data
Texas is home to more than 648,000 recreational boats, providing a gateway to marine
recreation in Texas Lakes and in the Gulf of Mexico. Texas’s importance to boating
access also means an expanding economy related to boating and boating related
industries. In addition to the large group of boater who reside in Texas, local marine
businesses such as marinas also provide access and berthing to many non-locally owned
vessels.
The 648,673 registered vessels in Texas vary in length from less than 5 feet to 180 feet.
Table 9 below shows the distribution of watercraft by length. Boating data from
Data.Texas.Gov show that 95.85 percent of registered vessels are between 10ft and 30ft
17long. Table 10 shows the distribution of watercraft by county along the Gulf coast. The
data shows that there are more than 114,000 vessels registered in Gulf counties.
Table 9. Distribution of Boats by Length
Length in Feet Number of Registered Boats
0-10 26,500
10-20 393,000
20-30 215,000
30-40 8,856
40-50 3,016
50-60 686
60-70 299
70-80 245
80-90 173
90-100 26
100-110 6
110-120 0
120-130 0
130-140 0
140-150 0
150-160 0
160-170 0
170-180 0
180-190 2
Source: https://data.texas.gov
Table 10. Distribution by Gulf Coast County
Gulf Counties Number of Registered Boats
Aransas 2,034
Brazoria 10,000
Calhoun 1,131
Cameron 4,495
Chambers 2,231
Galveston 13,500
Harris 59,300
Jackson 635
Jefferson 7,687
Kenedy 0
Kleberg 536
Matagorda 1,266
18Nueces 8,147
Refugio 190
San Patricio 2,257
Willacy 333
Source: https://data.texas.gov
Figure 3. Distribution of Boats by Length
Source: https://data.texas.gov
19Figure 4. Distribution of Boats by County
Source: https://data.texas.gov
Table 11. Hull Description of Boats
Hull Description Number of Registered Boats
Fiberglass 434,000
Aluminum 194,000
Plastic 10,300
Wood 1,791
Rubber/Vinyl/Canvas 1,449
Steel 1,375
Other 772
No Description Available 4,892
Source: https://data.texas.gov
Table 12. Distribution of Boats by Use
Vessel Use Number
Pleasure 644,000
Other Commercial 1,211
Commercial Fishing 1,138
Livery 979
Government/ Political Subdivision 939
Charter Fishing 23
Commercial Passenger 12
Source: https://data.texas.gov
20Figure 5. Vessel Description
Source: https://data.texas.gov
Figure 6. Vessel Use
Source: https: //data.texas.gov
21Table 13. Total Boating Expenditures
Type Amount Percent
Lodging $53,487,943 1.86%
Food and drinks $129,589,551 4.52%
Groceries and misc. purchases $155,273,486 5.41%
Fishing supplies $203,368,593 7.09%
Boat launch fees $38,983,914 1.36%
Equipment rental $9,714,722 0.34%
Other boat supplies $230,265,597 8.02%
Boat fuel costs $365,483,748 12.73%
Other $67,291,134 2.34%
Total Trip Expenses $1,253,458,691 43.67%
Marina/Slip/yacht club fees and dues $222,477,996 7.75%
Storage fees (not included above) $22,190,207 0.77%
Bottom paint/haul out $121,301,575 4.23%
Engine repair & maintenance $222,343,506 7.75%
New/used replacement engine $174,775,659 6.09%
Electronic/electric repair $38,518,390 1.34%
New/used electronics $140,546,065 4.90%
Sails/rigging repair & maintenance $15,609,006 0.54%
Sails/rigging replacement $29,699,036 1.03%
Other boating equipment & supplies $115,684,683 4.03%
Misc. boatyard services $45,167,058 1.57%
Trailer maintenance & repair $40,633,985 1.42%
Trailer replacement $42,397,210 1.48%
Insurance (boat, towing, etc.) $189,675,168 6.61%
Boat club, association dues $28,531,844 0.99%
Taxes and registration fees $49,419,051 1.72%
Winterizing boat $48,595,525 1.69%
Boating magazines and publications $10,399,288 0.36%
Other $58,590,045 2.04%
Total Non-Trip Expenses $1,616,555,299 56.33%
Source: U.S. Census. National Survey of Fishing, Hunting, and Wildlife-Associated Recreation
2.3- Objectives and Methods
The primary objective of this study is to estimate the level of economic activity arising
from construction of the RGV Reef Project. The expected change in economic activity
estimated is from the change fishing and scuba diving activities that are attributable to the
22RGV Reef project. This report used expenditure data from the National Survey of
Fishing, Hunting, and Wildlife-Associated Recreation on saltwater fishing by resident
and non-resident anglers. To complete an overall picture of artificial reefs related
economic activity, resident diving expenditure information obtained from prior diving
surveys conducted by the author was used for determining the economic impacts of
artificial reefs in the Rio Grande Valley. Based upon ranges of estimated total diving and
saltwater fishing expenditure, projections of the total economic impact were derived
using standard regional industry input-output methods. The economic impacts of anglers
and divers spending on the region’s economy are defined in terms of income,
employment, value added, and total output.
2.4- Economic Input-Output Model Application - IMPLAN
Economic impact analysis begins with introducing a shock or change in the level of
economic activity using the multiplier model to analyze the effects on a region’s
economic base. Most regional input-output analyses attempt to estimate either, the
economic impact of narrow or specific changes in final demand for a given set of
products, and services, or the broader economic impact of specific industries in a regional
or national economy. The research described herein accomplishes the latter task. It
assesses the economic significance of fishing and diving activities on the region’s
economy.
The standard input-output model estimates three types of impacts: the direct (primary
impact), indirect, and induced (secondary impacts) economic impacts of some basic
economic activity. The primary and secondary effects estimates provide an estimate of
the “multiplier” effects that would result for initial shock to the basic activity (direct
impact).
Most economic impact studies use information from a regional inter-industry impact
model such as Impact Planning for Analysis (IMPLAN). IMPLAN is a nationally
recognized economic model used for community/regional economic impact analysis
across the country. The model uses input-output analysis in conjunction with regional
social accounting matrices and multipliers. IMPLAN divides the total national economy
23into 440 industrial sectors based on the North American Industry Classification System
(NAICS) codes related to agriculture, extraction, manufacturing, transportation,
wholesale trade, retail trade, services and government. Data on these 440 industry sectors
is based on national input/ output or industry transaction tables6. The IMPLAN model
used herein was regionalized for this study to reflect Cameron County.
III- ECONOMIC IMPACT
The total estimated the economic impact attributable to the RGV Reef Project combines
the impacts from fishing and from scuba diving. The fishing impact is divided into two
categories: fishing by RGV residents and fishing by non-residents. It is important to
separate the impact of the two groups because their spending patterns differ significantly.
For example, spending on lodging by residents may be very minuscule since they live
within driving distances from the fishing sites. On the other hand expenditures on
lodging by non-resident anglers may constitute a sizeable portion of total fishing
expenditures. In addition, non-residents spend more days fishing per fishing trip than
residents. The economic impact estimated is first for RGV anglers, the second impact is
for non-resident anglers, the third impact is for the combine impact of all anglers
irrespective of the residency status, the fourth impact estimated is for scuba diving
enthusiasts, and the final impact estimated is the combined impact of anglers and divers.
The impact is summarized as follows:
• Summary impact table that presents the direct, indirect, induced impacts of
each activity on employment, labor income, value-added, and output.
• Top 10 employment-impacted sectors.
• State and local tax impact.
• Federal tax impact
6 Minnesota IMPLAN Group, 2017
243.1- Fishing Impact – Rio Grande Valley Resident
The economic impact of RGV anglers on output is estimated at $37.2 million, $27
million in direct impact, $5.9 million in indirect impact, and $4.3 million in induced
impact. RGV anglers contributed a total of $19.2 million to the region’s economy in the
form of value-added. Approximately $18 million leaks out of the region in the form of
payment to non-local suppliers and service providers. RGV anglers are also responsible
for 442 jobs in Cameron County.
Table 14. Fishing Impact Summary (RGV Residents)
Impact Type Employment Labor Income Value Added Output
Direct Effect 378 $8,798,453 $14,627,914 $26,967,050
Indirect Effect 30 $1,291,111 $2,195,307 $5,886,711
Induced Effect 34 $1,254,665 $2,396,617 $4,316,512
Total Effect 442 $11,344,230 $19,219,838 $37,170,272
The top 10 employers impacted are sporting goods stores (158 jobs), food services and
drinking places (103 jobs), lodging (68 jobs), miscellaneous retail (43 jobs), car rental
(9), gas stations (7), health practitioners (3), wholesale trade (2), real estate
establishments (2), and employment services (2).
Table 15. Fishing Top Ten for Employment (RGV Residents)
Labor Value
Description Employment Output
Income Added
Retail Stores - Sporting goods, hobby, book
158 $3,703,422 $6,098,184 $9,943,646
and music
Food services and drinking places 103 $2,043,356 $3,060,942 $7,172,528
Hotels and motels, including casino hotels 68 $1,872,983 $3,392,552 $6,193,119
Retail Stores - Miscellaneous 43 $797,746 $1,152,391 $1,606,400
Automotive equipment rental and leasing 9 $406,601 $841,471 $2,114,788
Retail Stores - Gasoline stations 7 $167,567 $388,009 $584,243
Offices of physicians, dentists, and other
3 $187,933 $219,049 $355,990
health practitioners
Wholesale trade businesses 2 $133,435 $230,515 $313,567
Real estate establishments 2 $91,234 $497,910 $733,606
Employment services 2 $46,851 $50,564 $80,491
RGV anglers’ fiscal impact is summarized in Tables 16 and 17. Table 16 shows the state
and local tax impacts and Table 17 shows the federal tax impact. State and local sales tax
is estimated at $1,1 million with $287,109 going to local governments and $869,089
25going to the state government. In addition, RGV anglers generated $1.2 million in
property tax. Total tax revenue generated at both the state and local level is estimated at
$3 million.
Table 16. Fishing State and Local Tax Impact (RGV Residents)
Tax on
Employee Proprietor
Description Production Households Corporations
Compensation Income
and Imports
Dividends $57,258
Social Ins Tax- Employee
$9,129
Contribution
Social Ins Tax- Employer
$39,278
Contribution
Tax on Production and Imports:
$1,147,198
Sales Tax
Tax on Production and Imports:
$1,191,504
Property Tax
Tax on Production and Imports:
$20,795
Motor Vehicle Lic
Tax on Production and Imports:
$208,784
Severance Tax
Tax on Production and Imports:
$146,981
Other Taxes
Tax on Production and Imports:
$92,816
S/L NonTaxes
Corporate Profits Tax
Personal Tax: Income Tax
Personal Tax: NonTaxes
$47,902
(Fines- Fees
Personal Tax: Motor Vehicle
$8,847
License
Personal Tax: Property Taxes $6,454
Personal Tax: Other Tax
$2,619
(Fish/Hunt)
Total State and Local Tax $48,407 $2,808,077 $65,822 $57,258
Table 17. Fishing Federal Tax Impact (RGV Residents)
Tax on
Employee Proprietor
Description Production Households Corporations
Compensation Income
and Imports
Social Ins Tax- Employee
$515,795 $140,668
Contribution
Social Ins Tax- Employer
$521,625
Contribution
Tax on Production and
$111,608
Imports: Excise Taxes
Tax on Production and
$51,977
Imports: Custom Duty
Tax on Production and
$85,797
Imports: Fed NonTaxes
Corporate Profits Tax $230,196
26Personal Tax: Income Tax $470,510
Total Federal Tax $1,037,420 $140,668 $249,381 $470,510 $230,196
3.2- Fishing Impact – Non-Resident
Non-RGV anglers estimated contribution to output is $7 million, $5.1 million in direct
impact, $1.1 million in indirect impact, and $804,109 in induced impact. The value-
added to the region’s economy by Non-RGV anglers is $3.6 million. Approximately $3.4
million leaks out of the region as payment to non-local suppliers and service providers.
Non-RGV anglers are also responsible for 80 jobs in Cameron County.
Table 18. Fishing Impact Summary (Non Residents)
Impact Type Employment Labor Income Value-Added Output
Direct Effect 67 $1,629,606 $2,734,855 $5,071,775
Indirect Effect 6 $249,982 $424,274 $1,123,617
Induced Effect 6 $233,728 $446,457 $804,109
Total Effect 80 $2,113,315 $3,605,587 $6,999,501
The top 10 employers impacted are sporting goods stores (25 jobs), food services and
drinking places (14 jobs), lodging (13 jobs), miscellaneous retail (9 jobs), general
merchandise retail (4), car rental (3), gas stations (1), health practitioners (less than 1),
wholesale trade (less than 1), and employment services (less than 1).
Table 19. Fishing Top Ten for Employment (Non Residents)
Description Employment Labor Income Value Added Output
Retail Stores - Sporting goods, hobby,
book and music
25 $582,182 $958,641 $1,563,151
Food services and drinking places 14 $287,537 $430,729 $1,009,303
Hotels and motels, including casino
13 $355,500 $643,921 $1,175,481
hotels
Retail Stores - Miscellaneous 9 $170,272 $245,968 $342,873
Retail Stores - General merchandise 4 $101,523 $151,204 $245,342
Automotive equipment rental and
leasing
3 $151,038 $312,578 $785,571
Retail Stores - Gasoline stations 1 $27,421 $63,495 $95,607
Offices of physicians, dentists, and
other health practitioners
0 $35,010 $40,806 $66,317
Wholesale trade businesses 0 $24,671 $42,620 $57,975
Employment services 0 $9,137 $9,861 $15,697
27Non-RGV anglers’ fiscal impact is presented in Tables 20 and 21. Table 20 shows that
the estimated state and local sales tax impacts is estimated at $216,669 with $52,526
going to local governments and $164,143 going to the state government. In addition,
RGV anglers generated $225,037 in property tax. Total tax revenue generated at both the
state and local level is estimated at $562,507.
Table 20. Fishing State and Local Tax Impact (Non Residents)
Tax on
Employee Proprietor
Description Production Households Corporations
Compensation Income
and Imports
Dividends $10,871
Social Ins Tax- Employee
$1,701
Contribution
Social Ins Tax- Employer
$7,318
Contribution
Tax on Production and Imports:
$216,669
Sales Tax
Tax on Production and Imports:
$225,037
Property Tax
Tax on Production and Imports:
$3,927
Motor Vehicle Lic
Tax on Production and Imports:
$39,432
Severance Tax
Tax on Production and Imports:
$27,760
Other Taxes
Tax on Production and Imports:
$17,530
S/L NonTaxes
Corporate Profits Tax
Personal Tax: Income Tax
Personal Tax: NonTaxes
$8,923
(Fines- Fees
Personal Tax: Motor Vehicle
$1,648
License
Personal Tax: Property Taxes $1,202
Personal Tax: Other Tax
$488
(Fish/Hunt)
Total State and Local Tax $9,019 $530,355 $12,262 $10,871
Table 21. Fishing Federal Tax Impact by Total (Non Residents)
Tax on
Employee Proprietor
Description Production Households Corporations
Compensation Income
and Imports
Social Ins Tax- Employee
$96,097 $26,188
Contribution
Social Ins Tax- Employer
$97,183
Contribution
Tax on Production and $21,079
28Imports: Excise Taxes
Tax on Production and
$9,817
Imports: Custom Duty
Tax on Production and
$16,204
Imports: Fed NonTaxes
Corporate Profits Tax $43,707
Personal Tax: Income Tax $87,650
Total Federal Tax $193,281 $26,188 $47,100 $87,650 $43,707
3.3- Total Fishing Impact – Rio Grande Valley Resident and Non-Residents
The economic impact on output from all anglers irrespective of their residency status is
estimated at $44.2 million, $32 million in direct impact, $7 million in indirect impact, and
$5.1 million in induced impact. Anglers contributed a total of $22.8 million to the
region’s economy with $21.4 million leaking out of the region in the form of payment to
non-local suppliers and service providers. RGV anglers are also responsible for 522 jobs
in Cameron County.
Table 22. All Fishing Impact Summary (Residents and Non Residents)
Impact Type Employment Labor Income Value-Added Output
Direct Effect 446 $10,428,059 $17,362,770 $32,038,825
Indirect Effect 36 $1,541,093 $2,619,581 $7,010,327
Induced Effect 40 $1,488,393 $2,843,075 $5,120,621
Total Effect 522 $13,457,545 $22,825,425 $44,169,773
The top 10 employers impacted are sporting goods stores (182 jobs), food services and
drinking places (117 jobs), lodging (81 jobs), miscellaneous retail (52 jobs), car rental
(13), gas stations (8), general merchandise retail (5), health practitioners (3), wholesale
trade (3), real estate establishments (2).
Table 23. All Fishing Top Ten for Employment (Residents and Non Residents)
Labor Value-
Description Employment Output
Income Added
Retail Stores - Sporting goods, hobby,
182 $4,285,603 $7,056,824 $11,506,798
book and music
Food services and drinking places 117 $2,330,892 $3,491,671 $8,181,831
Hotels and motels, including casino hotels 81 $2,228,484 $4,036,473 $7,368,600
Retail Stores - Miscellaneous 52 $968,019 $1,398,359 $1,949,273
Automotive equipment rental and leasing 13 $557,639 $1,154,049 $2,900,359
Retail Stores - Gasoline stations 8 $194,989 $451,503 $679,850
Retail Stores - General merchandise 5 $149,228 $222,253 $360,627
29Offices of physicians, dentists, and other
3 $222,943 $259,856 $422,306
health practitioners
Wholesale trade businesses 3 $158,106 $273,135 $371,543
Real estate establishments 2 $107,921 $588,979 $867,783
The total fiscal impact from fishing is presented in Tables 24 and 25. Table 24 shows
that the estimated state and local sales tax impacts is estimated at $1.4 million with $330,
634 going to local governments and $1million going to the state government. In addition,
RGV anglers generated $1.4 in property tax. Total tax revenue generated at both the state
and local level is estimated at $3.5 million.
Table 24. All fishing State and Local Tax Impact (Residents and Non Residents)
Tax on
Employee Proprietor Production
Description Households Corporations
Compensation Income and
Imports
Dividends $68,129
Social Ins Tax- Employee
$10,830
Contribution
Social Ins Tax- Employer
$46,595
Contribution
Tax on Production and
$1,363,866
Imports: Sales Tax
Tax on Production and
$1,416,541
Imports: Property Tax
Tax on Production and
$24,722
Imports: Motor Vehicle Lic
Tax on Production and
$248,216
Imports: Severance Tax
Tax on Production and
$174,740
Imports: Other Taxes
Tax on Production and
$110,346
Imports: S/L NonTaxes
Corporate Profits Tax
Personal Tax: Income Tax
Personal Tax: NonTaxes
$56,825
(Fines- Fees
Personal Tax: Motor Vehicle
$10,496
License
Personal Tax: Property Taxes $7,656
Personal Tax: Other Tax
$3,107
(Fish/Hunt)
Total State and Local Tax $57,426 $3,338,432 $78,084 $68,129
Table 25. All Fishing Federal Tax Impact (Residents and Non Residents)
Tax on
Employee Proprietor
Description Production Households Corporations
Compensation Income
and Imports
Social Ins Tax- Employee $611,892 $166,856
30Contribution
Social Ins Tax- Employer
$618,809
Contribution
Tax on Production and
$132,687
Imports: Excise Taxes
Tax on Production and
$61,793
Imports: Custom Duty
Tax on Production and
$102,001
Imports: Fed NonTaxes
Corporate Profits Tax $273,903
Personal Tax: Income Tax $558,159
Total Federal Tax $1,230,701 $166,856 $296,482 $558,159 $273,903
3.4- Scuba Diving Impact
The contribution of scuba diving enthusiasts to the economy of the region is estimated at
$1.4 million in economic output, $1 million in direct impact, $231,484 in indirect impact,
and $154,821 in induced impact. RGV anglers contribute a total of $701,119 to the
region’s economy. Approximately $712,124 million leaks out of the region in the form
of payment to non-local suppliers and service providers. RGV anglers are also
responsible for 15 jobs in Cameron County.
Table 26. Scuba Diving Impact Summary
Impact Type Employment Labor Income Value-Added Output
Direct Effect 13 $310,678 $529,175 $1,026,937
Indirect Effect 1 $51,261 $85,985 $231,484
Induced Effect 1 $45,002 $85,959 $154,821
Total Effect 15 $406,941 $701,119 $1,413,242
The top 10 employers impacted are lodging (4 jobs), food services and drinking places (4
jobs), miscellaneous retail (2 jobs), sporting goods stores (2), car rental (1), general
merchandise retail (1), gas stations (less than 1), wholesale trade (less than 1), health
practitioners (less than 1), and employment services (less than 1).
Table 27. Scuba Diving Top Ten for Employment
Labor Value-
Description Employment Output
Income Added
Hotels and motels, including casino hotels 4 $98,085 $177,663 $324,324
Food services and drinking places 4 $70,138 $105,067 $246,197
Retail Stores - Miscellaneous 2 $37,644 $54,380 $75,804
31Retail Stores - Sporting goods, hobby, book
2 $39,075 $64,342 $104,916
and music
Automotive equipment rental and leasing 1 $98,085 $177,663 $324,324
Retail Stores - General merchandise 1 $70,138 $105,067 $246,197
Retail Stores - Gasoline stations 0 $37,644 $54,380 $75,804
Wholesale trade businesses 0 $39,075 $64,342 $104,916
Offices of physicians, dentists, and other
0 $98,085 $177,663 $324,324
health practitioners
Employment services 0 $70,138 $105,067 $246,197
Scuba diving enthusiasts’ contribution to state and local tax revenues is summarized in
table 28. Table 29 summarizes the impact on federal tax revenue. Table 28 shows that
the estimated state and local sales tax impacts is estimated at $38,810 with $9,408 going
to local governments and $29,402 going to the state government. In addition, RGV
anglers generated $40,309 in property tax. Total tax revenue generated at both the state
and local level is estimated at $101,365.
Table 28. Scuba Diving State and Local Tax Impact
Tax on
Employee Proprietor
Description Production Households Corporations
Compensation Income
and Imports
Dividends $2,267
Social Ins Tax- Employee
$328
Contribution
Social Ins Tax- Employer
$1,410
Contribution
Tax on Production and
$38,810
Imports: Sales Tax
Tax on Production and
$40,309
Imports: Property Tax
Tax on Production and
$703
Imports: Motor Vehicle Lic
Tax on Production and
$7,063
Imports: Severance Tax
Tax on Production and
$4,972
Imports: Other Taxes
Tax on Production and
$3,140
Imports: S/L NonTaxes
Corporate Profits Tax
Personal Tax: Income Tax
Personal Tax: NonTaxes
$1,718
(Fines- Fees
Personal Tax: Motor
$317
Vehicle License
Personal Tax: Property
$231
Taxes
Personal Tax: Other Tax
$94
(Fish/Hunt)
32Total State and Local Tax $1,738 $94,999 $2,361 $2,267
Table 29. Scuba Diving Federal Tax Impact
Tax on
Employee Proprietor
Description Production Households Corporations
Compensation Income
and Imports
Social Ins Tax- Employee
$18,518 $5,019
Contribution
Social Ins Tax- Employer
$18,728
Contribution
Tax on Production and
$3,776
Imports: Excise Taxes
Tax on Production and
$1,758
Imports: Custom Duty
Tax on Production and
$2,903
Imports: Fed NonTaxes
Corporate Profits Tax $9,113
Personal Tax: Income Tax $16,875
Total Federal Tax $37,246 $5,019 $8,437 $16,875 $9,113
3.5- Total Impact from Fishing and Scuba Diving
The economic impact of anglers and divers on output is estimated at $45.6 million, $33
million in direct impact, $7.2 million in indirect impact, and $5.3 million in induced
impact. Anglers and divers contributed a total of $23.5 million to the region’s economy.
Approximately $22.1 million leaks out of the region in the form of payment to non-local
suppliers and service providers. RGV anglers are also responsible for 537 jobs in
Cameron County.
Table 30. Total Impact Summary (Scuba Diving and Fishing)
Impact Type Employment Labor Income Value-Added Output
Direct Effect 458 $10,738,737 $17,891,945 $33,065,762
Indirect Effect 37 $1,592,354 $2,705,566 $7,241,811
Induced Effect 41 $1,533,395 $2,929,033 $5,275,442
Total Effect 537 $13,864,486 $23,526,544 $45,583,015
The top 10 employers impacted are sporting goods stores (184 jobs), food services and
drinking places (121 jobs), lodging (85 jobs), miscellaneous retail (54 jobs), car rental
(13), gas stations (8), general merchandise retail (6), health practitioners (3), wholesale
33You can also read


