How unprecedented was the February 2021 Texas cold snap? - IOPscience
←
→
Page content transcription
If your browser does not render page correctly, please read the page content below
LETTER • OPEN ACCESS

How unprecedented was the February 2021 Texas cold snap?
To cite this article: James Doss-Gollin et al 2021 Environ. Res. Lett. 16 064056

View the article online for updates and enhancements.

                                This content was downloaded from IP address 46.4.80.155 on 03/07/2021 at 14:17
Environ. Res. Lett. 16 (2021) 064056 https://doi.org/10.1088/1748-9326/ac0278
LETTER
How unprecedented was the February 2021 Texas cold snap?
OPEN ACCESS
James Doss-Gollin1,∗, David J Farnham2, Upmanu Lall3,4 and Vijay Modi5
RECEIVED 1
28 February 2021 Department of Civil and Environmental Engineering, Rice University, Houston, TX, United States of America
2
Department of Global Ecology, Carnegie Institution for Science, Stanford, CA, United States of America
REVISED 3
7 May 2021
Columbia Water Center, Columbia University, New York, NY, United States of America
4
Department of Earth and Environmental Engineering, Columbia University, New York, NY, United States of America
ACCEPTED FOR PUBLICATION 5
Department of Mechanical Engineering, Columbia University, New York, NY, United States of America
18 May 2021 ∗
Author to whom any correspondence should be addressed.
PUBLISHED
8 June 2021 E-mail: jdossgollin@rice.edu
Keywords: energy, electricity, Texas, natural hazards, climate resilience
Original Content from
this work may be used Supplementary material for this article is available online
under the terms of the
Creative Commons
Attribution 4.0 licence.
Any further distribution Abstract
of this work must
maintain attribution to
Winter storm Uri brought severe cold to the southern United States in February 2021, causing a
the author(s) and the title cascading failure of interdependent systems in Texas where infrastructure was not adequately
of the work, journal
citation and DOI. prepared for such cold. In particular, the failure of interconnected energy systems restricted
electricity supply just as demand for heating spiked, leaving millions of Texans without heat or
electricity, many for several days. This motivates the question: did historical storms suggest that
such temperatures were known to occur, and if so with what frequency? We compute a
temperature-based proxy for heating demand and use this metric to answer the question ‘what
would the aggregate demand for heating have been had historic cold snaps occurred with today’s
population?’. We find that local temperatures and the inferred demand for heating per capita across
the region served by the Texas Interconnection were more severe during a storm in December 1989
than during February 2021, and that cold snaps in 1951 and 1983 were nearly as severe. Given
anticipated population growth, future storms may lead to even greater infrastructure failures if
adaptive investments are not made. Further, electricity system managers should prepare for trends
in electrification of heating to drive peak annual loads on the Texas Interconnection during severe
winter storms.
1. Introduction exceeded projections, and because electricity supply
failed to meet them. On the demand side, the Electric
Between February 14th and 17th, 2021, a northern Reliability Council of Texas (ERCOT), which oper-
air mass blanketed much of the continental United ates the Texas Interconnection bulk electric power
States, causing anomalously low surface temperat- system (hence ‘Texas Interconnection’), estimated
ures across the Great Plains. The state of Texas was that the peak demand would have been 76 819 MW
particularly hard hit, with coincident and cascading without load shedding [6]. This surpassed ERCOT’s
failures of natural gas production, power generation, ‘extreme winter forecast’ of 67 208 MW in its sea-
transportation, and water systems leaving millions of sonal assessment of resource adequacy [7]. On the
Texans without electricity, heat, and water, many for supply side, the Texas Interconnection experienced
several days [1–3]. These failures disproportionately over 30 000 MW of lost output for two consecutive
affected vulnerable populations [4], left at least 111 days due to outages and derates caused by cold tem-
Texans dead [5], and brought the Texas electricity grid peratures [8]. A large fraction of this supply short-
within minutes of collapse [6]. fall, which exceeded ERCOT’s worst-case scenario for
Since production and distribution of electricity is forced outages, originated in the natural gas supply
possible under conditions far colder than any Texas chain [1, 3, 8].
experienced in February 2021, energy system fail- If temperatures experienced in the region served
ures reflect inadequate preparedness for cold. These by the Texas Interconnection were unprecedented,
failures occurred both because electricity demand then this event might motivate discussion about the
© 2021 The Author(s). Published by IOP Publishing LtdEnviron. Res. Lett. 16 (2021) 064056 J Doss-Gollin et al
Figure 1. Severe cold snaps that affect Texas and extend into the central United States have several precedents in the historical
record. Plot shows anomalies of daily mean temperatures from the ERA-5 reanalysis [11] for historic major cold events affecting
Texas, defined as the departure from the seasonal (December–February) mean of the observational record. Anomalies facilitate
identification of large-scale weather patterns superimposed on long-term climatological averages. Hourly temperatures are
averaged to 1 day (a), (d), (g), (j), (m), 3 day (b), (e), (h), (k), (n), and 5 day (c), (f), (i), (l), (o) average temperature anomalies.
appropriate use of models to prepare for events that installations was across Texas. We conclude by dis-
are theoretically possible, but beyond the observa- cussing the implications of these findings for long-
tional record. On the other hand, historical precedent term electricity systems planning given anticipated
for such temperatures would suggest a broader lack population growth and electrification.
of institutional and physical readiness. It is therefore
important to assess whether historical data offered a 1.1. Previous cold snaps in Texas
precedent for the temperatures observed during Feb- Texas state climatologist John Nielsen-Gammon
ruary 2021. wrote in 2011 that ‘winter weather is a danger to
To answer this question, we first compute the TX in part because it is so rare,’ [9]. Previous cold
population weighted difference between observed snaps in Texas, notably in 1899, 1951, 1983, 1989,
temperatures and a standard indoor temperature of and 2011 (see figure 1 and supplemental figure S1
65◦ F as a proxy for the unknown heating demand, (available online at stacks.iop.org/ERL/16/064056/
then use standard statistical procedures to assess the mmedia)), have affected both human and ecological
probability with which the temperatures observed systems. For example, the 1951 cold event caused a
during February 2021 might have been expected to significant die-off of fish life in the shallow Gulf Coast
occur a priori. We then supplement this with a spa- [10].
tially distributed analysis of how unexpected the cold The specific spatiotemporal structure of a cold
experienced by local roads, water mains, gas pipelines, event, and its correspondence with population cen-
energy generation facilities, and critical infrastructure ters, determines the grid-wide demand for heating
2Environ. Res. Lett. 16 (2021) 064056 J Doss-Gollin et al
(see section 2.2). The structure of the storm also provide at least 60 years of data and if they con-
drives the aggregated hazard to energy infrastruc- tain observations for the set of historical cold
ture, which has implications for the costs and bene- extremes shown in figure 1.
fits of infrastructure hardening. The spatiotemporal
patterns of historical cold snaps in Texas are illus- We also use population density data from the
trated in figure 1 and supplemental figures S1 and S2. GPWv4 dataset [13], a list of power generation facil-
Although the spatiotemporal structure of each event ities from the US Energy Information Administration
is distinct, it is apparent that cold extremes in Texas [14], and a map of the Texas Interconnection [15].
tend to co-occur with cold temperatures across much
of the United States, particularly the Great Plains. 2.2. Inferred heating demand per capita
While the 2021 event was severe, daily temperature Most space heating in Texas is either electric or gas
extrema in Texas appear qualitatively comparable to [16] and the majority of power generation in the
historical events. The ‘Great Blizzard’ of February Texas Interconnection depends on natural gas [17].
1899, shown in supplemental figure S1, caused even Stress on natural gas production and delivery was
more intense cold. therefore just as important as the more visible stress
on the electric system [8].
2. Data and methods The hourly or daily thermal energy requirement
for space heating is primarily driven by how much
We use three distinct datasets to analyze temperature lower the ambient temperature is than an indoor
minima in the region covered by the Texas Intercon- comfort temperature of 65◦ F. This relationship is
nection through the lens of distributed (each grid cell often expressed in terms of heating degree days or
analyzed separately) and aggregated (weighted aver- hours. We therefore consider the difference between
ages taken across space) extreme values analysis. observed temperatures and a standard indoor tem-
perature of 65◦ F as a proxy for thermal heating
2.1. Datasets demand. We compute this value each hour for the
We use three temperature datasets to ensure robust ERA5 data, defining heating demand at each grid cell
findings: as HDt = max(65 − Tt , 0), where T t is the temperat-
ure at hour t in ◦ F. The Berkeley Earth and GHCN
(a) Hourly 2 m air temperature reanalysis on a datasets provide daily minimum and maximum tem-
0.25◦ grid from the ERA-5 reanalysis project peratures, so we define heating demand at each grid
T +T
produced by the European Centre for Medium cell or station as HDd = max(65 − min,d 2 max,d , 0),
Range Weather Forecasting [11] and avail- where Tmin,d is the minimum temperature recorded
able from the Copernicus Data Store (https:// on day d and Tmax,d is the maximum temperature
cds.climate.copernicus.eu) from 1950 to the recorded on day d, both in ◦ F.
present. The period from 1950 to 1979 is released To assess how spatially correlated cold spells
as a preliminary back extension. All plots shown might affect the Texas electric grid, we average heat-
in the main text use the ERA-5 data, but supple- ing demand in space over the Texas Interconnection
mental figures use other data sets. domain [15], weighting each grid cell by 2020 popu-
(b) Daily mean, minimum and maximum tem- lation density [13]. We refer to this spatially aggreg-
peratures, gridded to 1◦ , produced by Berke- ated time series, which has the straightforward inter-
ley Earth (http://berkeleyearth.org/data/). This pretation as the average heating demand experienced
gridded product is based on statistical analysis by a Texas resident, as ‘inferred heating demand per
of station data and is available from 1880 to capita.’
2019. This dataset is considered an experimental
product, so we use it only for comparative pur- 2.3. Return period
poses. Return periods define the probability with which a
(c) To complement blended gridded data products, particular event can be expected to occur. By defin-
we use station temperature data from the Global ition, an event with return period T years has a 1/T
Historical Climatology Network (GHCN) data- probability of occurring in a given year.
set compiled by the National Ocean and Atmo- For each event duration considered, we calcu-
spheric Administration [12] and available lated return periods by fitting a stationary general-
at https://www1.ncdc.noaa.gov/pub/data/ghcn/ ized extreme value (GEV) distribution to the time
daily/. This dataset provides daily mean, max- series of annual maxima of inferred heating demand
imum, and minimum temperature observations. per capita (in section 3) or to the time series of
These measurements represent point measure- −T, where T is temperature (section 4). This neg-
ments, which can differ in important ways from ative value is analyzed because the GEV distribu-
gridded products describing spatial averages due tion is justified for block maxima, but we analyze
to the spatial heterogeneity of temperature fields. annual minimum temperatures in section 4. Events
We retain stations within the state of Texas if they that occur in December are coded to the following
3Environ. Res. Lett. 16 (2021) 064056 J Doss-Gollin et al
Figure 2. The inferred heating demand per capita induced by the February 2021 cold snap is not unprecedented. For the worst 6
hours, the 1989 event was more severe than the 2021 event, while they are comparable for longer durations. (a) Time series of
annual maximum inferred heating demand per capita (section 2.2) at 6 h and 2 day durations. December extremes, including the
December 1989 storm, are coded to the following year so that one maximum per December-February winter season is retaine.
(b) The intensity-duration-frequency intervals estimated using 1950–2020 data (i.e. not using the 2021 event), overlaid by the
annual maxima from the 1989, 2011, and 2021 events. Gray dashed lines indicate 2, 5, 10, 25, 50, and 100 year return levels.
year so that a single December-February winter sea- cold temperatures. Aggregating historic temperature
son is grouped together. The 2021 winter season was fields in space using the 2020 population, we answer
excluded from return period estimates, allowing us to the question ‘what would the aggregate demand for
interpret return periods for the February 2021 event heating have been had historic cold snaps occurred
as a priori estimates. today?’
Figure 2 shows that the intensity, duration, and
2.4. Cold duration recurrence intervals of the February 2021 storm are
The effect of cold temperatures on energy demand severe but not unprecedented in the historical record.
and critical infrastructure depends on how long the For example, at the 6 hour duration the Decem-
cold persists. Short duration cold snaps can kill ber 1989 storm was substantially more intense and
plants, freeze exposed pipes, freeze wind turbines, and other storms including February 1951 were nearly
contribute to dangerous roadway conditions. Longer as intense. At the two day duration, the 2021 and
duration cold spells contribute to demand for heat- 1989 events were approximately equally intense and
ing and energy and cause pipes to burst even if they other storms including December 1983 were nearly as
have some insulation. We calculate demand for heat- intense. The 2011 storm, which caused rolling black-
ing by taking temporal averages over a range of dura- outs and motivated research into the energy system’s
tions from 1 hour to 4 days. vulnerability to cold [18], was quite modest by com-
parison. The right panel shows statistical return peri-
2.5. Code and data ods for these extreme events.
We are committed to open science. Our open
source code is freely available in a live repository at 4. Spatially distributed temperature
https://github.com/jdossgollin/2021-TXtreme and in extremes
an archived repository at.
It is difficult to establish a spatially aggregated
3. How extreme was inferred heating proxy for supply-side risk given complex interlink-
demand per capita over the Texas ages between natural gas, electric, and other systems
Interconnection? which create the possibility for cascading failures as
observed in February 2021. Water treatment and dis-
The total shock to Texas heating demand is partially tribution systems, as well as other essential services,
determined by the extent to which cold snaps impact also rely on electricity, further increasing vulnerab-
multiple population centers simultaneously. As such, ilities. Instead of aggregating this risk in space, we
understanding whether there was precedent for a estimate the exceedance probability of the February
cold snap simultaneously affecting several regions of 2021 temperatures at each grid cell separately to shed
Texas’s grid that today have high population density light on the severity of cold experienced by installa-
is critical. We therefore use our measure of inferred tions across the region.
heating demand per capita (see section 2.2) to rep- Figure 3 shows local return periods for Febru-
resent the aggregate heating demand induced by ary 2021 temperature at 6 hour, 1 day, 2 day, and 4
4Environ. Res. Lett. 16 (2021) 064056 J Doss-Gollin et al
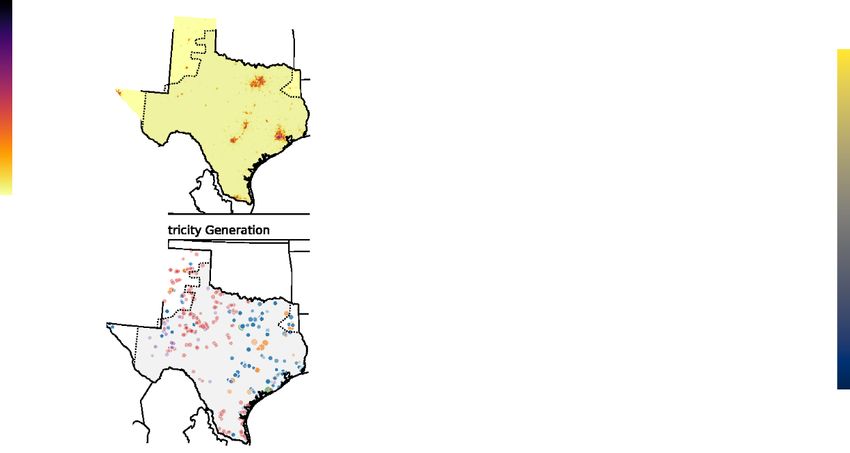
Figure 3. Return periods for the February 2021 event, calculated using stationary estimates of annual extremes over the period
1950–2020. Return periods are calculated separately for each cell. (a) Estimates of 2020 population density [13]. (d) Energy
generation facilities in Texas [14]. (b), (c), (e), (f) Local return periods for 6 hour, 1 day, 2 day, and 4 day durations, respectively.
Contours enclose regions that recorded 50 and 100 year return levels. The gray region in panels (a) and (d) shows boundaries of
the Texas Interconnection [15].
day durations. Other than a band from south-central intense cold, notably in 1989 (figure 3 and supple-
to south-east Texas, nearly all regions of the Texas mental figure S3). Yet despite temperatures that were,
Interconnection (gray outline in figures 3(a) and in aggregate, more intense, the Texas Interconnection
(d)) experienced cold with a return period below 50 experienced fewer than three hours of rolling black-
years. Results are similar using station data (supple- outs from December 21 to 23, 1989 [19, 20]. Follow-
mental figure S3). Importantly for the energy sys- ing the 1983, 1989, and 2011 cold snaps, the North
tem, the band experiencing cold with return period American Electric Reliability Corporation (NERC)
greater than 50 years includes a substantial fraction of identified ‘constraints on natural gas fuel supplies to
Texas’s population (figure 3(a)) and natural gas gen- generating plants’ and ‘generating unit trips, derates,
eration (figure 3(d)). Outside the Texas Interconnec- or failure to start due to weather related causes’ as
tion region, the Midcontinent Independent System key vulnerabilities [21], foreshadowing many of the
Operator and Southwest Power Pool instructed util- causes of February 2021 energy system failures iden-
ities to shed firm load. Yet despite local return peri- tified by ERCOT [6, 8]. While our analysis neglects
ods for temperature in central Oklahoma equal to or other meteorological factors, like freezing rain, that
greater than local return periods for temperature in may have impeded operations at specific facilities, we
Texas, 92% of the customers without power in Texas, find that the February 2021 failures of energy and
Louisiana, and Oklahoma were in Texas [1]. electricity systems in the Texas Interconnection took
place during temperatures with precedent in the his-
5. Discussion torical record.
Another cause of load shedding was the high
Our spatially aggregated metric of inferred heating demand for electricity that low temperatures induced.
demand per capita shows that the February 2021 In fact, around 55% of both residential and commer-
event was intense but not without precedent in the cial spaces in Texas are currently heated using elec-
historical record (figure 2). Although specific loc- tricity [16] and further electrification is a central ele-
ations experienced very intense (> 100 year return ment of many plans to decarbonize the energy sector
period) temperatures, we find that for most locations [22–24]. While summer peak loads have been a cent-
in Texas the temperatures recorded during the Feb- ral planning concern on the Texas grid in the past, it
ruary 2021 cold snap had precedent in the historical is likely that winter peak loads will become a greater
record. concern in the coming decades. In fact, the estim-
A proximate cause of load shedding in the Texas ated 76 819 MW of peak demand without load shed-
Interconnection during February 2021 was the vul- ding during this event [6] exceeded not only the pre-
nerability of the electricity generation system to cold vious winter demand record of 65 900 MW recorded
[17]. As shown in supplemental figure S8, generator on January 17, 2018 but also the all-season record
outages occurred across the state, even though most actual demand of 74 800 MW recorded on August
parts of the state had previously experienced similarly 19, 2019 [17]. As electrification of heating continues,
5Environ. Res. Lett. 16 (2021) 064056 J Doss-Gollin et al
severe cold snaps may drive peak demands on the Texas the opportunity to invest in a more resilient
Texas Interconnection. energy system.
Our primary findings hold for an alternative grid-
ded dataset and station data (see supplemental mater- Data availability statement
ial). However, calculated return periods are sensitive
to the method of estimation (supplemental figures S5 The data that support the findings of this study are
and S6). Future analysis could address parametric openly available at the following URL/DOI: 10.5281/
uncertainty, model structure uncertainty [25], non- zenodo.4781415 [34].
stationarity [26], or regime-like modes of climate
variability [27]. More fundamentally, an assessment Acknowledgments
of exposure to cold extremes over the next decades
should consider the deeply uncertain distribution of DJF was supported by a gift from Gates Ventures
future climate change, and the induced effect on cold LLC to the Carnegie Institution for Science. The
extremes in Texas. Although a broad scientific con- authors thank Daniel Cohan, Sylvia Dee, Elisabeth
sensus suggests the frequency of cold extremes should Gawthrop, Pedram Hassanzadeh, Fred Heutte, Adam
decrease under warming in most places [28], pos- Massmann, Alison Silverstein, Vivek Srikrishnan, and
sible links between North-South temperature gradi- Edgar Virgüez for discussion of this work. The
ents and mid-latitude temperature extremes remains authors also thank the developers and maintainers
an area of active research [29–32]. Regardless, the of the open source packages we used, in particular
effect of climate change on peak demand for heating the pydata and pangeo communities, and the many
is likely to be small compared to the effect of rapid journalists and academics whose timely reporting and
population growth which the Texas Water Develop- commentary has informed our thinking.
ment Board, for example, anticipates to be 40% from
2020 to 2050 [33]. ORCID iDs
Our analysis quantifies the frequency with which
the temperatures observed during February 2021 James Doss-Gollin https://orcid.org/0000-0002-
could have been expected to occur a priori. Other 3428-2224
factors also govern infrastructure performance and David J Farnham https://orcid.org/0000-0002-
failure, including precipitation, the demand for nat- 6690-4251
ural gas in adjacent regions, and complex connec- Upmanu Lall https://orcid.org/0000-0003-0529-
tions within and between regional systems. Similarly, 8128
decisions at multiple time scales, including disaster Vijay Modi https://orcid.org/0000-0003-2513-
preparedness and risk communication, contribute 0437
to the human consequences of physical infrastruc-
ture failure. Thus, the exact chain of events that led References
to the blackouts and water system disruptions dur-
[1] CESER 2021 Extreme cold & winter weather update #1
ing February 2021 should be sorted out only after
Technical Report, U S Department of Energy Office of
further investigations by parties on the ground in Cybsersecurity, Energy Security, and Emergency Response
Texas. [2] Clack C T M, Choukulkar A, Coté B and McKee S A 2021
ERCOT winter storm Uri blackout analysis (February, 2021)
Technical Report, Vibrant Clean Energy, LLC
[3] Smead R G 2021 ERCOT—the eyes of Texas (and the World)
6. Conclusions are upon you: what can be done to avoid a February 2021
repeat Clim. Energy 37 14–8
The February 2021 cold snap was the most intense in [4] Dobbins J and Tabuchi H 2021 Texas blackouts hit minority
neighborhoods especially hard The New York Times
30 years, but was not without precedent in the full his-
[5] Mulcahy S 2021 At least 111 people died in Texas during
torical record. In addition to the record cold condi- winter storm, most from hypothermia The Texas Tribune
tions of 1899 (supplemental figure S1), we estimate (https://www.texastribune.org/2021/03/25/texas-deaths-
that the weather of December 1989 would have res- winter-storm/)
[6] Magness B 2021 Review of February 2021 extreme cold
ulted in higher 6 hour and 2 day values of inferred
weather event
heating demand per capita over the Texas Intercon- [7] ERCOT 2020 Final seasonal assessment of resource adequacy
nection than the February 2021 event. Storms in Feb- for the ERCOT region (SARA): Winter 2020/2021 Technical
ruary 1951, January 1962, and December 1983 would Report Electric Reliability Council of Texas
[8] ERCOT 2021 Update to April 6, 2021 preliminary report on
have resulted in at least 90% as much inferred heat-
causes of generator outages and derates during the February
ing demand per capita at 24 and 48 hour durations. 2021 extreme cold weather event Technical Report Electric
Given upward trends in the electrification of heat- Reliability Council of Texas
ing, it is likely that future cold snaps will cause peak [9] Nielsen-Gammon J W 2011 The Changing Climate of Texas
(Austin, TX: University of Texas Press)
annual loads on the Texas Interconnection to occur
[10] Gunter G 1951 Destruction of fishes and other organisms on
during the winter season. Infrastructure expansion the South Texas Coast by the cold wave of January
necessitated by a rapidly growing population offers 28–February 3, 1951 Ecology 32 731–6
6Environ. Res. Lett. 16 (2021) 064056 J Doss-Gollin et al
[11] Hersbach H et al 2020 The ERA5 global reanalysis Q. J. R. [23] Davis S J et al 2018 Net-zero emissions energy systems
Meteorol. Soc. 146 1999–2049 Science 360 eaas9793
[12] Menne M J, Durre I, Vose R S, Gleason B E and Houston T G [24] White P M and Rhodes J D 2019 Electrification of heating
2012 An overview of the global historical climatology in the Texas residential sector Technical Report
network-daily database J. Atmos. Ocean. Technol. 29 897–910 IdeaSmiths, LLC
[13] CIESIN 2016 Gridded population of the world, version 4 [25] Wong T E, Klufas A, Srikrishnan V and Keller K 2018
(GPWv4): population density Technical Report Center for Neglecting model structural uncertainty underestimates
Int. Earth Science Information upper tails of flood hazard Environ. Res. Lett.
Network—CIESIN—Columbia University, Palisades, NY, 13 074019
[14] USEIA 2021 Preliminary monthly electric generator [26] Milly P C D, Betancourt J, Falkenmark M, Hirsch R M,
inventory (based on Form EIA-860M as a supplement to Kundzewicz Z W, Lettenmaier D P and Stouffer R J 2008
Form EIA-860) Stationarity is dead: whither water management? Science
[15] USEIA 2021 North American Electric Reliability 319 573–4
Corporation (NERC) Regions [27] Doss-Gollin J, Farnham D J, Steinschneider S and Lall U
[16] Waite M and Modi V 2020 Electricity load implications of 2019 Robust adaptation to multiscale climate variability
space heating decarbonization pathways Joule 4 376–94 Earth’s Future 7 734–47
[17] Everhart K and Molnar G 2021 Severe power cuts in Texas [28] IPCC 2014 Climate change 2014: synthesis report
highlight energy security risks related to extreme weather Contribution of Working Groups I, II and III to the fifth
events Technical Report Int. Energy Agency Assessment report of the Intergovernmental Panel on
[18] FERC and NERC 2011 Report on outages and curtailments Climate Change Technical Report Int. Panel on Climate
during the Southwest cold weather event Technical Report Change, Geneva, Switzerland
Federal Energy Regulatory Commission and North [29] Barnes E A 2013 Revisiting the evidence linking Arctic
American Electric Reliability Corporation amplification to extreme weather in midlatitudes Geophys.
[19] NERC 1989 ERCOT emergency operation December 21–32, Res. Lett. 40 4734–9
1989. Technical Report North American Electric Reliability [30] Cohen J et al 2014 Recent Arctic amplification and extreme
Corporation mid-latitude weather Nat. Geosci. 7 627–37
[20] Osborne J 2021 A tale of two freezes: how the Texas power [31] Screen J A and Simmonds I 2013 Exploring links between
grid stayed on in the 1989 cold snap Houston Chronicle Arctic Amplification and mid-latitude weather Geophys. Res.
(https://www.houstonchronicle.com/business/energy/ Lett. 40 959–64
article/A-tale-of-two-freezes-How-the-Texas-grid-stayed- [32] Romanowsky E, Handorf Dorthe, Jaiser R, Wohltmann I,
16005807.php) Dorn W, Ukita J, Cohen J, Dethloff K and Rex M 2019 The
[21] NERC 2013 Assessment of previous severe winter weather role of stratospheric ozone for Arctic-midlatitude linkages
reports 1983–2011 Technical Report North American Electric Sci. Rep. 9 7962
Reliability Corporation, Atlanta, GA [33] Texas Water Development Board 2012 Water for Texas 2012
[22] Williams J H, DeBenedictis A, Ghanadan R, Mahone A, Jack state water plan Technical report
Moore W R Morrow S P and Torn M S 2012 The technology [34] Doss-Gollin J 2021 Research codes for “How unprecedented
path to deep greenhouse gas emissions cuts by 2050: the was the 2021 Texas cold snap?” (Version 1.0) (https://doi.
pivotal role of electricity Science 335 53–9 org/10.5281/zenodo.4781415)
7You can also read