RethinkX Energy Disruption Methodology
←
→
Page content transcription
If your browser does not render page correctly, please read the page content below
RethinkX Energy Disruption Methodology

Version: 1.1

Version Date: November 10, 2020

Authors: Adam Dorr & Tony Seba

Contact: energy@rethinkx.com

Introduction
This methodological note presents the data sources, logic, and assumptions upon which our energy
sector modeling is based. It is important to emphasize that the regional scenarios based on this
modeling are not explicit forecasts. Rather, the purpose of these scenarios is to map the boundaries
within which actual outcomes are likely to fall, so that others can use our findings to make more precise
forecasts for their geographic region based on their own policy and investment choices.

The overarching conclusion that we have reached based on this research is that it is far more feasible for
most of the populated regions of the globe to meet most or all of their electricity needs cleanly with a
combination of solar PV, onshore wind power, and batteries (SWB) than is widely reported in other
conventional analyses or believed by policymakers, investors, and the public. This is a crucially important
finding that changes the global energy conversation looking ahead to the 2020s and into the 2030s.

Our approach differs from most other analyses in that it provides estimates for both the total capital
cost of electricity assets as well as the system electricity cost (SEC) for optimal mixes of solar PV, wind
power, and battery capacity at the scale of the entire system, rather than only levelized costs at the
scale of individual facilities. These two metrics together allow policymakers, investors, and other
decisionmakers to compare the cost of energy technologies in terms of both initial investment and long-
term expenditure. Our reason for adopting this macro level of analysis instead of a micro level one is to
fill a notable knowledge gap in the existing electricity sector analysis literature and thereby aid
decisionmakers in planning for a clean energy future based on a clear understanding that rapid
disruption of the electricity sector is possible by 2030.

Data
We use hourly load and generation data as inputs to our capacity requirements model. These data are
reported by the electrical grid system operators: ISO New England for New England, ERCOT for Texas,
and California ISO for California.1–3 Note that these “ground truth” data from the system operators
themselves differ somewhat from numbers reported at the state level by government agencies because
the system operator service area is less than 100% of each state, and so we scale the data accordingly.
The time period of our analysis is two years, running from July 1 2017 through June 30 2019. This period
was chosen because it is the most recent and therefore the most reliable time during which the same
hourly data were available for all three regions.
Capacity Requirements
We use a systems dynamics approach to determine the amount of solar PV, wind, and battery energy
storage capacity that is required to meet a given percentage of electricity demand in any geographic
region. Explicitly modeling the generation, storage, and consumption of electricity as stocks and flows
within the ISEE Systems Stella Professional software environment allows us to construct a meaningful
simulation of the region’s system of electricity supply and demand dynamics (Figure 1).
Figure 1: New England Electricity Supply and Demand – Systems Dynamics Model

Source: RethinkX, 2020.

The model takes as inputs the region’s historical hourly electricity demand (in megawatts), hourly solar
PV power generation (in megawatts), and hourly wind power generation (in megawatts). Adjustments
for solar PV and wind power capacity additions are made in equal increments at each hour, based on
annual reported capacity changes. We then normalize the capacity-adjusted solar PV and wind power
generation data as a percentage of the maximum generation output in each period of the source data
(typically one calendar year). The resulting normalized range from 0% to 100% provides accurate proxies
for the natural variability profile, and thus the availability, of sunshine and wind resources.

In contrast to other approaches that attempt to simulate resource availability via geophysical modeling,
our use of existing generation data as a proxy for natural resource availability obviates the need to
model a prohibitively large number of endogenous variables in the system, and at the same time it also
reduces error from other exogenous/unknown variables.

Once normalized, the hourly solar PV and wind power generation values are then multiplied by user-
defined parameters (Solar Capacity and Wind Capacity) to scale the simulated quantity of solar and wind
electricity generation (SW Supply) for every hour of the year as needed. We assume that electricity
output scales linearly with installed capacity.

Alongside solar PV and wind power generation is a quantity of conventional reserve capacity comprised
of an unspecified mix of other energy sources (e.g. natural gas, hydropower, nuclear power, and/or
interregional electricity imports). In our Limit Case scenarios this quantity is set to zero, but this quantity
remains a user-defined parameter (Reserve Capacity) for use in modeling other scenarios in the future`.
The optimal use of conventional reserve capacity is to proactively charge the batteries whenever
possible rather than to reactively enter service when a supply shortage appears imminent, and so this is
the behavior that we model. However, it should be noted that actual reserve capacity utilization
patterns will differ substantially based on region-specific conditions, policies, and choices.

The Supply Demand Gap element of the model then tracks the difference between electricity demand
and solar PV, wind, and (if applicable) conventional reserve power supply at each successive hour. When
this difference is negative, a corresponding quantity of electricity is discharged from the battery in order
to ensure that demand is met. When this difference is positive, a corresponding quantity of electricity
(subject to roundtrip efficiency losses controlled by the user-defined Battery Efficiency parameter)
charges the battery for later use. We assume that the battery energy storage capacity will be comprised
of lithium-ion chemistries, and because this technology has a very high charge/discharge rate (i.e. power
input/output capability) relative to energy storage capacity, the model assumes that the battery stock is
always capable of meeting any power output or charging input level required. (Battery charge and
discharge power ratings are denoted as c-rates, which are a ratio of power output to energy storage
capacity. A high-performance 100kWh lithium-ion electric vehicle battery can discharge at a temporary
peak of 5C, or 500KW power output. A stationary 100 kilowatt-hour lithium-ion battery might sustain
2C, or 200 kilowatts power output. In our Limit Scenario, California would have nearly 1,200 gigawatt-
hours of battery energy storage capacity installed, which at 2C would allow for a sustained discharge
power output of 2,400 gigawatts. This is 48 times higher than the highest-ever peak electricity demand
recorded by CAISO of 50.1 gigawatts).

The simulation starts at midnight on July 1 (i.e. mid-summer in the northern hemisphere) with the
batteries in a fully-charged state. Note that this assumption is crucial, because it is not realistic to
assume the batteries will have a full charge during other seasons of the year. As the simulation proceeds
into the winter season, overall discharging exceeds overall charging for extended periods, resulting in a
progressive drawdown of energy in the batteries during these periods. Then, as the simulation
progresses into the spring and summer season, the situation reverses and overall charging begins to
exceed overall discharging, resulting and the batteries progressively building up stored energy until they
once again reach a state of full charge. Note, however, that there is considerable weather-induced
stochasticity on shorter time intervals (days to weeks) around these general patterns of system
behavior. The total required battery capacity to prevent an electricity supply shortfall is thus equal to
the largest drawdown experienced during the entire simulation, which will typically occur in late winter.
Note that by disallowing any electricity supply shortfall, our model’s conditions are effectively
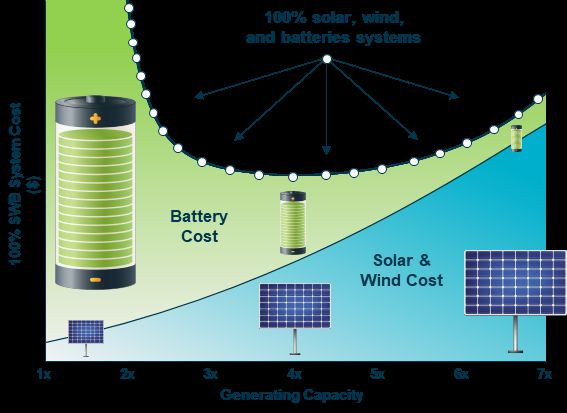
equivalent to requiring 100% generation uptime (although supply shortages will still of course occur in
any centralized electricity system due to inevitable localized faults in transmission and distribution
infrastructure).

The culmination of our systems dynamics modeling is that for each geographic region we can identify
the electricity supply capacity requirements for different combinations of installed SWB. Our analysis
identifies these combinations at 1-gigawatt solar PV capacity, 1-gigawatt wind capacity, and 1-gigawatt-
hour battery capacity intervals. Given the uncertainties inherent in both the source data and the
modeling itself, any reported precision below the gigawatt scale would be spurious.

The Clean Energy U-Curve
A key insight that emerges from our analysis is that energy generation and storage capacity can be
operationally equivalent and thus traded off against one another based on capital cost according to a
convex (u-shaped) cost function, as shown in Figure 2. We term this insight the Clean Energy U-curve.
Figure 2: The Clean Energy U-Curve

Source: RethinkX, 2020.

Generation capacity is defined as a percentage or multiplier of peak electricity demand, so that where a
100% or 1x capacity system could meet all electricity demand at its highest hour in the year (typically
occurring sometime in mid-summer), a 200% or 2x capacity system would have twice that amount of
solar PV and/or wind power capacity installed.
This convex relationship between generation and storage capacity was not initially obvious when the
costs of SWB were high relative to conventional electricity generating technologies just a few years ago.
The predominant reason why is that older models of generation and storage capacity mixes were
optimized for minimal energy use based on the assumption this would indirectly correlate to cost
optimization. In reality, direct optimization on the basis of future costs yields dramatically different
results. As costs of SWB have passed parity with coal, natural gas, and nuclear power and are on track to
become far cheaper still over the course of the 2020s, the logic of trading off generation for storage
capacity has become increasingly clear.4–6

Clean Energy Super Power
The lowest-cost mix of energy generation and storage capacity for 100% SWB systems will have between
3x and 5x more generating capacity than today’s grid. As a result, a surplus of clean energy from solar PV
and wind power generation will be available on the majority of days of the year at close to zero marginal
cost.

We call this surplus of electricity clean energy super power, or just super power for short.

Super power will create extraordinary opportunities for entirely new business models in heating, water
purification, recycling and waste-processing, metal processing/smelting, heavy industry, cryptocurrency
mining, manufacturing, and carbon dioxide removal – to name just a few examples (see our other
energy publications for details).

Up until now, generation “overcapacity” has been mischaracterized by incumbents as a problem to be
avoided because surplus output from solar PV and wind installations must be curtailed in order to avoid
destabilizing the grid with excess supply, as well as to spare conventional powerplants from disruption.7–
9
  To the contrary, generating a large surplus of clean energy at near-zero marginal cost is not a bug but a
feature of future clean 100% SWB systems. Moreover, flushing huge quantities of clean energy that is
essentially free down the drain is not rational, and as with previous disruptions this is a clear indication
that the existing energy system cannot accommodate new SWB technologies and is poised to be
disrupted.
Technology Adoption
Solar PV
It is clear that the adoption trajectory of global solar PV capacity has been exponential, but the
consistency of this growth is more readily apparent when the same data are presented on a logarithmic
plot (Figure 3).
Figure 3: Global Solar PV Installed Capacity (gigawatts) – linear and logarithmic plots

Source: BP Statistical Review of World Energy, 2019.10

Solar PV has the potential to be both less expensive than wind power (both onshore and offshore) and
to be deployed across a wider variety of geographic areas. As a result, solar PV is growing more quickly
and is on course to overtake wind in total global installed capacity before 2025.
Wind Power
Similarly, the adoption trajectory of global wind power capacity has also been exponential (although at a
more modest rate), and again the consistency of this growth is more readily apparent when the same
data are presented on a logarithmic plot (Figure 4).
Figure 4: Global Wind Power Installed Capacity (gigawatts) – linear and logarithmic plots

Source: BP Statistical Review of World Energy, 2019.10

Battery Energy Storage
Lithium-ion battery energy storage is a newer technology than either solar PV or wind power, and
reliable global production, adoption, and cost data for its earliest years are not available. Nevertheless,
we see a similar trend in energy storage technology in general and lithium-ion battery technologies in
particular (Figure 5). Note that these data are based on global energy storage numbers excluding
pumped hydro, and are adjusted based on the fraction comprised of lithium-ion chemistries each year.
Figure 5: Global Lithium Battery Energy Storage Capacity (gigawatt-hours) – linear and logarithmic plots

Source: Wood Mackenzie 2019; IEA 2020; RethinkX 2020.

History shows that exponential adoption growth tends to continue until the new technology reaches
between 60% and 75% of its ultimate maximum market share, at which point the adoption trajectory
inflects into an s-curve. At current rates, and accounting for an increase in total global electricity
demand (because of continued economic development, electrification of road transportation, and
electrification of heating), we are unlikely to see the inflection of solar PV, wind power, or battery
storage into their final adoption s-curves prior to 2030.

Costs
The continued exponential adoption of solar PV, wind power, and battery energy storage worldwide
throughout the 2020s – and corresponding growth of their respective markets – will ensure that the
trend of cost improvement for each of these technologies continues from now until at least 2030. The
combination of compelling economics and public pressure to address resilience, pollution and climate
change continues to expand the scope of policy commitments to these technologies worldwide, with
both public and private investment scaling accordingly. Our methodology therefore takes the existing
cost trend for each technology since 2010 and makes a conservative extrapolation forward through the
2020s (see below).

Note that our analysis emphasizes the distinction between capital costs for generating and storage
capacity ($/gigawatt and $/gigawatt-hour respectively) versus the system electricity cost ($/kilowatt-
hour), and that our cost analysis differs from conventional analyses that utilize the obsolete, flawed, and
misleading metric of levelized cost of electricity (LCOE). (See below.)

Capital costs for generation and storage capacity (used synonymously with the more general financial
term capital expenditures or capex, and sometimes with the term upfront cost) are a familiar concept
that refers to the funds required to install a given quantity of solar PV, wind, or battery capacity (here
measured in gigawatts) respectively.

System electricity cost (SEC) is calculated by averaging all costs (i.e. both capital expenditures and
operating expenditures) incurred over the entire financial lifetime the system’s generation and storage
assets (typically 20 years) across all units of electricity (here measured in kilowatt-hours) sold during
that same period.

LCOE – A Misleading and Obsolete Cost Metric
The standard conventional cost metric of levelized cost of energy/electricity (LCOE) applies only at the
level of individual power plants, and not at the level of the system as a whole. In the past, LCOE was a
valid metric for comparing electricity generation costs on a per-kilowatt-hour basis when the electric
power sector’s technology mix was relatively constant, but it is now a fatally flawed and obsolete
measure that can no longer be used to make meaningful cost comparisons between electricity
generation technologies (see our “Every Conventional Plant is a Peaker” report for details).

Solar PV Capital Cost History and Projections
The capital cost of building solar PV capacity has declined dramatically over the last several decades.
These cost improvements have been and will continue to be driven by worldwide expansion of supply
and demand. Our assumptions about future cost improvements are therefore based upon the outlook
for continued global adoption of solar PV.

For several decades up until 2012, the majority of the cost of solar PV capacity was the photovoltaic
modules themselves.14 As the scale of module production has increased since 1980, the cost of modules
on a per-watt basis has declined at an average learning rate of 24% in accordance with an expected
technology experience curve, shown on a logarithmic plot in Figure 6 below. This means that for every
doubling of cumulative quantity of photovoltaic modules produced, the cost per-watt has declined by
roughly 24%. (A learning rate of 24% is very steep compared to most other manufacturing industries).
Figure 6: Solar PV Experience Curve (learning rate = 24.0%)

Source: Fraunhofer ISE, 2020.

Since 2012, other component costs such as inverters, mounting hardware, installation, and permitting
soft costs have together come to comprise the majority of solar PV capacity capital costs. Nevertheless,
each of these component costs is also continuing to decline as the industry scales up, and thus the
overarching trend in total capital cost per gigawatt of installed capacity in the United States has been
one of steady improvement at an average rate of 16.1% each year over the last decade.14,15 Our analysis
conservatively assumes that solar PV capacity costs will continue to decline throughout the 2020s at an
average annual rate of 12% (Figure 7).
Figure 7: Solar PV Capacity Cost (2019 USD per Kilowatt) – Logarithmic Plot

                                     $10,000
    Capacity Cost ($ per kilowatt)

                                      $1,000

                                       $100

Source: NREL, 2018. RethinkX projections 2019-2030.

Note that the average capacity cost of solar PV on a per-kilowatt basis reached parity with onshore wind
power in 2016. Solar PV has become substantially cheaper in the years since, and it will continue to
extend its cost lead over both wind power and all other electricity generation technologies over the
course of the 2020s.

Onshore Wind Capacity Cost History and Projections
The learning rate for wind power, both onshore and offshore, has been less consistent and less
precipitous than that of solar PV technology over the last 40 years. Nevertheless, the cost of onshore
wind power capacity in the United States has declined quite steadily at an average rate of 6.2% each
year over the last decade and is likely to continue to do so over the next decade.16 Our analysis
conservatively assumes that onshore wind capacity costs will continue to decline over the course of the
2020s at an average annual rate of 5.5% (Figure 8).
Figure 8: Onshore Wind Capacity Cost (2019 USD per Kilowatt) – Logarithmic Plot
Capacity Cost ($ per kilowatt) $10,000
$1,000
$100
Source: Lawrence Berkeley National Laboratory, 2018. RethinkX projections 2019-2030.
Battery Energy Storage Capacity Cost History and Projections
The learning rate for lithium-ion battery technology has been very impressive, with costs of individual
cells falling by an average of 17% with each doubling of cumulative capacity produced.17 Unfortunately,
although lithium-ion batteries first reached the market in 1991, reliable global cost and production data
for large scale battery packs (i.e. those used at utility scale and in electric vehicles) are not available
from earlier than 2010, and so it is difficult to accurately track the technology’s experience curve in its
initial years. However, we can infer the early history of the experience curve from cell-level cost and
production data in consumer electronics.17
Battery systems include other costs beyond the battery pack alone, including both additional equipment
costs (e.g. control systems) and soft costs (e.g. site preparation, permitting and inspection, and
developer returns), but it is not clear at this early stage which costs are or will be bundled with reported
“pack level” figures. Because only a handful of grid-scale battery storage facilities have been constructed
to date, data for these costs are neither available nor reliable enough to be meaningful at this early
stage in the disruption. In addition, these costs (unlike battery cells and packs themselves) have not yet
benefited from scaling and are likely to decline very sharply from their present levels as deployment
rapidly grows to the gigawatt-hour level worldwide. Pack-level data reported by mainstream analysts
differs significantly and is notably higher than cost figures claimed by individual industry leaders such as
Tesla, and we have found that neither are possible to accurately verify. Our assessment is that the actual
pack-level cost is substantially lower than currently reported by mainstream analysts and is closer towhat Tesla and other leaders claim, and furthermore that additional hard and soft costs will be markedly
lower than is currently projected by other mainstream analysts – consistent with the same pattern seen
in many previous disruptions. Finally, it is unclear which hard and soft costs will be bundled with
interconnection, transmission, and distribution infrastructure costs that are excluded from this analysis
(see Omitted Variables & Constraining Assumptions below). For all of these reasons, our capital cost and
system electricity cost calculations (see below) are based on projections of pack-level battery costs
alone.
The cost of battery energy storage capacity in the United States has declined at an average rate of 20.5%
each year over the last decade and is likely to continue to do so over the next decade.18,19 Our analysis
conservatively assumes that battery energy storage capacity costs will continue to decline over the
course of the 2020s at an average annual rate of 15% (Figure 9).
Figure 9: Battery Energy Storage Capacity Cost (2019 USD per kilowatt-hour at pack level) – Logarithmic Plot
$10,000
Capacity Cost ($ per kilowatt-hour)
$1,000
$100
$10
Source: BNEF, 2017 & 2019. RethinkX projections 2020-2030.
System Electricity Cost (SEC)
Instead of using LCOE, which is a flawed metric whose unit of analysis is only meaningful at the level of
individual power plants, our analysis calculates the System Electricity Cost (SEC) per kilowatt-hour for all
centralized power generation in aggregate, including energy storage, by averaging all costs across all
kilowatt-hours of electricity served for the financial life of the system’s assets. (We conservatively
assume the financial life of SWB assets is 20 years, but actual operational life is likely to be much longer).SEC is a useful metric because it allows us to report a cost of electricity produced by a 100% SWEB
system on a per-kilowatt-hour basis that can be meaningfully compared to the historical LCOE of
conventional generating technologies.
Parameter Assumptions
For each of regional case studies, we identified future energy mixes that comprise sufficient SWB
capacities to ensure fully reliable electricity supply year-round. We then calculate costs given the
following assumptions about the relevant operational and financial parameters:
- California annual electricity demand of 285 terawatt-hours
- Texas annual electricity demand of 414 terawatt-hours
- New England region annual electricity demand of 122 terawatt-hours
- California average demand hour (for battery modeling) of 32.5 gigawatts
- Texas average demand hour (for battery modeling) of 47.2 gigawatts
- New England average demand hour (for battery modeling) of 13.9 gigawatts
- Asset financial life of 20 years
- Debt-to-equity ratio of 60:40
- Interest rate on debt of 3%
- Internal rate of return to equity of 8%
- Tax rate of 35%, allowing for tax benefits from depreciation losses
- Depreciation over 5 years following MACRS 5-year property class schedule
- Fixed operations and maintenance costs for solar PV of $5 per kilowatt
- Fixed operations and maintenance costs for wind of $40 per kilowatt
- Fixed operations and maintenance costs for batteries of $0.50 per kilowatt-hour
- Variable operations and maintenance costs for solar PV of zero
- Variable operations and maintenance costs for wind of zero
- Variable operations and maintenance costs for batteries of zero
- Operations and maintenance cost inflation rate of 2%
Omitted Variables & Constraining Assumptions
Our analysis does not include the cost of transmission and distribution (T&D) infrastructure, as these
requirements will vary dramatically between different regions. Our limit scenario makes a number of
severely constraining assumptions for the purpose of emphasizing what is possible for 100% SWB
systems. The bar for clean energy will not be nearly so high in most locations. These assumptions
include:
- No electricity imports
- No conventional operating reserve
- No other renewables
- No distributed generation or storage
- No impacts from electric vehicles
- No demand response, load shifting, energy arbitrage, or peak shaving
- No technology breakthroughs
- No subsidies, carbon taxes, or other financial innovationsThese variables are all deeply interconnected, and one cannot be meaningfully considered without the others. We have therefore chosen to set all these variables aside as constants in order to keep the scope of the analysis manageable and to focus on what is possible in the limit for 100% SWB systems. References 1. ERCOT. ERCOT Generation - Fuel Mix. ERCOT http://www.ercot.com/gridinfo/generation (2020). 2. California ISO. Production and Curtailment Data. California ISO - Managing Oversupply http://www.caiso.com/informed/Pages/ManagingOversupply.aspx (2020). 3. ISO New England. ISO New England - Energy, Load, and Demand Reports. ISO New England https://www.iso-ne.com/isoexpress/web/reports/load-and-demand/-/tree/net-ener-peak-load (2020). 4. Perez, M., Perez, R., Rábago, K. R. & Putnam, M. Overbuilding & curtailment: The cost-effective enablers of firm PV generation. Sol. Energy 180, 412–422 (2019). 5. Wärtsilä. The path towards a 100% renewable energy future. https://www.wartsila.com/docs/default-source/power-plants-documents/downloads/white- papers/general/wartsila-bwp-the-path-towards-a-100-renewable-energy-future.pdf (2018). 6. MN Solar Pathways, Clean Power Research, Putnam, Morgan & Perez, Marc. Solar Potential Analysis Report. http://mnsolarpathways.org/wp-content/uploads/2018/11/solar-potential-analysis-final- report-nov15-2.pdf (2018). 7. Specht, M. Renewable Energy Curtailment 101: The Problem That’s Actually Not a Problem At All. Union of Concerned Scientists https://blog.ucsusa.org/mark-specht/renewable-energy-curtailment- 101 (2019). 8. Putnam, M. ‘Economic Curtailment’ – what it is and how to embrace it. pv magazine USA https://pv- magazine-usa.com/2019/11/19/economic-curtailment-what-it-is-and-how-to-embrace-it/ (2019).
9. Lacey, S. Solar and Wind Curtailment: A Liability or Asset for Decarbonizing the Grid?

   https://www.greentechmedia.com/articles/read/is-solar-and-wind-curtailment-an-asset-or-liability.

10.     BP. BP Statistical Review of World Energy 2019. www.bp.com/statisticalreview (2019).

11.     US EIA. Capacity Factors for Utility Scale Generators Primarily Using Fossil Fuels. U.S. Energy

   Information Administration

   https://www.eia.gov/electricity/monthly/epm_table_grapher.php?t=epmt_6_07_a (2020).

12.     NREL. Levelized Cost of Energy Calculator | Energy Analysis | NREL. NREL Levelized Cost of

   Energy Calculator https://www.nrel.gov/analysis/tech-lcoe.html (2020).

13.     Lazard. Lazard’s Levelized Cost of Energy Analysis - Version 13.0.

   https://www.lazard.com/media/451086/lazards-levelized-cost-of-energy-version-130-vf.pdf (2019).

14.     Fu, Ran, Feldman, D. & Margolis, R. U.S. Solar Photovoltaic System Cost Benchmark: Q1 2018.

   https://www.nrel.gov/docs/fy19osti/72399.pdf (2018).

15.     Bolinger, M., Seel, J. & Robson, D. Utility-Scale Solar: Empirical Trends in Project Technology,

   Cost, Performance, and PPA Pricing in the United States – 2019 Edition. https://emp.lbl.gov/utility-

   scale-solar/ (2019).

16.     Wiser, R. & Bolinger, M. Wind Technologies Market Report | Electricity Markets and Policy

   Group. https://emp.lbl.gov/wind-technologies-market-report (2019).

17.     Schmidt, O., Hawkes, A., Gambhir, A. & Staffell, I. The future cost of electrical energy storage

   based on experience rates. Nat. Energy 2, 17110 (2017).

18.     Goldie-Scot, L. A Behind the Scenes Take on Lithium-ion Battery Prices. BloombergNEF

   https://about.bnef.com/blog/behind-scenes-take-lithium-ion-battery-prices/ (2019).

19.     US EIA. U.S. Battery Storage Market Trends. Battery Source: US EIA Battery Storage Market

   Trends 2018

   https://www.eia.gov/analysis/studies/electricity/batterystorage/pdf/battery_storage.pdf (2018).
Disclaimer
Any findings, predictions, inferences, implications, judgments, beliefs, opinions, recommendations,
suggestions, and similar matters in this report are statements of opinion by the authors and are not
statements of fact. You should treat them as such and come to your own conclusions based upon your
own research. The content of this report does not constitute advice of any kind and you should not take
any action or refrain from taking any action in reliance upon this report or the contents thereof.

This report includes possible scenarios selected by the authors. The scenarios are not designed to be
comprehensive or necessarily representative of all situations. Any scenario or statement in this report is
based upon certain assumptions and methodologies chosen by the authors. Other assumptions and/or
methodologies may exist that could lead to other results and/or opinions.

Neither the authors nor publisher of this report, nor any of their respective affiliates, directors, officers,
employees, partners, licensors, agents, or representatives provide any financial or investment advice by
virtue of publishing and/or distributing this report and nothing in this report should be construed as
constituting financial or investment advice of any kind or nature. Neither the authors nor publisher of
this report, nor any of their respective affiliates, directors, officers, employees, partners, licensors,
agents, or representatives make any recommendation or representation regarding the advisability of
purchasing, investing in, or making any financial commitment with respect to any asset, property,
and/or business and nothing in this report should be construed as such. A decision to purchase, invest in
or make any financial commitment with respect to any such asset, property, and/or business should not
be made in reliance on this report or any information contained therein. The general information
contained in this report should not be acted upon without obtaining specific legal, tax, and/or
investment advice from a licensed professional.

Nothing in this report constitutes an invitation or inducement to engage in investment activity for the
purposes of section 21 of the Financial Services and Markets Act 2000.

No representations or warranties of any kind or nature, whether express or implied, are given in relation
to this report or the information contained therein. The authors and publishers of this report disclaim,
to the fullest extent permitted by applicable law, all representations and warranties of any kind or
nature, whether express or implied, concerning this report and the contents thereof.

To the fullest extent permitted by applicable law, the authors and publisher of this report and their
respective affiliates, directors, officers, employees, partners, licensors, agents, and representatives shall
not be liable for:

        » any loss or damage suffered or incurred by you or any other person or entity as a result of any
        action that you or any other person or entity may take, or refrain from taking, as a result of this
        report or any information contained therein

        » any dealings you may have with third parties as a result of this report or any information
        contained therein
» any loss or damage which you or any other person or entity may suffer or incur as a result of
or connected to your, or any other person’s or entity’s, use of this report or any information
contained therein.
In this disclaimer, references to this report include any information provided by the authors or
publisher, or any of their respective affiliates, directors, officers, employees, partners, licensors, agents,
or representatives that relates to this report, including, without limitation, summaries, press releases,
social media posts, interviews, and articles concerning this report.You can also read